
 ?Mathematical formulae have been encoded as MathML and are displayed in this HTML version using MathJax in order to improve their display. Uncheck the box to turn MathJax off. This feature requires Javascript. Click on a formula to zoom.
ABSTRACT
The fertilizer absorption characteristics of strawberries are not clear, although appropriate fertilization is definitely necessary to ensure produce quality and quantity. This study aimed to determine the amounts of macro- and micronutrients absorbed during cultivation of strawberries and their biodistribution and utilization in the plant body. We cultivated Japanese strawberries ‘Benihoppe’ and ‘Kirapika’ in small hydroponic equipment containing a nutrient solution and determined the amounts of N, P, K, Ca, Mg, Fe, Mn, B, Zn, Cu, and Mo absorbed during and at the end of cultivation. The results revealed the adsorption levels of these elements during the cultivation period. The nutrient concentrations varied greatly among plant organs. In particular, P and B accumulated at high levels in the leaves and stem, K, Ca, Mg, Mn, Zn, and Cu accumulated in the crown, and N, Fe, and Mo accumulated in the roots. In addition, the uptake levels of N, P, K, Mg, Mn, Zn, and Cu differed between Benihoppe and Kirapika. Our results provide useful information for determining fertilizer application rates in strawberry cultivation.
1. Introduction
Dutch strawberries (Fragaria × ananassa Duchesne) were introduced in Japan in the 19th century, and their commercial cultivation started between the end of the 19th and the beginning of the 20th century (Oda Citation2016). Various cultivars and cultivation methods have been developed to date. Research on Japanese strawberries has focused on the development of particularly superior cultivars. Therefore, there are few studies on the use of fertilizers in Japanese strawberries. In other countries, soils and nutrient solutions for strawberry cultivation, including culture media (Martínez et al. Citation2013; Palencia et al. Citation2008) and nutrient concentrations, have been extensively investigated (Carusoa et al. Citation2011; Massetani, Savini, and Neri Citation2014). However, the cultivars, cultivation methods, distribution systems, and consumption trends vary greatly by country. Therefore, it is necessary to conduct region-specific research.
Strawberries are often cultivated in unsuitable environments, which results in physiological problems, including fruit discoloration, abnormal maturation, flower pollination failure, and inability of the meristem to differentiate into flowers and buds. The occurrence of these problems is thought to be influenced by a complex combination of factors, such as temperature, humidity, sunlight, CO2 concentration, plant nutrition, and plant management conditions; especially, plant nutrition is considered one of the most important elements (Narváez-Ortiz et al. Citation2018; Singhalage et al. Citation2019; Wang et al. Citation2016).
Fertilizer effects in strawberry cultivation have been examined (Wang et al. Citation2009; Zuo et al. Citation2018). However, the fertilizer absorption properties of strawberries remain unclear. Most studies have evaluated the effects of fertilizers mixed with soil on plant growth and fruit quantity and quality. However, only part of the applied fertilizer is taken up by a plant – the remainder is adsorbed by soil particles, absorbed by soil microbes, or flows off – and it is difficult to accurately measure the amount of applied fertilizer that is absorbed by the plant. This is also due to the fact that, the soil contains nutrients available for plant growth, even in the absence of fertilizer application. Therefore, in this study, we aimed to investigate nutrient absorption properties of strawberry using plants cultivated in a nutrient solution. We determined the amounts of nutrients absorbed by the plant by measuring concentration changes in the nutrient solution. In addition, we evaluated nutrient biodistribution at the end of cultivation. We expected our results to provide useful information for improving strawberry cultivation techniques.
2. Materials and methods
2.1. Plant materials and cultivation methods
We used Japanese strawberry cultivars ‘Benihoppe’ and ‘Kirapika,’ which were developed by the Shizuoka Prefectural Research Institute of Agriculture and Forestry (Iwata, Shizuoka, Japan). Seedlings were grown in a glass greenhouse, following standard cultivation methods for these cultivars (Kawata et al. Citation2016; Takeuchi Citation2016).
Two hundred seedlings were grown, and the growth points of five seedlings per cultivar were checked as needed, by microscopy. On the day flower bud differentiation was confirmed for all five seedlings, six seedlings with moderate growth were selected from each cultivar. After the roots were washed in running water, the seedlings were transferred into cultivation equipment (small hydroponic equipment; Kyowa Co., Ltd., Osaka, Japan) containing a nutrient solution. Flower bud differentiation was confirmed in Benihoppe on 28 September 2017 and in Kirapika on 21 September 2017. In this stage, the seedlings were planted in the cultivation equipment containing a nutrient solution. This equipment has an air pump that aerates the roots during cultivation ().
Figure 1. Strawberry cultivation in a small hydroponic equipment (Kyowa Co., Ltd., Osaka, Japan), using the Japanese strawberry cultivars ‘Benihoppe’ and ‘Kirapika.’.
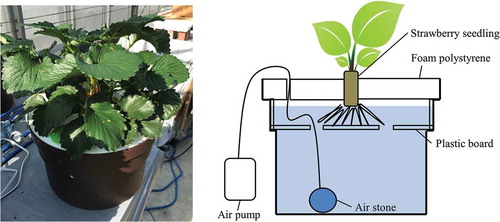
Fiberglass was pushed into a narrow gap between the plant and the cultivation equipment to prevent evaporation of the nutrient solution. The plants were cultivated in a glass greenhouse, which was heated at night to maintain a temperature above 7°C. On 30 October 2017, bees (Apis mellifera) were released in the glass greenhouse for pollination. Six seedlings, all cultivated under the same conditions, were collected for nutrient analysis. The cultivation period was ended when the seventh fruit of the first fruit cluster was collected. Developed runners were immediately collected, and the eighth and later flower buds were collected when the seventh flower bloomed. The collected runners and flower buds were stored at – 30°C, and were used as leaf and stem samples after cultivation. The fully matured fruits were stored at – 30°C. To determine plant weight when the nutrient solution was exchanged, the nutrient solution was removed by dipping the roots with non-woven fabric, and the plant was weighed.
The temperatures during cultivation were recorded using a Watch logger KT-295 F (Fujita Electric Works, Ltd., Kanagawa, Japan). The logger was shaded and hung at 50 cm above the shelf on which the cultivation equipment was placed. Temperatures were recorded every hour.
2.2. Nutrient solution
We used a basic fertilizer formulation used for nutriculture in Japan (OAT house, a prescription-based blend of plant nutrients; OAT Agrio Co., Ltd., Tokyo, Japan) that was diluted four times with ion-exchanged water and adjusted to a pH of 5.5 with potassium hydroxide solution. The electrical conductivity (EC) of the nutrient solution was 750 μS/cm. The pH and EC were measured using a pH meter (pH tester 10; Eutech Instruments Pte., Ltd., Singapore) and EC tester (EC tester 11; Eutech Instruments Pte., Ltd.). The concentrations of all components in the nutrient solution are shown in .
Table 1. Nutrient solution composition.
The nutrient solution (8 L) was added to the cultivation equipment. The nutrient solution was collected and exchanged once a week after planting until the end of cultivation. The nutrient solution was weighed on each exchange, and the amount of solution absorbed was determined by weighing the solution and converting the weight to a volume based on its specific gravity. The specific gravity was measured immediately after preparation, and the same value was applied to all samples. The nutrient solution was sampled when the solution was exchanged and the sample was stored at – 30°C. During each exchange, the cultivation equipment was washed with water and then rinsed with ion-exchanged water.
2.3. Nutrient solution analysis
The pH and EC of the nutrient solution used for cultivation were measured as described in section 2.2. The solution was then passed through a PTFE filter of pore size 0.45 µm. The concentrations of ammonium and nitrate were measured with an ion chromatograph (Dionex Integrion HPIC system; Thermo Fisher Scientific K.K., Tokyo, Japan), and inorganic N was determined from these values. The concentrations of P, K, Ca, Mg, Fe, Mn, B, Zn, Cu, and Mo in the solution were then determined using an inductively coupled plasma emission (ICP) spectrometer (Avio 500; PerkinElmer, Inc., Waltham, MA, USA), using the same sample.
2.4. Plant nutrient analysis
The seedling samples at planting and the plants sampled at the end of cultivation were divided into leaf and stem, crown, root, and fruit. All samples, except fruits, were dried in a ventilation drier set to 60°C for 48 h, and then pulverized using a miniature grinder (IFM-S30 G; Iwatani Corporation, Tokyo, Japan) for 20 s. The fruits were dried in a freeze drier (DRC-1000, FDU-2110; Tokyo Rikakikai Co., Ltd., Tokyo, Japan), and then pulverized in the same way. Two hundred milligrams of each pulverized sample was placed in a quartz cell, and the C and N concentrations were measured using an N, C, and H analyzer (NC-22 F; Sumika Chemical Analysis Service, Ltd., Tokyo, Japan). Five hundred milligrams of each pulverized sample was placed in a crucible and incinerated in an electric muffle furnace (KM-280; Advantec Toyo Kaisha, Ltd., Tokyo, Japan). During incineration, the samples were heated to 500°C for 2.5 h and then held at 500°C for another 2.5 h. The incinerated samples were dissolved in 20 mL of 0.2 mM hydrochloric acid, strained through filter paper, and analyzed by ICP emission spectrometry as described in section 2.4 to determine the concentrations of P, K, Ca, Mg, Fe, Mn, B, Zn, Cu, and Mo in the plant parts.
2.5. Data analysis
The amount of each nutrient absorbed from the nutrient solution per week was calculated using the following formula:
where y is the quantity absorbed per week (mg), c1 is the concentration of the prepared nutrient solution (mg/L), c2 is the concentration of the nutrient solution after cultivation (mg/L), v1 is the volume of the newly exchanged nutrient solution (L), and v2 is the volume of the nutrient solution after cultivation (L).
The amount of each nutrient absorbed in each plant after cultivation was calculated using the following formula:
where y is the absorbed quantity per plant part (mg), c1 is the concentration of elements in the plant part after cultivation (mg/g), c2 is the mean concentration of elements in seedlings before planting (mg/g), w1 is the weight of the plant part after cultivation (g), and w2 is the mean weight of the plant part in seedlings before planting (g).
2.6. Statistical analysis
Data are expressed as mean ± standard deviation (SD). Means were compared using analysis of variance (ANOVA) followed by Tukey’s multiple comparisons tests. Student’s t-test was used to test heteroscedasticity between two samples. A p-value < 0.05 was considered significant.
3. Results
3.1. Growth conditions
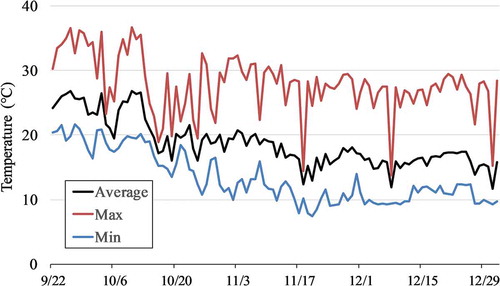
The temperatures during the cultivation period are shown in . The cultivation period was ended on 1 January 2018, after the seventh fruit of the first fruit cluster was collected. The mean time required for the harvest of the first fruit cluster was 90 days for Benihoppe and 91 days for Kirapika. First flowers bloomed on November 2 for Benihoppe and on October 23 for Kirapika.
Figure 2. Temperatures during cultivation. The temperature was recorded every hour, and the maximum, minimum, and average temperatures were calculated for each day.
3.2. Changes in the pH and EC of the nutrient solution and nutrient absorption levels during cultivation
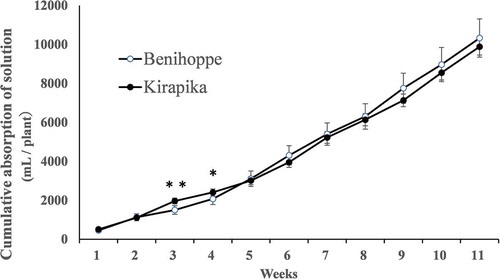
Nutrient absorption during the cultivation period is shown in . The cumulative amount of nutrient solution absorbed was significantly higher for Kirapika at weeks 3 and 4, whereas there was no difference thereafter. In both cultivars, approximately 500 mL of the nutrient solution was absorbed immediately after planting, and the volumes steadily increased thereafter to reach approximately 1300 mL per week by week 10.
Figure 3. Nutrient solution absorption amount during cultivation. Data are expressed as mean ± SD (n = 6). * and ** indicate significant differences at the 5% and 1% levels for unpaired t-tests.
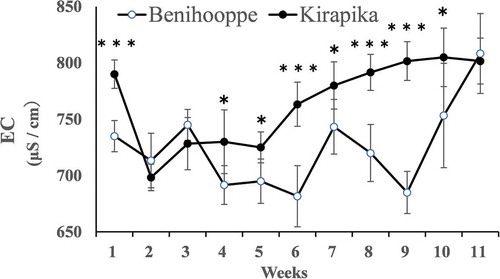
The pH and EC of the nutrient solution after one week of cultivation in a closed system are shown in and . Among the samples used in the test, the shortest individual required 81 days to complete cultivation. Therefore, the data are reported up to 11 weeks. The pH of the nutrient solution at the time of preparation was 5.5, but decreased during cultivation. The EC changes during cultivation showed no clear pattern; the EC significantly increased for Kirapika plants after 1 week and between weeks 4 and 10. Thus, Benihoppe absorbed more ions from the nutrient solution than did Kirapika, particularly between flowering and fruiting.
Figure 4. Nutrient solution pH after one week of cultivation. The pre-cultivation nutrient solution was pH 5.5. Data are expressed as mean ± SD (n = 6). Different superscript letters indicate significant differences determined by Tukey’s multiple-range test (p < 0.05).
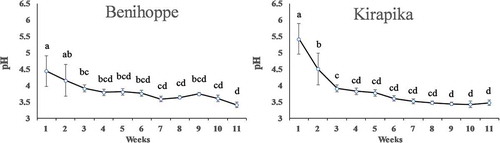
Figure 5. Nutrient solution electrical conductivity (EC) after one week of cultivation. The EC of the pre-cultivation nutrient solution was 750 μs/cm. Data are expressed as the mean ± SD (n = 6). *, **, *** indicate significant differences at the 5%, 1%, and 0.1% levels for unpaired t-tests.
3.3. Changes in plant weight during cultivation
Plant weights during and at the end of cultivation are shown in and . There were no differences between the cultivars between planting and week 5. In contrast, from 6 weeks onwards, the weight of Benihoppe plants increased significantly compared with that of Kirapika. After cultivation completion, the weights of Benihoppe roots and harvested fruit were significantly heavier.
Table 2. Weights of seedlings at planting and of plants and fruits after harvesting of the first fruit cluster.
Figure 6. Plant weight during cultivation. Plant weight includes immature fruit weight. Data are expressed as mean ± S.D. (n = 6). *, **, *** indicate significant differences at the 5%, 1%, and 0.1% levels in unpaired t-tests.
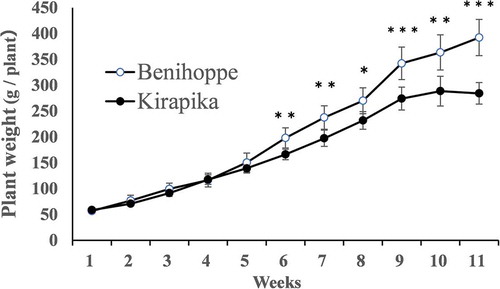
There was no difference in the root size of seedlings between the two cultivars before planting, indicating that roots of Benihoppe tend to become larger than those of Kirapika during cultivation. Benihoppe also showed a higher fruit yield for the first fruit cluster. The plant weight measured during cultivation also included the immature fruits before harvest. Therefore, differences in root and fruit weights could account for the differences in plant weight.
3.4. Nutrient absorption during cultivation
The cumulative amounts of ammonium, nitrate, and other nutrients absorbed during cultivation are shown in . The concentrations of Fe, Zn, Cu, and Mo were below the detection limit. The ammonium absorption level was higher in Benihoppe than in Kirapika at all time points measured, except 3 weeks, indicating that Benihoppe may have consumed more ammonium than Kirapika.
Figure 7. Cumulative levels of ammonium, nitrate, and various nutrients absorbed by strawberry plants during cultivation. Data are expressed as mean ± SD (n = 6). *, **, and *** indicate significant differences at the 5%, 1% and 0.1% levels for unpaired t-tests. Data show cumulative absorption at each planting time point.
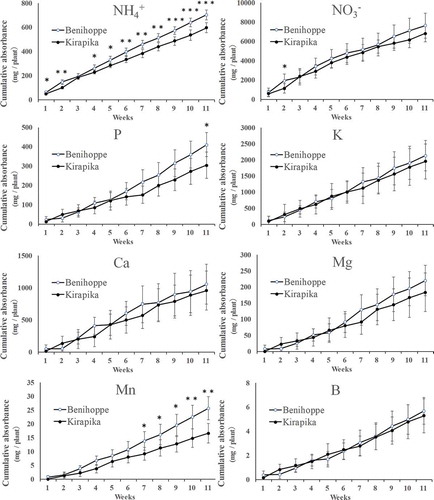
Nitrate levels were significantly higher in Benihoppe plants only after 2 weeks of cultivation, indicating there is little difference in nitrate uptake between the cultivars. As for the other nutrients, Benihoppe absorbed significantly more P and Mn than did Kirapika. There were no differences in K, Ca, Mg, and B between the cultivars. The absorption rate for each nutrient was nearly constant throughout the cultivation period.
3.5. Nutrient distribution in the plant
Nutrient concentrations in the plant at completion of the cultivation test and in the harvested fruit are shown in . The leaves, stems, and crowns had high levels of C. The leaves and stems contained high concentrations of P and B, whereas the crown had high K, Ca, Mg, Mn, Zn, and Cu levels. The roots contained high concentrations of N, Fe, and Mo. The fruits did not contain high concentrations of any particular nutrient. A comparison of the nutrient concentrations between different plant parts, excluding the fruit, revealed 10-fold differences in Fe, Zn Cu, and Mo levels.
Table 3. Distribution of carbon, fertilizer elements, and trace elements in the plants. Data are expressed as the mean ± SD (n = 6). The concentration of each element per plant organ was tested multiple times using the Tukey-Kramer method for each cultivar. Different letters in each column indicate significant differences at p < 0.05. NS and *, **, and *** indicate not significant and significant differences, respectively, between cultivars at p < 0.05, p <0.01, and p <0.001 by unpaird t-test. DW, dry weight.
Furthermore, when comparing the two cultivars, leaves and stems had higher concentrations of C, P, K, Ca, Mg, Mn, B, Zn, and Mo in Benihoppe. As for the crown, C, P, Mn, Zn, and Cu levels were higher in Benihoppe, and Ca and Mo levels were higher in Kirapika. Root levels of C, N, P, Mg, and B were higher in Benihoppe; only Fe was higher in Kirapika. Fruit levels of Mg, Fe, B, and Zn were higher in Kirapika than in Benihoppe.
3.6. Nutrient accumulation in different plant organs
The nutrient concentrations in the different plant organs at cultivation completion, after subtracting the concentrations in the seedlings at planting, are shown in . All nutrients except Fe, Zn, and Mo accumulated in the leaves and stems. Zn accumulated in the crown. In addition, Fe and Mo accumulated in the root.
Table 4. Increase in the amount of each nutrient in each plant part during plant growth. NS and *, **, and *** indicate not significant and sighnificant differences, respectively, between cultivars at p < 0.05, p < 0.01, and p < 0.001 by unpaired t-test.
When comparing the two cultivars, differences were found in various nutrients and organs. Only Ca in the crown was higher in Kirapika, and all other nutrients were higher in Benihoppe.
3.7. Nutrient concentrations in the nutrient solution and plant
shows a comparison of each nutrient in terms of the total amount absorbed from the nutrient solution and uptake in the plant body during cultivation. The divergence between the ‘extent of decrease in components in the nutrient solution during cultivation’ and the ‘extent of increase in components in the plant during cultivation’ was particularly extreme for Mn. Furthermore, Benihoppe plants presented a significantly greater increase in C than did Kirapika. Moreover, the extents of the increases in plant N, P, K, Mg, Zn, and Cu were significantly higher in Benihoppe than in Kirapika.
Table 5. Extent of the decrease in each element in the nutrient solution and increase in each element in the plant during cultivation.
4. Discussions
4.1. Growth conditions and nutrient solution
The cultivation environment, including temperatures throughout the cultivation period, and the days of flower bud differentiation and flowering were similar to conditions and findings reported previously (Kawata et al. Citation2016; Takeuchi et al. Citation1999). Thus, this study was considered to have been conducted in an appropriate environment.
The optimal soil pH for strawberry cultivation is 5.0–6.0 (Casteel Citation2004). The pH of the nutrient solution in this study decreased below 3.5 during cultivation. Therefore, we investigated whether this decrease in pH adversely affected plant growth and fruit yield (). We compared plant sizes of the two cultivars analyzed with those of other strawberry cultivars grown in the same greenhouse under standard cultivation conditions and found that all plants grew to a similar size. Thus, we concluded that no physiological problems occurred. The fruit yield of the two cultivars was not inferior to that of other cultivars (Kawata et al. Citation2016; Takeuchi et al. Citation1999; Takeuchi Citation2016). Therefore, the temporary drop in pH that occurred during the cultivation period was presumed to have no adverse effect on growth. When the soil pH is below 4.0, there is an increased risk of deficiency of N, P, K, Ca, Mg, B, and Zn and excess of Fe, Mn, and Al (Foth Citation1990). However, these changes did not occur in our cultivation. This may be owing to the regular replacement of the nutrient solution with fresh solution with an appropriate pH. Furthermore, it is conceivable that the nutrient availability did not decrease in the solution, even when the pH decreased, unlike in soil. The EC is thought to decrease as ions in the nutrient solution are absorbed. Accordingly, Benihoppe is thought to have absorbed many of the ions from the nutrient solution, particularly from flowering to fruiting.
4.2. Nutrient absorption during cultivation
Benihoppe absorbed more ammonium than did Kirapika (). In the soil, ammonium is converted to nitrate by nitrifying bacteria (Foth Citation1990). However, in this study, the roots were washed before cultivation, suggesting that ammonium was absorbed as is, without undergoing nitrification. The nitrate:ammonium ratio in the nutrient solution affects the growth of strawberries (Tabatabaei, Yusefi, and Hajiloo Citation2008). In this study, we found a difference in ammonium uptake between Benihoppe and Kirapika, but not that of nitrate. This indicates that the nitrate:ammonium absorption ratio varies depending on the cultivar and therefore, the optimal nitrate:ammonium ratio may differ depending on the cultivar.
As for the other nutrients, Benihoppe absorbed significantly more P and Mn than did Kirapika. It has been reported that the application of a higher amount of P to strawberry plants increases the soluble solid content in the fruit (Cao et al. Citation2015). Given that Benihoppe absorbed more P than Kirapika, we assumed that these plants are highly capable of synthesizing sugars and similar substances. Mn is mainly present in chlorophyll, and Mn deficiency causes chlorosis of the leaves (Foth Citation1990). While there were no differences in leaf and stem weights between the cultivars, the leaves and stems of Benihoppe had higher Mn concentrations than those of Kirapika ( and ); higher Mn uptake in Benihoppe may account for the higher Mn concentrations in its leaves and stems.
4.3. Nutrient distribution in plant organs
There were significant differences in the distribution of specific nutrients in each plant organ (). A comparison of the concentrations of elements among different plant parts, excluding the fruit, revealed 10-fold differences in Fe, Zn, Cu, and Mo. The crown contained high concentrations of Zn and Cu. All the above nutrients are difficult to be transported from older tissues (Foth Citation1990), which is thought to be the reason they accumulated in the crown. Mo is contained in nitrate reductase (Kalimuthu et al. Citation2016). Therefore, nitrate reductase is expected to be abundantly present in the roots. Fe is also considered difficult to be transported within a plant. However, unlike Zn and Cu, Fe accumulated in the roots rather than in the crown. Further investigation is needed to explain these differences. Nutrient distribution in the various organs did not seem to be much different between the two cultivars; however, Benihoppe accumulated various nutrients at higher concentrations than did Kirapika.
All nutrients, except Fe, Zn, and Mo, accumulated at high concentrations in the leaves and stem (), whereas Fe, Zn, and Mo accumulated in the roots. Thus, we reason that most nutrients absorbed during the 3-month cultivation period were used for plant body growth.
Benihoppe plants showed a significantly greater increase in C than Kirapika plants (). C is fixed through photosynthesis, which suggests that Benihoppe has a higher photosynthetic capacity than Kirapika. Further, Benihoppe absorbed higher quantities of ammonium and P from the nutrient solution, and accordingly, showed a significantly higher adsorption of N and P in the plant. Moreover, although there was no significant difference in the extent of reduction in K and Mg from the nutrient solution for both cultivars, the extent of increase in the plant was significantly higher in Benihoppe. We were unable to analyze Zn and Cu in the nutrient solution. However, these two micronutrients were significantly higher in Benihoppe than in Kirapika plants.
4.4. Nutrient absorption by the plants
For each nutrient, we measured the decrease in the nutrient solution and the increase in the plant during cultivation (). Somewhat surprisingly, for each nutrient, the total decrease in the nutrient solution was larger than the corresponding increase in the plant. This may be explained by volatilization during incineration of the plant material (Nonaka et al. Citation1981).
This study was completed at the end of harvest of the first fruit cluster. Thus, the plants were cultivated for approximately 13 weeks. The fruit yield of Benihoppe, with a uninterrupted traditional cultivation period of 25 weeks, exceeds 600 g per plant, and harvesting can continue thereafter (Takeuchi Citation2016). During this period, new leaves are formed and the old leaves wither, while the crown and roots increase in size, albeit slightly. However, the proportion of harvested fruit is much larger. Therefore, when plants are cultivated for a long period using the traditional method, the balance of nutrients accumulated in each plant organ may differ from that observed in our study.
In Japan, in strawberry cultivation in soil, it is common to provide approximately 2–3 g of N per plant in the form of fertilizer (Ueki Citation2016). In this study, Benihoppe absorbed 2382 mg N and Kirapika absorbed 2273 mg N (, ). Considering that in practice, cultivation may continue for longer than our study period, it is considered preferable to continue N fertilization during cultivation. However, as ammonium and nitrate are absorbed at a constant rate during cultivation, it is desirable to increase additional fertilization or regularly apply liquid fertilizer rather than increasing the base fertilizer. In addition, in Japanese strawberry cultivation, a base fertilizer containing N, phosphorus pentoxide, and potassium oxide in nearly equal proportions is used. When displaying P and K on fertilizer packings, the Japanese Fertilizer Regulation Act stipulates that their amounts should be converted to P2O5 and K2O, respectively. However, from the results in , the amount of phosphorus pentoxide in the fertilizer was apparently higher than that absorbed by the plants. If the amount of a specific fertilizer component is higher than the amount absorbed, it accumulates in the soil. As excess phosphorus pentoxide in the soil may cause replant failure, it is better to reduce its dose.
5. Conclusions
In this study, we evaluated the amounts of several nutrients required at each stage of strawberry cultivation. The results are useful for determining an appropriate amount and timing for fertilization for each nutrient. We also clarified where each nutrient was utilized in the plant. The required amount and movement of fertilizer components differ per nutrient. Thus, further research should focus on individual components. However, given that we detected differences in the uptake of some nutrients, even between Benihoppe and Kirapika, which are genetically related cultivars, it is presumed that the fertilizer absorption characteristics of strawberries may differ considerably depending on the cultivar. Strawberry cultivars and cultivation methods differ among countries. Therefore, further research is needed using other cultivars and cultivation conditions. However, it is anticipated that the results obtained in this study can serve as reference data. Finally, our results help facilitate the development of optimal strawberry fertilization, by clarifying the nutrient requirements of the plants.
Acknowledgments
We would like to express our sincere gratitude to Masahiro Saito of Shizuoka Prefectural Research Institute of Agriculture and Forestry for considerable help in this research.
Disclosure statement
The authors declare no conflict of interest or relationship, financial or otherwise.
Additional information
Funding
References
- Cao, F., C. Guan, H. Dai, X. Li, and Z. Zhang. 2015. “Soluble Solids Content Is Positively Correlated with Phosphorus Content in Ripening Strawberry Fruits.” Scientia Horticulturae 195: 183–187. doi:10.1016/j.scienta.2015.09.018.
- Carusoa, G., G. Villari, G. Melchionna, and S. Conti. 2011. “Effects of Cultural Cycles and Nutrient Solutions on Plant Growth, Yield and Fruit Quality of Alpine Strawberry (Fragaria Vesca L.) Grown in Hydroponics.” Scientia Horticulturae 129 (3): 479–485. doi:10.1016/j.scienta.2011.04.020.
- Casteel, S. 2004. Strawberry Fertility and Nutrient Management. North Carolina: NCDA&CS Agronomic Division.
- Foth, H. 1990. Fundamentals of Soil Science 8th Edition. New Jersey.: Wiley & Sons, Incorporated, John.
- Kalimuthu, P., P. Ringel, Y. Kruse, and P. Bernhardt. 2016. “Direct Electrochemistry of Nitrate Reductase from the Fungus Neurospora Crassa.” Biochimica et Biophysica Acta (BBA) - Bioenergetics 1857 (9): 1506–1513. doi:10.1016/j.bbabio.2016.04.001.
- Kawata, T., T. Takeuchi, T. Ikari, M. Mochizuki, T. Oishi, C. Saiki, A. Ikegaya, and Y. Goto. 2016. “Fruit Characteristics of the New Strawberry Cultivar ‘Kirapika’.” Bulletin of Shizuoka Research Institute of Agricultural Forest. 9: 1–10. in Japanese.
- Martínez, F., S. Castillo, C. Borrero, S. Pérez, P. Palencia, and M. Avilés. 2013. “Effect of Different Soilless Growing Systems on the Biological Properties of Growth Media in Strawberry.” Scientia Horticulturae 150: 59–64. doi:10.1016/j.scienta.2012.10.016.
- Massetani, F., G. Savini, and D. Neri. 2014. “Effect of Rooting Time, Pot Size and Fertigation technique on Strawberry Plant Architecture.” Journal of Berry Research 4 (4): 217–224. doi:10.3233/JBR-140083.
- Narváez-Ortiz, W. A., J. H. Lieth, S. R. Grattan, A. Benavides-Mendoza, R. Y. Evans, P. Preciado-Rangel, J. R. Valenzuela-García, and J. A. Gonzalez-Fuentes. 2018. “Profitability of Strawberry (Fragaria Ananassa) Production with Biofilmed Biofertilizer Application.” Scientia Horticulturae 241: 124–130. doi:10.1016/j.scienta.2018.06.098.
- Nonaka, N., H. Hideo Higuchi, H. Hamaguchi, and K. Tomura. 1981. “Losses of the Elements during Dry Ashing of Plant Materials.” Bunseki Kagaku 30 (9): 599–604. in Japanese. doi: 10.2116/bunsekikagaku.30.9_599.
- Oda, Y. 2016. “Origin and History of Strawberries for Cultivation.” Strawberry Dictionary, 11–36. Tokyo: Rural Culture Association Japan. (in Japanese).
- Palencia, P., J. G. Bordonaba, F. Martínez, and L. A. Terry. 2008. “Investigating the Effect of Different Soilless Substrates on Strawberry Productivity and Fruit Composition.” Scientia Horticulturae 203: 12–19. doi:10.1016/j.scienta.2016.03.005.
- Singhalage, I. D., D. Seneviratne, H. M. S. P. Madawala, and P. C. Wijepala. 2019. “Profitability of Strawberry (Fragaria Ananassa) Production with Biofilmed Biofertilizer Application.” Scientia Horticulturae 243: 411–413. doi:10.1016/j.scienta.2018.08.033.
- Tabatabaei, S. J., M. Yusefi, and J. Hajiloo. 2008. “Effects of Shading and NO3: NH4ratio on the Yield, Quality and N Metabolism in Strawberry.” Scientia Horticulturae 116 (3): 264–272. doi:10.1016/j.scienta.2007.12.008.
- Takeuchi, T. 2016. “Characteristics of Major Varieties and Cultivation Methods Benihoppe.” Strawberry Dictionary, 367–371. Tokyo: Rural Culture Association Japan. (in Japanese).
- Takeuchi, T., H. Fujinami, T. Kawata, and M. Matsumura. 1999. “Pedigree and Characteristics of a New Strawberry Cultivar ‘Benihoppe’.” Bulletin Shizuoka of Agriculture Experimental Station. 44: 13–24. in Japanese.
- Ueki, M. 2016. “Standard Technology of Strawberry Cultivation.” Strawberry Dictionary, 155–168. Tokyo: Rural Culture Association Japan. (in Japanese).
- Wang, B., T. Lai, Q. Huang, X. Yang, and Q. Shen. 2009. “Effect of N Fertilizers on Root Growth and Endogenous Hormones in Strawberry.” Pedosphere 19 (1): 86–95. doi:10.1016/S1002-0160(08)60087-9.
- Wang, D., M. Z. Gabriela, D. Legard, and T. Sjulin. 2016. “Characteristics Of Growing Media Mixes And Application For Open-field Production Of Strawberry (Fragaria ananassa).” Scientia Horticulturae 198: 294–303. doi:10.1016/j.scienta.2015.11.023.
- Zuo, Y., J. Zhang, R. Zhao, H. Dai, and Z. Zhang. 2018. “Application of Vermicompost Improves Strawberry Growth and Quality through Increased Photosynthesis Rate, Free Radical Scavenging and Soil Enzymatic Activity.” Scientia Horticulturae 233: 132–140. doi:10.1016/j.scienta.2018.01.023.