
ABSTRACT
Understanding of the long-term soil fertility trends is the basis for rational and sustainable management of the soil resources in agricultural fields. In tropical Asia, the Green Revolution initiated in the late 1960s contributed to a drastic increase in both food production and human population. Among the tropical Asian countries, Thailand is known as a rice-exporting country, but the country’s rice yield is still relatively low. Therefore, this research aimed to investigate the effect of the Green Revolution on the changes in paddy soil fertility status in Thailand over the last 50 years. In total, 65 surface soil samples were collected in 2015 and 2016 from paddy fields in the northeast, north, central plain, and Bangkok Plain of Thailand. To compare the fertility-related data of the samples with those of soils collected from 1964 to 1972, the sampling sites in the 2010s were placed at or near the same locations of the original sites. Over the last 50 years, the mean pH, total C, total N, available N, available P, and exchangeable K values increased significantly (p < 0.01). In particular, the available P content dramatically increased from 3.19 to 42.8 mg kg–1, reflecting the rapid increase in fertilizer application. Contrarily, the mean exchangeable Mg and clay content values decreased significantly (p < 0.05). Regionally, the total C and total N contents of the soils in the northeast were significantly lower than those in the other regions (p < 0.05), and the available P, exchangeable K, and available Si contents were often evaluated as deficient, reflecting the very sandy texture of the soils. In conclusion, the fertility status of the paddy soil in Thailand has improved considerably over the last 50 years, and the increase in total C suggests the potential of paddy soil for C sequestration, even in the tropics. These trends should be considered to achieve more sustainable food production and environmental conservation in Thailand.
1. Introduction
The ‘Green Revolution’ is known as a set of agricultural research technology transfer initiatives beginning in the 1950s and advancing most markedly from the late 1960s. These initiatives have led to the adoption of new technologies, i.e., 1) high-yielding crop varieties, e.g., IR8 for rice; 2) a higher amount of agrochemicals, e.g., chemical fertilizers and pesticides; 3) irrigation; and 4) mechanization (WHO Citation1990; Evenson and Gollin Citation2003; Pingali Citation2012). Because of this revolution, the global cereal production has exhibited a 3.3-fold increase over the last 50 years, from 880 million tons in 1961 to 2.91 billion tons in 2016 (FAOSTAT Citation2018), supporting a 2.5-fold increase in the world population, from 3.1 billion people in 1961 to 7.6 billion people in 2019 (United Nations, Citation2019).
Rice (Oryza sativa L.) is a daily staple food for over half of the world population and is among the most important industrial food crops after wheat. Its global production has exhibited a similar trend, i.e., a 3.6-fold increase from 216 million tons in 1961 to 770 million tons in 2017 (FAOSTAT Citation2018). Contrary to this rapid production increase, however, the area of paddy fields, i.e. lowland rice fields, has shown only a 45% increase from 1.15 × 10⁶ km2 to 1.67 × 10⁶ km2 (FAOSTAT Citation2018), even though such fields are the dominant agricultural system of rice production. These statistical data clearly indicate that the increase in rice production is primarily dependent on a more intensive use or exploitation of paddy soils; accordingly, the Green Revolution must have influenced their properties considerably over the last 50 years. However, there is only limited information available on the long-term impact of the revolution on the fertility status of paddy soils.
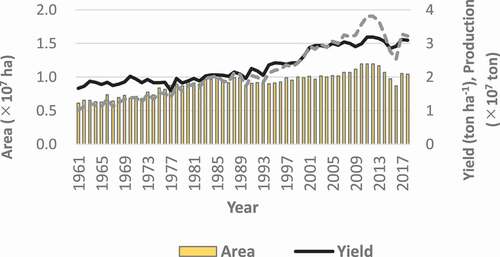
Approximately 90% of the world’s rice fields are located in Asia: 92% in 1961 and 90% in 2018 (FAOSTAT Citation2018). Thailand is a well-known rice-producing country that exports about 1.03 × 10⁷ tons of rice per year (Citation2018) and is the second largest global exporter after India. Traditionally, rice cultivation in Thailand is primarily performed as rainfed paddy rice production during the rainy season. This country entered the Green Revolution in the 1970s, after which its total rice yield increased by 316%, from 1.02 × 10⁷ tons in 1961 to 3.22 × 10⁷ tons in 2018, with a 1.9-fold increase in rice yield per area from 1.66 tons ha–1 in 1961 to 3.09 tons ha–1 in 2018 (FAOSTAT Citation2018) (). Moreover, it should be noted that in 2018, the rice yield per area in Thailand, i.e., 3.09 tons ha–1, was only 66% of the global average yield of 4.68 tons ha–1, i.e., a relatively low yield in spite of the country’s long history of paddy rice production. Kawaguchi and Kyuma (Citation1977) investigated 459 paddy fields in 10 tropical Asian countries (including 80 samples in Thailand) to evaluate their soil fertility status from the 1960s to the 1970s and found out that the paddy soils in Thailand had the lowest fertility levels in the 1960s. In addition, they also revealed that the level of soil organic matter in Thailand was the lowest among the countries in the 1960s. Judging from the growing concern about the importance of soil carbon sequestration to alleviate global warming, long-term changes in the level of soil organic matter in Thailand should be scrutinized. Based on this background, the objective of this research was to elucidate how the Green Revolution has impacted the fertility status of the paddy soil in Thailand over the last 50 years, as a case study of soils with a relatively low original fertility status in tropical Asia.
Figure 1. Temporal changes in the paddy rice production in Thailand from1961 to 2018 (FAOSTAT Citation2018)
2. Materials and methods
2.1. Natural setting of Thailand
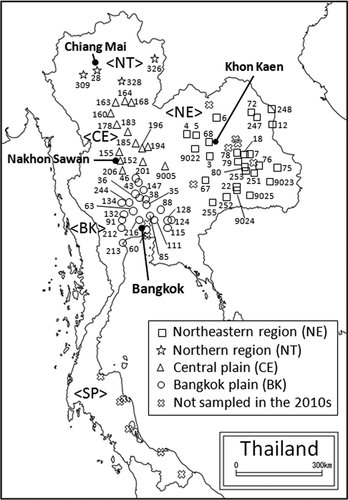
Thailand extends from 5° to 21° north and from 97° to 106° east, covering approximately 5.14 × 10⁵ km2 (). The climate in Thailand is characterized by a hot, wet season, from May to October, and a cool, dry season, from November to April. It is basically classified as a tropical savanna climate (Aw), except for small areas in the southern part of the peninsula (tropical monsoon climate: Am), according to the Köppen–Geiger climate classification (Peel, Finlayson, and McMahon Citation2007). The mean annual temperature and annual rainfall in Bangkok, Khon Kaen, Chiang Mai, and Nakhon Sawan are 28.1°C and 1,430 mm, 26.9°C and 1,162 mm, 25.6°C and 1,184 mm, and 28.2°C and 1,143 mm, respectively (1982–2012, climate-data.org). Geographically, Thailand can be divided into five distinct regions: the northeast (NE) or Khorat Plateau, the intermontane basins of the north (NT), the upper central plain (CE), the Bangkok Plain (BK), and the southern peninsula (SP) (Kawaguchi and Kyuma Citation1969, Citation1977) (). The NE, or Khorat Plateau, is a saucer-shaped plateau bordered by mountain ranges on the west and south and by the Mekong River on the east and north with the surface forms of alluvial sediments via the Mekong and its two main tributaries, i.e., the Mun and Chi Rivers. The intermontane basins of the NT are part of the Mekong watershed and the Ping, Wang, Yom, and Nan Rivers, which flow to join the Chao Phraya, with the largest alluvial plain of the Chiang Mai Basin. The CE is composed of recent alluvial plains, semi-recent terraces, and low and high terraces, primarily along the Ping, Nan, and Chao Phraya Rivers. The BK has a very flat topography characterized by recent alluvial plains and semi-recent terraces via the Chao Phraya, Mae Klong, and Pa Sak Rivers, with riverine deposits in the northern part and marine deposits in the southern part. The SP has a distinct landscape, with small plains from relatively short rivers. Geologically, the NE is composed almost exclusively of weathered Mesozoic (Cretaceous) sedimentary rocks which are known as the Maha Sarakham Formation, characterized by reddish sandstone, siltstone, shale, and conglomerate (Ministry of Natural Resources and Environment, Thailand, Citation1999, Fig. S1). The NT and SP are mainly covered with Quaternary sediments and Precambrian, Paleozoic, and Mesozoic igneous rock. The majority of the CE and BK surface formations are composed of Quaternary alluvial sediments. Older terrace formations occupy the primary part of the CE, whereas recent and semi-recent alluvial deposits predominate in the BK (Ministry of Natural Resources and Environment, Thailand, Citation1999; Kawaguchi and Kyuma Citation1977; Sinsakul Citation2000; Prakongkep et al. Citation2008). Regarding soil resources, the soils in Thailand are dominated by Ultisols (42.1%) and Entisols (33.8%, including slope complexes), followed by Inceptisols (9.4%), Alfisols (9.2%), and Mollisols (1.2%) (Limtong Citation2012) according to Soil Taxonomy (Soil Survey Staff Citation2003) (Land Development Department, Ministry of Agriculture and Cooperatives, Thailand Citation1994, Fig. S2). The dominance of Ultisols indicates relatively strong soil weathering, which reflects the country’s tropical climate. Regionally, the soil in the NE is typically dominated by Ultisols (Ustults and Aquults) (Land Development Department, Ministry of Agriculture and Cooperatives, Thailand; Citation1994), whereas the soil in the SP is dominated by Entisols and Ultisols (Udults). The soil in the NT, CE, and BK is dominated by Entisols and Ultisols (Ustults), Ultisols (Ustuls) and Entisols (Aquents and Fluvents), and Inceptisols (Aquepts) and Entisols (Aquents), respectively, which reflect the influence of the many river systems present.
Figure 2. Distribution of the sampling sites in Thailand in the 1960s and 2010s
2.2. Paddy rice production in Thailand
Thailand has a long tradition of rice production. Archaeobotanical studies in Thailand indicate that rice has always been the ubiquitous cereal, even prehistorically, particularly during the Metal/Iron Age (Castillo Citation2011). Basically, rainfed single cropping has been used because the country’s precipitation is lower than that required for paddy rice production in the tropics, i.e., 1,600–1,800 mm (Watabe Citation1964). In the early 1960s, rice production based on irrigation was found only in the NT region. Transplanting was the dominant style of planting, though broadcasting was also adopted, and the application of fertilizer was limited (Watabe Citation1964). After the start of the Green Revolution, however, a new high-yielding rice variety, RD1 – a descendant of IR8, was widely introduced as a short-stalked, fertilizer-sensitive, and fast-growing variety (Rerkasem Citation2015). A series of irrigation schemes were also implemented, e.g., the Greater Chao Phraya Irrigation Project, primarily in the BK and CE (Takaya Citation1980), which led to the rapid expansion of double-cropping systems. The cumulative irrigated area amounted to over 3 × 10⁶ ha in 2011 (Rerkasem Citation2015), with irrigated field ratios of 10.6%, 31.2%, 57.8%, and 18.1% in the NE, NT, CE and BK, and SP, respectively, for an average ratio of 25.4% in 2007 (Center for Agricultural Statistics, Thailand, Citation2008). These data agree with the information obtained through our interviews with local farmers in the 2010s that rice cropping takes place two or three times a year in the NT, CE, and BK, but only once a year during the rainy season in the NE.
In addition, agricultural machinery has taken the place of animals, such as water buffalo, and the application of fertilizer has also drastically increased. For example, the amount of N, P (P2O5), and K (K2O) fertilizers applied increased from 1.11 × 10⁴, 4.72 × 10³, and 2.11 × 10³ tons, respectively, in 1961 to 1.48 × 10⁶, 3.22 × 10⁵, and 5.69 × 10⁵ tons, respectively, in 2017, with a respective increase rate of 134, 68 and 270 times (FAOSTAT Citation2018). These changes have been observed primarily in the NT, CE, and BK, whereas the introduction has been rather slow in the NE. Based on these differences among the regions, it is generally recognized that rice yield is relatively high in the BK and CE and considerably low in the NE, as confirmed by the interview to the farmers in the 2010s. Today, rain-fed rice cultivation is performed mainly from May/July to November/December, whereas off-season rice cultivation is conducted primarily from December/January to May/June, although the specific farming practices and rice cultivars vary depending on tradition and geographic conditions. Because of the limited and unstable precipitation, paddy rice sometimes suffers from drought and flooding even now, and it is regarded as one of the reasons why Thailand has relatively low rice yield.
2.3. Soil sampling
The first soil sampling in Thailand was performed mainly in 1960s, i.e.from 1964 to 1972 by Kawaguchi, Kyuma, and their colleagues. They investigated 80 soil profiles all over the country to cover the main paddy rice production areas of all five geographical regions () and analyzed the samples’ general physicochemical properties (Kawaguchi and Kyuma Citation1977). Their data on the surface soils (lower boundary = 15.2 ± 4.5 cm in depth) were used as a reference or ‘an anchor to the past’ for the evaluation of long-term changes up to the present. The second soil sampling was performed in August 2015, September 2015, February 2016, and March 2016 in the NT, CE, BK, and NE, respectively. As we were able to identify the original sampling locations based on both the descriptions provided by Kawaguchi and Kyuma (Citation1977) and Kyuma’s personal notes describing interviews with local farmers and officers, we placed our sampling sites at or near the same locations as the original sites. Overall, 65 soil samples were collected in the 2010s from the surface layer (0–15 cm) of various paddy fields, i.e., 26 samples from the NE, 4 samples from the NT, 14 samples from the CE, and 21 samples from the BK (, Table S1). We could not collect 9 soil samples out of the original 80 due to conversion from paddy fields to other land uses reflecting urbanization and another 6 samples due to inaccessibility to the locations in the south caused by political instability.
2.4. Analytical methods
In this research, for the chemical analysis, the soil samples were air-dried and sieved to <2 mm before analysis. The fertility-related physicochemical properties of the samples were investigated via the same analytical methods used by Kawaguchi and Kyuma (Citation1977) in the 1960s, aside from the total C and N. Briefly, the soil pH was measured using the glass electrode method with a soil/water ratio of 1:2.5 (pH/Ion Meter F-23, HORIBA, Japan). The total carbon and total nitrogen were determined via the dry combustion method using an NC analyzer (Sumigraph NC-95A, Sumika Chemical Analysis Center, Japan) and a gas chromatograph (GC8A, Shimadzu, Japan) for finely ground soil samples oven-dried at 110°C for approximately 24 h (Nelson and Sommers Citation1996; Bremner, Citation1996). The available nitrogen was determined via extraction of the incubated soil at 40°C for 2 weeks with 2 mol L–1 KCl solution, followed by an evaluation of the NH4+ concentration via the Kjeldahl method. The total phosphorus was determined by energy-dispersive X-ray fluorescence spectrometry (EDXRF) (XEPOS C, SPECTRO Analytical Instruments, Germany) using pressed powder pellet samples (Whittig and Allardice Citation1986). The available phosphorus (Bray No. 2 method) was extracted using NH4F and HCl mixed solutions, and the phosphorus content of the extract was determined by colorimetry with an absorption spectrophotometer (UVmini 1240, Shimadzu, Japan) (Bray and Kurtz Citation1945). The phosphorous of 0.2 mol L–1 hydrochloric acid extraction was determined by colorimetry with an absorption spectrophotometer (UVmini 1240, Shimadzu, Japan). The exchangeable Ca, Mg, K, and Na were extracted using 1 mol L−1 neutral ammonium acetate and determined using an atomic absorption spectrophotometer (AA6200, Shimadzu, Japan). The cation exchange capacity (CEC) was determined via extraction using 10% NaCl solutions after exchangeable bases extraction, followed by a determination of the NH4+ concentration using the indophenol method (Bremner Citation1996). The available silicon was determined by extraction using 1 mol L–1 acetate buffer (pH 4.0) and colorimetry using an absorption spectrophotometer (UVmini 1240, Shimadzu, Japan). The particle-size distribution was determined via sieving and sedimentation methods (Klute Citation1986). The types of clay minerals in the ≤2-µm soil particles were identified by X-ray diffraction (XRD) analysis (MiniFlex 600, Rigaku, JAPAN), and the XRD patterns were obtained from samples oriented on glass slides. The samples were pretreated with Mg saturation at room temperature (Mg-25°C), followed by glycerol (Mg-gly), or with K saturation at room temperature (K-25°C), followed by heating at 350°C (K-350°C) and 550°C (K-550°C). The slides were step-scanned from 3 to 15–30 °2θ, with steps of 0.02 °2θ. The relative peak area ratios of 7, 10, and 14 Å of the XRD analysis charts were then calculated to evaluate the clay minerals.
2.5. Data comparison and statistical analyses
The analytical data of Kawaguchi and Kyuma (Citation1977) were used for the soil samples from the 1960s. Since the total carbon and total nitrogen contents of the soil samples in the 1960s were determined using the Tyurin and Kjeldahl methods, they were multiplied by 1.2 and 1.1, respectively, to adjust to the data of the soil samples from the 2010s, which were determined via the dry combustion method based on a preliminary experiment (data not shown). These values were reasonably close to the reported average values of 1.25 for C (Nelson and Sommers Citation1996) and 1.10 for N (Bremner Citation1996).
The mean values of the soil properties for the 65 samples evaluated in both the 1960s and the 2010s were compared using paired-sample t-tests for the overall data and the data of each region. The mean values of the regions were compared using the analysis of variance and Tukey’s test. Here, the original data were used for pH, exchangeable Ca and Mg, CEC, available Si, silt, and clay content as the equality of the variances was confirmed, whereas the log-transformed data were used for the others as the equality of the variances was not confirmed. The SYSTAT 13 software was used for these statistical analyses (SYSTAT, Chicago, IL).
3. Results and discussion
3.1. Current fertility status of the paddy soil in Thailand
presents the mean, median, minimum, maximum, and coefficient of variation of the fertility-related properties of the paddy soil in Thailand in the 2010s. The individual data for the 2010s are listed in Table S2. The overall mean of the soil pH was 5.77, which suggested a slightly acidic nature of the soil. The total C and total N contents had overall means of 17.3 and 1.46 g kg–1, respectively, with an average C/N ratio of 12.2. The available N content was, on average, 107 mg kg–1 and corresponded to about 7.3% of the total N content. The total P content ranged from 0.10 to 2.36 g kg–1, with an overall mean of 0.35 g kg–1. The available P and 0.2 mol L–1 HCl extractable P contents had overall means of 42.8 and 48.7 mg kg–1, respectively. On average, about 12.2% of the total P was evaluated as available. The exchangeable Ca, Mg, K, and Na contents were, on average, 8.77, 3.11, 0.31, and 0.88 cmolc kg–1, respectively. The CEC ranged from 1.77 to 31.7 cmolc kg–1, with an overall mean of 13.8 cmolc kg–1. The average available Si content was 70.5 mg kg–1. The overall means of the sand, silt, and clay contents were 42.8, 25.2, and 32.0%, respectively, with ranges of 2.2–91.4%, 2.6–79.9%, and 2.9–73.9%, respectively. In summary, these data suggest that the paddy soil in Thailand is slightly acidic and relatively poor in plant nutrients. It should also be noted that the coefficient of variation for the soil properties, except for the pH and C/N ratio, was over 60%, which suggested a high variability in the fertility status, organic matter content, and textural class among the soil samples.
Table 1. Mean, median, minimum, maximum, and coefficient of variation of the fertility-related properties of paddy soils in Thailand in the 2010s (n = 65)
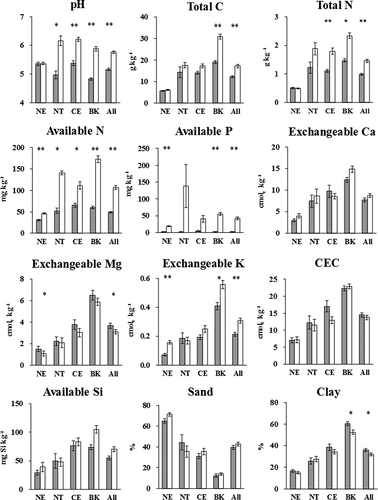
presents the regional differences in the fertility-related properties of the paddy soil in Thailand in the 2010s. The soil pH values in the NE were significantly lower than those in the CE and BK (p < 0.05) due to the relatively low buffering capacity of the soil in the NE, reflecting its sandy texture. The relatively low pH in the BK suggested the existence of acid sulfate soil in parts of the coastal lowlands, i.e., about 6 × 10⁵ ha (Limtong Citation2012), as shown via the lowest pH value of 4.54. The total C, total N, and available N contents of the soil in the NE were significantly lower than those in the other regions (p < 0.05), suggesting a very low level of organic matter in the NE. In terms of the soil P status, the available P content in the NT was significantly higher than that of the other regions, and the HCl-extractable P content in the NE was significantly lower than that of the other regions (p < 0.05). The relatively low soil P level in the NE was confirmed, but it was not always statistically significant. The exchangeable Ca and Mg contents of the soil in the BK were significantly higher than those in the CE and NE, and the exchangeable K content of the soil in the BK was significantly higher than that in the other regions (p < 0.05), reflecting the intensive application of fertilizer in that area. The significantly higher exchangeable Na content of the soil in the BK may have been influenced by marine and brackish sediments in wide areas of the plain, especially in the coastal region (Hattori Citation1972). Moreover, the available Si content of the soil in the BK was significantly higher than that in the NE (p < 0.05). Regarding particle-size distribution, the sand content in the NE was significantly higher and the silt content significantly lower than in other regions (p < 0.05), and the clay content in the BK was significantly higher than that in the other regions (p < 0.05). This may have been caused by the sandy texture in the NE, reflecting the nature of highly weathered Mesozoic (Cretaceous) sedimentary rocks (Ministry of Natural Resources and Environment, Thailand, Citation1999; Prakongkep et al. Citation2008) and the relatively clayey texture in the BK due to selective sedimentation of finer particles, resulting in a small slope gradient from 1/7,000 in the area north of Ayutthaya to about 1/25,000 in the area around Bangkok (Kawaguchi and Kyuma Citation1969). The significantly higher CEC of the soil in the BK than in the other regions could be explained as a reflection of both the higher clay content and higher total C (organic matter) content of the region’s soil. The XRD analysis of the samples indicated that the clay mineralogy of the soil in Thailand is dominated by kaolinite, as previously reported by Kawaguchi and Kyuma (Citation1969). In detail, here, the clay mineralogy of the soils in the NE was mostly dominated by kaolinite, followed by quartz and illite, reflecting the characteristic geological setting and strong weathering of the soil. Meanwhile, the soils in the NT, CE, and BK were generally similar in their clay mineralogy, as they belong to the same drainage basin of the Chao Phraya River. The soils were dominated by kaolinite and then by illite, quartz, and vermiculite in the NT and CE and by kaolinite and then smectite, illite, quartz, and vermiculite in the BK.
Table 2. Regional differences of the means of the fertility-related properties of paddy soils in Thailand in the 2010s
3.2. Changes in the fertility status of the paddy soil in Thailand from the 1960s to the 2010s
presents the changes in the mean values of the soil properties from the 1960s to the 2010s, and the original data from the 1960s and 2010s are presented in Table S2. On a national basis, the mean values of the pH, total C, total N, available N, available P, HCl-extractable P, and exchangeable K increased significantly (p < 0.01) over the last 50 years. In particular, the available P content increased by 13.4-fold, i.e., from 3.19 to 42.8 mg kg–1. These changes were likely caused by the increased application of chemical fertilizers (FAOSTAT Citation2018), as demonstrated by the drastic increase in available P without an increase in the total P, as well as the increased organic matter input as harvest residue derived from the improved rice biomass production (Yadvinder-Singha, Citation2004). The total N, available N, and exchangeable K exhibited a 1.5-, 2.2-, and 1.5-fold increase, respectively, indicating the increase of the availability of these macronutrients. The total C exhibited a 1.4–fold increase (from 12.4 g kg−1 to 17.3 g kg−1), suggesting considerable accumulation of soil organic matter during this period. Contrarily, the mean values of the exchangeable Mg and clay contents decreased significantly (p < 0.05) over the same period. This significant decrease in the exchangeable Mg (15%) could have been due to the competition of cation exchange sites with Ca, which was applied much more than Mg as an ingredient of P fertilizers (e.g., calcium superphosphate) and pH amendments (e.g., calcite and dolomite). Meanwhile, the significant decrease in the clay content (11%) may have been caused by the increased frequency of puddling, reflecting increased rice-cropping times based on the introduction of irrigation systems. A slight increase in sand and silt contents was also observed in accordance with the significant decrease in clay content.
Table 3. Changes in the mean values of the fertility-related properties of paddy soils in Thailand from the 1960s to the 2010s (n = 65)
presents the changes in the selected fertility-related properties of the soil from the 1960s to the 2010s in the NE, NT, CE, BK, and all regions. The mean pH values in the 2010s were significantly higher than those in the 1960s in all regions, except for the NE, probably due to the long flooding period caused by the increase in rice-cropping times. The fact that the soil pH in NE with one cropping in rainy season has not changed over 50 years supported this hypothesis. It should be also noted that such pH increase generally increases the availability of phosphorus and some micronutrients such as boron and molybdenum. The total C content in the BK and total N content in the CE and BK in the 2010s were significantly higher than those in the 1960s (p < 0.05, p < 0.01), which suggested that a higher yield and greater biomass production could induce an increase in organic matter content in soil, even under a tropical environment. The available N content in the 2010s was significantly higher than that in the 1960s in all regions (p < 0.05, p < 0.01), likely due to the application of a high amount of chemical fertilizers (FAOSTAT Citation2018) and, partly, the increased input of organic matter. The available P in the NE and BK in the 2010s was significantly higher than in the 1960s (p < 0.01), probably due to the high input of chemical fertilizers. The extremely high available P content in the NT may have been due to the use of P fertilizer in the upland hills, wherein vegetable production with intensive application of fertilizer is common. Accordingly, the overall percentage of soil deficient in available P drastically reduced from 97% in the 1960s to 35% in the 2010s. This was determined based on the threshold (12–20 mg kg–1) identified by the IRRI (Citation2000), which has provided a guide to detecting nutrient deficiency and toxicity symptoms and managing nutrients in rice grown in tropical and subtropical regions. It should be also noted that 58%, 50%, 36%, and 5% of the soil samples from the 2010s were still deficient in available P in the NE, NT, CE, and BK, respectively, as indicated by the low median of 23.1 mg kg–1 (). Regarding exchangeable bases, the average exchangeable Ca content exhibited a slightly increasing, though statistically insignificant, trend. Based on the IRRI (Citation2000) threshold, i.e., 1.0 cmolc kg–1, Ca deficiency was observed only for the soil samples of the NE (15%) in the 2010s, in accordance with the decrease in the overall percentage from 25 to 6%. The exchangeable Mg in the 2010s was significantly lower than that in the 1960s in the NE alone (p < 0.05), although a decreasing trend was observed in all regions. Based on the IRRI (Citation2000) threshold, i.e., 1.0 cmolc kg–1, Mg deficiency was observed in 77, 50, 21, and 5% of the soil samples of the NE, NT, CE, and BK, respectively, in the 2010s. The exchangeable K of the NE and BK in the 2010s was significantly higher than that in the 1960s, probably due to a high input of chemical fertilizers. However, K deficiency was still observed in the 2010s for 58%, 75%, and 29% of the soil samples of the NE, NT, and CE, respectively, according to the threshold of 0.15 cmolc kg–1 (IRRI Citation2000). However, all the soil samples of the BK were above the threshold. The changes in the CEC values were not statistically significant in any region, although the level was lowest in the NE. The available Si content exhibited a slightly increasing trend in the BK, CE, and NE but was lowest in the NE, as observed in other properties. Accordingly, 77, 50, 21, and 14% of the soil samples of the NE, NT, CE, and BK, respectively, were deficient in available Si according to the IRRI (Citation2000) threshold, i.e., 40 mg kg–1. The sand content exhibited an increasing trend in all regions, except for the NT. Accordingly, a decreasing trend of the clay content was observed in all regions, except for the NT, with a significant decrease in the BK, probably due to increased puddling with a higher frequency of double cropping in this region. The reason for the unique trend in NT may be due to the inflow of finer particles to the paddy caused by the accelerated soil erosion in the mountainous upland areas.
Figure 3. Changes in the selected fertility-related properties of the soils from the 1960s (closed) to the 2010s (open) in the northeastern region (NE), northern region (NT), central plain (CE), Bangkok Plain (BK), and all regions. Paired t-test. *: p < 0.05; **: p < 0.01. Bars indicate standard errors
3.3. Implications for sustainable food production and environmental conservation in Thailand
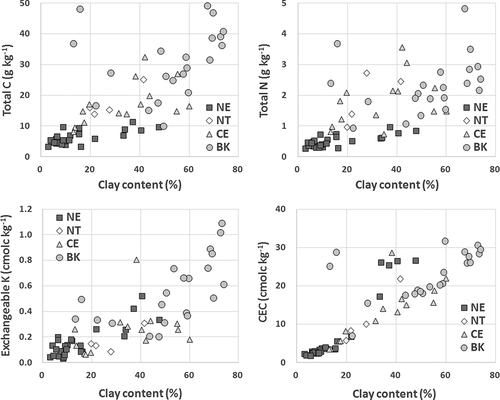
The results obtained in this research can be utilized to understand both previous and current soil and fertilizer management schemes in Thailand and to establish rational schemes to achieve sustainable food production and environmental conservation in the future. First, this research revealed that the fertility status of paddy soils in Thailand has considerably improved during the Green Revolution over the last 50 years due to the intensive management, as indicated by the drastically increased use of N, P, and K fertilizers (FAOSTAT Citation2018). Specifically, a marked increase of 10-fold in the available P content as well as a significant increase in the total C, total N, available N, and exchangeable K contents was observed (). This improvement of soil fertility status undoubtedly supported the considerable increase of yield and production of rice during this period (). Second, the available P, exchangeable K and Mg, and available Si were evaluated as still deficient and, therefore, are required to be maintained or increased for considerable parts of the soil, even after 50 years of the Green Revolution. Such deficiencies were especially observed in the NE, followed by the NT and CE (). These local trends in nutrient deficiencies may be one of the reasons why the rice yield in the NE is generally lower than those in other regions (Watabe Citation1964; interview with the local farmer in the 2010s). The relatively low nutrient levels of the soils in the NE could have been caused by their very low nutrient holding and supplying capacities, reflecting a very sandy texture (Mitsuchi Citation1990; Tulaphitak et al. Citation1996a, Citation1996b; Yanai et al. Citation2007, Citation2010). presents the relationship between the clay content and the total C, total N, exchangeable K contents and CEC. Here, clay content was used instead of sand content because clay content had a significant negative correlation with the sand content (p < 0.01). This suggests a strong relationship between clay and the levels of nutrients, organic matter, and nutrient-holding capacity (CEC) and their relatively low levels in the NE soils. It should also be noted that the relative ratio of the total C and total N retained by the soil to the clay content in the NE was lower than that in other regions, indicating difficulty in the accumulation of organic matter in that region’s soil. This would be due to low biomass production reflecting relatively low soil fertility and due to enhanced organic matter decomposition induced by shorter flooding period with only one cropping season. Judging from the fact that the rice yield in the NE is often related to the total C soil content (Homma et al. Citation2003), establishing rational soil management schemes to retain or improve the level of organic matter in that region’s soil would be an important issue. Third, the significant increase in the total C content over the last 50 years (, ) suggests the potential of paddy soil to sequestrate carbon, even under a tropical climate, although decomposition rate of soil organic matter is generally high under hot and humid conditions. This is especially true for the clayey soil in the BK, wherein a relatively high input of organic matter based on higher biomass production and relatively low organic matter degradation due to longer waterflooding have been achieved under the double-cropping system, although this can be regarded as intensive and exploitive, as in the upland fields. In this sense, enhanced sequestration of organic C in paddy soil could be a feasible option to 1) alleviate global warming associate with the increase in the atmospheric CO2 level (Lal et al. Citation2004; Lal Citation2015), as proposed in the international ‘4 per 1000’ initiative (Minasny et al. Citation2017), as well as to 2) increase the rice yield directly by increasing the total C level in soil (Homma et al. Citation2003) and indirectly by alleviating global warming, which has detrimental effects on rice yield (Kawasaki and Herath Citation2011). Fourth, the relatively small increase in soil N, P, and K () compared with the dramatic increase in fertilizer application over the last 50 years, i.e., 134-, 68-, and 270-fold for N, P, and K fertilizers, respectively (FAOSTAT Citation2018), indicates the release of a large amount of these nutrients from the soil to the environment, as suggested by the accelerated N eutrophication of surface water, especially in the BK (Hungspreugs et al. Citation1989). The fact that the available P level increased far more than the N and K levels could be an indication of the much less labile characteristic of soil P compared with soil N and K. Finally, based on the P, N, K, and C results presented above, it is reasonable to conclude that a highly-efficient method of nutrient application in response to the demand by rice and balanced use of both inorganic with organic fertilizers would be a feasible option to enhancing sustainability of the rice production system while reducing environmental degradation risks in Thailand, as these options have been proposed by Tilman (Citation1998), Tilman et al. (Citation2011), and Foley et al. (Citation2011). An increased level of soil organic matter due to organic manure application (Naklang et al. Citation1998; Whitbread et al. Citation2003; Vityakon Citation2007); nutrient balance maintenance, i.e., balancing the input and output of nutrients in the paddy system (Whitbread et al. Citation1999, Citation2003); and site-specific soil and fertilizer management (Funakawa et al. Citation2006; Haefele and Konboon Citation2009; Attanandana et al. Citation2010) and their combinations are among the feasible options.
Figure 4. Relationship between the clay content and total C, total N,, exchangeable K contents and CEC of the soils in the 2010s. NE: northeastern region, NT: northern region, CE: central plain, and BK: Bangkok Plain
3.4. Comparison with cases in other tropical countries
A couple of research projects similar to ours in terms of the methodology were carried out in Bangladesh (Ali et al. Citation1997a, Citation1997b) and Indonesia (Darmawan et al. Citation2006a, Citation2006b) to investigate long-term changes of soil fertility status under the Green Revolution. Ali et al. (Citation1997a, Citation1997b) reported a decrease in pH, total C and N (organic matter), available P, and exchangeable bases in paddy fields of Bangladesh during 1967–1995. Darmawan et al. (Citation2006a, Citation2006b) documented that a significant decrease in pH but a significant increase in total C and increasing trend in total N, significant increase in available P, exchangeable Ca and Mg and significant decrease in exchangeable K were found in Indonesia during 1970–2003. Meanwhile, in Thailand, significant increases in the pH, total C and N (organic matter), available P, and exchangeable K have been observed, and there is also a significant decrease in exchangeable Mg. These results directly suggest that 1) the Green Revolution has had relatively positive effects on the fertility status of paddy soil in Thailand and that 2) the effects of the Green Revolution have been quite variable, from negative to positive, among the participating countries, depending on the period and extent of its introduction, original soil fertility levels, and economic situations of the countries concerned. Therefore, rational soil/fertilizer management schemes should be established based on each country’s specific situation.
4. Conclusion
The fertility level of the paddy soil in Thailand has generally improved over the last 50 years due to the Green Revolution. An increase of over 10-fold in the available P content has been the most prominent change during this period, with a concomitant increase in organic matter (total C and total N), available N, and exchangeable K. The regional variation of the fertility level is also prominent; it is relatively high for the soil in the BK, but relatively low for the soil in the NE, as suggested by frequent deficiency in the available P, exchangeable K, exchangeable Mg, and available Si. It is also assumed that a large amount of nutrients, especially N and K, have been released into the environment. In conclusion, an efficient and balanced use of both inorganic and organic fertilizers is a feasible option to achieve sustainable rice production and environmental conservation in Thailand during the coming decades, and the establishment of rational and sustainable soil/fertilizer management schemes to improve the fertility status of the paddy soil in the NE will be an especially challenging issue to address.
Supplemental Material
Download Zip (1.6 MB)Acknowledgments
The authors would like to express their deep gratitude to Dr. Kazutake Kyuma, Emeritus Professor of Kyoto University, and Dr. Toshiyuki Wakatsuki, Emeritus Professor of Shimane University, for their constructive suggestions on this research. They would like to thank Dr. Shinya Funakawa, Professor of Kyoto University, Dr. Eiji Nawata, Emeritus Professor of Kyoto University, Dr. Tepparit Tulaphitak, Khon Kaen University, and late Dr. Tomoo Hattori, Emeritus Professor of Kyoto Prefectural University, for their long-term collaboration and support for our research in Thailand. They also wish to thank Dr. Audthasit Wongmaneeroj for his editing of this manuscript and two anonymous reviewers for their critical and constructive comments.
Disclosure statement
No potential conflict of interest was reported by the authors.
Supplementary material
Supplemental data for this article can be accessed here.
Additional information
Funding
Related Research Data
References
- Ali, M., S. M. Saheed, D. Kubota, T. Masunaga, and T. Wakatsuki. 1997a. “Soil Degradation during the Period 1967-1995 in Bangladesh: I. Carbon and Nitrogen.” Soil Science and Plant Nutrition. 43: 863–878. doi:https://doi.org/10.1080/00380768.1997.10414653.
- Ali, M., S. M. Saheed, D. Kubota, T. Masunaga, and T. Wakatsuki. 1997b. “Soil Degradation during the Period 1967-1995 in Bangladesh: II. Selected Chemical Characters.” Soil Science and Plant Nutrition. 43: 879–890. doi:https://doi.org/10.1080/00380768.1997.10414654.
- Attanandana, T., S. Kongton, B. Boonsompopphan, A. Polwatana, P. Verapatananirund, and R. Yost. 2010. “Site-specific Nutrient Management of Irrigated Rice in the Central Plain of Thailand.” Journal of Sustainable Agriculture 34 (3): 258–269. doi:https://doi.org/10.1080/10440041003613297.
- Bray, R. H., and L. T. Kurtz. 1945. “Determination of Total, Organic, and Available Forms of Phosphorus in Soils.” Soil Science 59 (1): 39–45. doi:https://doi.org/10.1097/00010694-194501000-00006.
- Bremner, J. M. 1996. “Nitrogen-Total.” In Methods of Soil Analysis Part 3 – Chemical Methods, edited by D. L. Sparks, 1085–1121. Wisconsin: SSSA Book series: 5. Soil Science Society of America and American Society of Agronomy.
- Castillo, C. 2011. “Rice in Thailand: The Archaeobotanical Contribution.” Rice 4 (3–4): 114–120. doi:https://doi.org/10.1007/s12284-011-9070-2.
- Center for Agricultural Statistics, Ministry of Agriculture, Thailand. 2008. Agricultural Statistics of Thailand. Bangkok: Thailand.”.
- Darmawan, K. K., A. Saleh, H. Subagjo, T. Masunaga, and T. Wakatsuki. 2006a. “Effect of Green Revolution Technology from 1970 to 2003 on Sawah Soil Properties in Java, Indonesia: I. Carbon and Nitrogen Distribution under Different Land Management and Soil Types.” Soil Science and Plant Nutrition 52: 634–644. doi:https://doi.org/10.1111/j.1747-0765.2006.00075.x.
- Darmawan, K. K., A. Saleh, H. Subagjo, T. Masunaga, and T. Wakatsuki. 2006b. “Effect of Green Revolution Technology during the Period 1970–2003 on Sawah Soil Properties in Java, Indonesia: II. Changes in the Chemical Properties of Soils.” Soil Science and Plant Nutrition 52: 645–653. doi:https://doi.org/10.1111/j.1747-0765.2006.00054.x.
- Evenson, R. E., and D. Gollin. 2003. “Assessing the Impact of the Green Revolution, 1960 to 2000.” Science 300: 758–762. doi:https://doi.org/10.1126/science.1078710.
- Foley, J. A., N. Ramankutty, K. A. Brauman, E. S. Cassidy, J. S. Gerber, M. Johnston, N. D. Mueller, et al. 2011. “Solutions for a Cultivated Planet.” Nature 478 (7369): 337–342. DOI:https://doi.org/10.1038/nature10452.
- FAOSTAT (Food and Agriculture Organization of the United Nations). 2018. “FAOSTAT.” http://www.fao.org/faostat/en/#home
- Funakawa, S., J. Yanai, Y. Hayashi, T. Hayashi, T. Watanabe, T. Noichana, T. Panitkasate, R. Katawatin, T. Kosaki, and E. Nawata. 2006. “Soil Organic Matter Dynamics in a Sloped Sandy Cropland of Northeast Thailand with Special Reference to the Spatial Distribution of Soil Properties.” Japanese Journal of Tropical Agriculture 50: 199–207.
- Haefele, S. M., and Y. Konboon. 2009. “Nutrient Management for Rainfed Lowland Rice in Northeast Thailand.” Field Crops Research 114 (3): 374–385. doi:https://doi.org/10.1016/j.fcr.2009.09.007.
- Hattori, T. 1972. “Some Properties of Brackish Sediments along the Chao Phraya River of Thailand.” The Southeast Asian Studies 9: 522–532.
- Homma, K., T. Horie, T. Shiraiwa, N. Supapoj, N. Matsumoto, and N. Kabaki. 2003. “Toposequential Variation in Soil Fertility and Rice Productivity of Rainfed Lowland Paddy Fields in Mini-Watershed (Nong) in Northeast Thailand.” Plant Production Science 6 (2): 147–153. doi:https://doi.org/10.1626/pps.6.147.
- Hungspreugs, M., W. Utoomprurkporn, S. Dharmvanij, and P. Sompongchaiyakul. 1989. “The Present Status of the Aquatic Environment of Thailand.” Marine Pollution Bulletin 20 (7): 327–332. doi:https://doi.org/10.1016/0025-326X(89)90155-0.
- IRRI. 2000. Mineral Deficiencies, in Rice: Nutrient Disorders & Nutrient Management ed by A. Dobermann and T. H. Fairhurst, 40–119. Inc., Oxford Graphic Printer Pte. Ltd., Singapore.
- Kawaguchi, K. & Kyuma, K. 1969. “Lowland Rice Soils in Thailand.” Center for Southeast Asian Studies, Kyoto University. Tokyo, Yokendo Ltd. pp270.
- Kawaguchi, K., and K. Kyuma. 1977. Paddy Soils in Tropical Asia. Their Material Nature and Fertility, 258. Honolulu: University Press of Hawaii.
- Kawasaki, J., and S. Herath. 2011. “Impact Assessment of Climate Change on Rice Production in Khon Kaen Province, Thailand.” Journal of ISSAAS. 17: 14–28.
- Klute, A., ed. 1986. Methods of Soil Analysis Part 1 – Physical and Mineralogical Methods. 2nd ed. 1188. Wisconsin: SSSA Book series: 5. American Society of Agronomy and Soil Science Society of America.
- Lal, R. 2004. “Soil Carbon Sequestration Impacts on Global Climate Change and Food Security.” Science 304 (5677): 1623–1627. doi:https://doi.org/10.1126/science.1097396.
- Lal, R., W. Negassa, and K. Lorenz. 2015. “Carbon Sequestration in Soil.” Current Opinion in Environmental Sustainability 15: 79–86. doi:https://doi.org/10.1016/j.cosust.2015.09.002.
- Land Development Department, Ministry of Agriculture and Cooperatives, Thailand. 1994. General Soil Map of Thailand (1:1,250,000). Bangkok, Thailand.
- Limtong, P. 2012. “Status and Priorities of Soil Management in Thailand.” In Technical Workshop on “Managing Living Soils, 44. Rome, Italy: Global Soil Partnership, FAO. http://www.fao.org/global-soil-partnership/pillars-action/1-soil-management/workshop-managing-living-soils-5-7-dec2012/en/
- Minasny, B., B. P. Malone, A. B. McBratney, D. A. Angers, D. Arrouays, A. Chambers, V. Chaplot, et al. 2017. “Soil Carbon 4 per Mille”. Geoderma 292: 59–86. doi:https://doi.org/10.1016/j.geoderma.2017.01.002.
- Ministry of Natural Resources and Environment, Thailand (Geological Survey Division, Department of Mineral Resources). 1999. “Geological Map of Thailand 1:2,500,000.” Bangkok, Thailand.
- Mitsuchi, M. 1990. “Japan’s Oversea Research Activities. 4. Problem Soils in the Northeast of Thailand.” Japanese Journal of Soil Science and Plant Nutrition 61: 323–329. in Japanese.
- Naklang, K., A. Whitbread, R. D. B. Lefroy, G. J. Blair, S. Wonprasaid, Y. Konboon, and D. Suriya-awnroj. 1998. “The Management of Rice Straw, Fertilisers and Leaf Litters in Rice Cropping Systems in Northeast Thailand. 1. Soil Carbon Dynamics.” Plant and Soil 209: 21–28. doi:https://doi.org/10.1023/A:1004571015620.
- Nelson, D. W., and L. E. Sommers. 1996. “Total Carbon, Organic Carbon, and Organic Matter.” In Methods of Soil Analysis Part 3 – Chemical Methods, edited by D. L. Sparks, 961–1010. Wisconsin: SSSA Book series: 5. Soil Science Society of America and American Society of Agronomy.
- Peel, M. C., B. L. Finlayson, and T. A. McMahon. 2007. “Updated World Map of the Köppen-Geiger Climate Classification.” Hydrology and Earth System Sciences 11: 1633–1644. doi:https://doi.org/10.5194/hess-11-1633-2007.
- Pingali, P. L. 2012. “Green Revolution: Impacts, Limits, and the Path Ahead.” Proceedings of the National Academy of Sciences 109 (31): 12302–12308. doi:https://doi.org/10.1073/pnas.0912953109.
- Prakongkep, N., A. Suddhiprakarn, I. Kheoruenromne, M. Smirk, and R. Gilkes. 2008. “The Geochemistry of Thai Paddy Soils.” Geoderma 144 (1–2): 310–324. doi:https://doi.org/10.1016/j.geoderma.2007.11.025.
- Rerkasem, B. 2015. “The Agroecosystem of Thai Rice: A Review.” CMU Journal of Natural Sciences 14: 1–22.
- Sinsakul, S. 2000. “Late Quaternary Geology of the Lower Central Plain, Thailand.” Journal of Asian Earth Sciences 18 (4): 415–426. doi:https://doi.org/10.1016/S1367-9120(99)00075-9.
- Soil Survey Staff. 2003. Keys to Soil Taxonomy. 9th ed., 332. Washington DC, USA: USDA Natural Resources Conservation Service.
- Takaya, Y. 1980. “The Reclamation of the Chao Phraya Delta.” The Center for Southeast Studies 17: 633–657. in Japanese.
- Tilman, D. 1998. “The Greening of the Green Revolution.” Nature 396 (6708): 211–212. doi:https://doi.org/10.1038/24254.
- Tilman, D., C. Balzer, J. Hill, and B. L. Befort. 2011. “Global Food Demand and the Sustainable Intensification of Agriculture.” Proceedings of the National Academy of Sciences of the United States of America 108: 20260–20264.
- Tulaphitak, T., K. Miura, K. Sakurai, and K. Kyuma. 1996a. “Some Plateau Soils and Their Materials in the Khon Kaen Area, Northeast Thailand. I. General Characteristics of Soils and Soil Materials.” Journal of Tropical Agriculture 40: 74–83.
- Tulaphitak, T., K. Miura, K. Sakurai, and K. Kyuma. 1996b. “Some Plateau Soils and Their Materials in the Khon Kaen Area, Northeast Thailand. II. Soil Material Characterization and Classification.” Journal of Tropical Agriculture 40: 84–88.
- United Nations (Department of Economic and Social Affairs, Population Division). 2019. “World Population Prospects: The 2019 Revision, Key Findings and Advance Tables.” Working Paper No. ESA/P/WP/248.
- Vityakon, P. 2007. “Degradation and Restoration of Sandy Soils under Different Agricultural Land Uses in Northeast Thailand: A Review.” Land Degradation and Development 18 (5): 567–577. doi:https://doi.org/10.1002/ldr.798.
- Watabe, T. 1964. “On the Technologies of Paddy Rice Production in Thailand.” The Southeast Asian Studies 2: 25–42. in Japanese.
- Whitbread, A., G. Blair, Y. Konboon, R. Lefroy, and K. Naklang. 2003. “Managing Crop Residues, Fertilizers and Leaf Litters to Improve Soil C, Nutrient Balances, and the Grain Yield of Rice and Wheat Cropping Systems in Thailand and Australia.” Agriculture, Ecosystems & Environment 100 (2–3): 251–263. doi:https://doi.org/10.1016/S0167-8809(03)00189-0.
- Whitbread, A., G. Blair, K. Naklang, R. D. B. Lefroy, S. Wonprasaid, Y. Konboon, and D. Suriya-Arunroj. 1999. “The Management of Rice Straw, Fertilisers and Leaf Litters in Rice Cropping Systems in Northeast Thailand: 2. Rice Yields and Nutrient Balances.” Plant and Soil 209 (1): 29–36. doi:https://doi.org/10.1023/A:1004519031550.
- Whittig, L. D., and W. R. Allardice. 1986. “X-ray Diffraction Techniques.” In Methods of Soil Analysis Part 1 – Physical and Mineralogical Methods, edited by A. Klute, 2nd ed., 331–362. American Society of Agronomy and Soil Science Society of America: Wisconsin. Agronomy Monograph no. 9.
- WHO (World Health Organization). 1990. Public Health Impacts of Pesticides Used in Agriculture. Geneva: WHO in collaboration with the United Nations Environment Programme.
- Yadvinder-Singha, B.-S., J. K. Ladha, C. S. Khinda, T. S. Khera, and C. S. Bueno. 2004. “Effects of Residue Decomposition on Productivity and Soil Fertility in Rice–wheat Rotation.” Soil Science Society of America 68: 854–864.
- Yanai, J., S. Nakata, S. Funakawa, E. Nawata, R. Katawatin, and T. Kosaki. 2010. “Effect of NPK Application on the Growth, Yield and Nutrient Uptake by Sugarcane on a Sandy Soil in Northeast Thailand.” Tropical Agriculture and Development 54: 113–118.
- Yanai, J., S. Nakata, S. Funakawa, E. Nawata, R. Katawatin, T. Tulaphitak, and T. Kosaki. 2007. “Evaluation of Nutrient Availability of Sandy Soil in Northeast Thailand with Reference to Growth, Yield and Nutrient Uptake by Maize.” Journal of Tropical Agriculture 51: 169–176.