
ABSTRACT
The root phosphorus (P) uptake efficiency (RE), defined as plant P uptake per unit root mass or root area, may contribute to the P efficiency of upland rice grown in acid, P-deficient soils. The identification of root traits conferring RE of rice has been compromised by the lack of attention given to P speciation when evaluating P-mining mechanisms. Here we disentangled the effect of soluble organic P (PO) from that of total soluble P (PT) on the RE in rice seedlings in acid soil. Six rice genotypes were grown for 21 days in P-deficient substrates, i.e. a sample of an acid mineral soil, an acid peat and a mixture thereof. Each of the three substrates were amended with different P doses, partially limed and incubated, yielding substrates with significant differences in total soluble P (0.005–0.41 mg P/L) and in the percentage of organic P in that pool (PO/PT, 0–55%). Plants showed a large growth response to the P addition. There was a significant genotypic variation in P uptake (0.9–1.5mg P/plant) and RE (4.4–8.3 mg P/g root mass) under moderate P deficiency but these traits were unaffected by the PO/PT in the soluble fraction of the substrates. Along the same lines, phosphatase activity in the rhizosphere soil was unaffected by genotypes and did not explain the RE among all data (R2 = 0.17, ns). A multiple regression model showed that the RE of rice seedlings was mainly affected by the inherent genotypic effects, the PO/PT and the total soluble P concentration in soil (R2 = 0.73), while the genotype-PO/PT interaction only marginally improved the RE model (R2 = 0.78). This suggests limited genotypic effects due to the better use of organic P. A root elongation test in the acid mineral soil that was either or not limed suggests that the differences in acid soil tolerance may play a larger role in the genotypic performance of RE than organic P utilization potential.
1. Introduction
Phosphorus (P) deficiency is the major constraint in upland rice production in highly weathered, acid P-fixing soils, especially in small-scale farming systems due to the poor accessibility to inorganic P fertilizers (Sanchez et al. Citation1997; Masso et al. Citation2017). Selecting for high P acquisition efficiency (PAE; P uptake capacity of the plant under low P availability, expressed in mg P/plant) could be an entry-point for the resource-poor farmers to reduce fertilizer requirements by expanding the soil P pool that rice plants can access. There is a large genotypic variation in upland rice for PAE (Vandamme et al. Citation2016), which basically attributes to the difference in root development under low P conditions and to lesser extent to root P uptake efficiency (RE; plant P uptake per unit root mass or surface area) (Wissuwa and Ae Citation2001; Mori et al. Citation2016). With a modeling study, Wissuwa (Citation2003) demonstrated that a small (i.e. around 30%) increase of RE can result in as much as three-fold increase of PAE. This is achieved by a combined effect of increased P uptake per unit root size (primary effect) and the subsequent root growth which amplifies the primary P uptake effect on PAE (secondary effect). Currently, RE is observed as a combination of root hair development and the plant capacity of P mining, i.e. taking up P from sparingly available sources (Mori et al. Citation2016; Nestler and Wissuwa Citation2016; Wissuwa, Gonzalez, and Watts-Williams Citation2020). Improvement of RE through an enhanced P mining capacity can be particularly useful in the acid P-fixing soils that are wide-spread in upland rice production areas (Haefele, Nelson, and Hijmans Citation2014).
It is well established that the root-induced mobilization of sparingly available P in the plant rhizosphere involves roughly two mechanisms releasing either inorganically or organically bound P, directly or indirectly by root exudate secretion (Richardson et al. Citation2011). Briefly, direct P mobilization by root exudates are through 1) local acidification dissolving Ca-P complexes by proton release; 2) complexation of Fe/Al species with organic anion release; 3) organic P mineralization by phosphatase release. Indirectly, root exudates can also enhance rhizosphere P mobilization through plant-microbe interactions, as root exudates attract soil microorganisms as readily available C sources (Spohn, Ermak, and Kuzyakov Citation2013). The P mobilization in the rice rhizosphere has been suggested by many researchers; however, the breeding efforts to incorporate such traits has been complicated (see extensive review from Vandamme et al. Citation2016).
In highly weathered, acid soils rich in Fe/Al (hydr-)oxides, the majority of orthophosphate and generally abundant organic P species (i.e. inositol phosphates) are adsorbed to these oxyhydroxides and form stable complexes (Celi and Barberis Citation2004; Guedes et al. Citation2016). Organic anions can mobilize these surface-complexed P, and root secretion of organic anions has been extensively studied for rice (Rose et al. Citation2013). However, the capacity of rice to release P from strongly bound Fe/Al-P complexes in such soils is questioned due to the low release rate (Wissuwa, Gonzalez, and Watts-Williams Citation2020). In small-scale farming systems where OM amendments are widely applied as the alternative fertilizers, humic-bound phosphomonoesters can constitute a large fraction of total P (McLaren et al. Citation2015), with lesser extent phosphodiesters (Turner and Leythem, Citation2004). These fractions, especially phosphodiesters, are less strongly protected P species and hence more plant-accessible (Turner and Leytem Citation2004; Gerke Citation2015). Previous studies have suggested the significance of such relatively labile organic P fractions on rice P nutrition in highly weathered soils (Turner Citation2006; Nishigaki et al. Citation2019). The upregulation of root extracellular phosphatase secretion in rice in response to P deficiency has been reported (Pariasca-Tanaka et al. Citation2009; Lu et al. Citation2016; Mehra, Pandey, and Giri Citation2017; Gao et al. Citation2017). However, the effect of this trait on genotypic variation in rice PAE has been inconclusive (Rose et al. Citation2013). A number of constraints can be considered as follows: 1) limited number of tested genotypes; 2) complex nature of organic P species present in the tested soils, 3) overriding effect of more efficient microbial phosphatases on P mineralization, 4) soil components affecting the efficacy of phosphatases, and 5) limitation of measuring potential phosphatase activity as a surrogate of in-situ organic P mineralization capacity (Hedley, Kirk, and Santos Citation1994; Li et al. Citation2008; Quiquampoix and Mousain Citation2004; Pariasca-Tanaka et al. Citation2009; Richardson et al. Citation2011).
Here, we assessed differences in upland rice genotypes in their capacity to acquire P from organic fractions in acid soils to explain their differences in RE. The selected rice genotypes were grown in the three acid, P-deficient substrates, i.e. a mineral soil, a peat soil and a mixture thereof. Each substrate was amended with different P doses, partially limed to an equal pH and incubated, yielding substrates with significant differences in total soluble P (PT) and its organic P fraction (PO/PT) in the 0.01 M CaCl2 extracts as an index of P availability. Peat soil contains large amounts of organic P including humic-bound P and other readily hydrolysable organic P species (Shand and Smith Citation1997; Turner and Newman, Citation2005), making it a relevant organic P source for rice plants to test organic P utilization under realistic soil conditions. The mineral soil was selected as an extremely organic P-poor substrate. By combining organic soil with mineral soil, this mixture soil has an intermediate property in all soil characteristics. The RE of tested genotypes was related to the concentrations of P and to the fractions of soluble P that is organic. The potential P mineralization capacity was measured as phosphatase activity in rhizosphere soil, which is a total sum of plant- and microbial phosphatase activity and the potential enzyme-deactivation effect of Fe/Al (hydro-)oxides in the soil. Our specific hypotheses were that: 1) Genotypic ranking in RE changes with an increasing fraction of organic P in the soil solution i.e. some genotypes stand out in RE when organic P is more dominant; 2) Genotypes previously identified with a high RE in the soil rich in organic P take up more P when the organic fraction of P is larger; 3) such genotypes show higher phosphatase activities in the rhizosphere soil than in the bulk soil, either because of higher secretion of phosphatase from their roots or from the rhizosphere microbial community.
2. Materials and methods
2.1. Plant materials
Six rice varieties (i.e. genotypes) including four O. sativa (aus subspecies: DJ 123, indica subspecies: Sadri Tor Misri, japonica subspecies: Chomrong Dhan and FOFIFA 172), one O. glaberrima (CG 14) and one interspecific variety between japonica and O. glaberrima (NERICA 4) were used in this experiment. All varieties were upland varieties except for Sadri Tor Misri, a lowland variety. In this experiment, NERICA 4 and FOFIFA 172 were used as the reference varieties since they have a large yield potential in the upland rice system and would be further improved for PAE by using candidate donor varieties. The four other varieties were used as potential high PAE donors with contrasting RE based on previous studies in P-deficient soils (Koide et al. Citation2013; Saito et al. Citation2015; Mori et al. Citation2016; Wissuwa, personal communication). Among the tested genotypes, Chomrong Dhan and FOFIFA 172 have not been tested for PAE but were added as potentially useful genotypes based on their grain yield performance under suboptimal OM-based fertilization scheme (Raboin et al. Citation2014).
2.2. Substrates
Two low-P acid soils with contrasting organic carbon content were selected for the mineral and organic substrates in this pot experiment. The top soils (0–20 cm) were collected from the unfertilized part of a farmer’s upland field in Behenjy, Madagascar in April 2017 and a peat soil in Holsbeek, Belgium in October 2017 (). The soils were air-dried and sieved over 4 mm (mineral soil) and 1 cm (organic soil) for the pot experiment, and subsamples of both soils were further sieved over 2 mm to determine chemical properties (). Part of mineral and organic soils were mixed (50/50 by volume, i.e. 64/36 by weight) to create the third substrate, termed mixture. For the pot experiment, these substrates were moistened to 10% w/w with distilled water and pre-incubated for 1 month at 25°C. This pretreatment was done in order to restore microbial activity and bring it to a more stable condition (i.e. stable respiration after 3 weeks; Vermeiren, personal communication).
Table 1. Soil properties of two acid, low-P soils with contrasting SOC contents sampled for the pot experiment
2.3. Pot experiment
The pre-incubated substrates were limed to pHCaCl2 4.5 (Solid:Liquid = 1:10) with 0.5 M Ca(OH)2 suspension at the following doses: 0.37 (mineral), 1.30 (mixture) and 2.59 (organic) g of Ca(OH)2 per kg substrate. The substrates were thoroughly mixed and incubated for 7 days at 25°C for equilibration. This pH was selected in order to limit the depletion of organic P from the CaCl2-extrable P pool, which will be explained later in this section. Together with lime, other nutrients were also applied as blanket as follows: 33.3 mg K/kg substrate (as KCl), 20.8 mg Mg/kg and 27.5 mg S/kg (as MgSO4.7H2O), 0.83 mg Fe/kg (as FeCl3.6H2O), 0.83 mg Mn/kg (as MnCl2.2H2O), 0.83 mg Zn/kg (as ZnCl2), 0.83 mg Cu/kg (as CuCl2.2H2O), 0.083 mg B/kg (as Na2B4O7.10H2O), and 0.083 mg Mo/kg (as Na2MoO4.2H2O). Nitrogen (N) was applied as NH4NO3 to have a final amount of 100 mg N/kg available over the entire experiment, taking into account the N mineralization of the mixture and the organic substrates. Both substrates showed the same low N mineralization rate (i.e. 0.9 mg N/kg/day) by 1 M KCl substrate extraction (Houba et al. Citation1989).
After 7 days of incubation of the limed and fertilized soils, each of the three substrates were further fertilized with P, yielding three levels of P availability. The three P availability levels, with P concentrations expressed as mg P/L in the 0.01 M CaCl2 extract, were established as follows: low P (i.e. native substrate P, 0.005–0.0 4mg/L), medium P (i.e. critical P concentration, 0.1 mg/L; Hue and Fox Citation2010), and high P (i.e. saturated amount of P, 1 mg/L). The high P level was used to determine the growth potential of each genotype in this experiment, through a presumably adequate supply of P. In the medium and high P treatments, different amounts of soluble P were applied as KH2PO4 to obtain the same total P concentration in 0.01 M CaCl2 extracts of all substrates (PT), based on the P sorption isotherm of limed substrates using the protocol described by Six, Smolders, and Merckx (Citation2013) (Figure S1, supplementary information). To obtain that isotherm, a fresh, limed substrate sample of 2-g air-dry equivalent was incubated for 16 h in 20 ml of 0.01 M CaCl2 solution with increasing doses of KH2PO4 (i.e. 0–2000 mg P/kg). Samples were then centrifuged at 2000 g for 10 minutes, and the subsample of supernatant was filtered through a 0.45 µm membrane filter. The total P concentration in the filtered supernatants was measured by Inductively Coupled Plasma Mass Spectroscopy (ICP-MS; Agilent 7700x, Agilent Technologies, Inc.) with a Limit of Quantification (LOQ) equal to 3 µg P/L. The inorganic P concentration was measured by spectrophotometry after color reaction with malachite green (Van Veldhoven and Mannaerts Citation1987) and measuring at a wavelength of 630 nm (Lambda 25, Perkin Elmer Inc.) with a LOQ of PI equal to 8 µg P/L. The organic P (PO) in solution was calculated by subtracting the inorganic P concentration (PI, malachite green) from the total P (ICP-MS), i.e. PO = PT – PI. Hereby we assumed that the organic P was negligible in the P measured by the malachite green method (Van Moorleghem et al. Citation2011). To achieve 0.1 and 1 mg/L of solution P concentration by 0.01 M CaCl2 extraction, the following P doses were applied: 250 mg and 600 mg P/kg to the mineral, 250 mg and 650 mg P/kg to the mixture, and 250 mg and 800 mg P to the organic substrate, respectively. The substrates were wetted with distilled water to 82–89% of the water holding capacity (i.e. WHC; 35, 44, 59 L/kg oven-dry soil for mineral, mixture and organic substrate). The moist substrates were filled in PVC tubes (4 cm diameter × 25 cm height) with the bottom part closed with a nylon mesh (pore size 2 mm) to have the same soil volume (i.e. about 2 cm below the edge). This resulted in 250, 195, 147 g air-dry equivalent/pot for the mineral, mixture and organic substrate, respectively. The substrate was capillary-wetted from the cup set at the bottom of the tube. Rice seeds were immediately sown after wetting the substrates.
Before planting, rice seeds had been sterilized with 0.5% NaOCl solution and pre-germinated for 3–6 days at 25°C in a wet paper towel soaked in 1 mM CaSO4 solution. Two seeds were sown in each tube and covered with black plastic pellets to avoid rapid moisture evaporation from the substrate surface. When most seedlings of each genotype reached 5 cm (i.e. 3–5 days after sowing, DAS), the young seedlings were thinned to have one plant per tube for a uniform growth in each genotype. The plants were grown for 21 days in the growth chamber with a 12/12 h day/night cycle with 25/20°C day/night temperature, 75% relative humidity and the photosynthetic photon flux density of 721.3 µmol/m2/s. The substrate moisture content was adjusted every day by adding distilled water to compensate for the weight loss of the tubes. In order to evaluate non plant-induced organic P mineralization (i.e. P mineralization without direct/indirect effect of root exudates) during growth period, substrate columns without plant (i.e. no-plant control) were incubated for 10 days side by side to the plants. Genotypes, substrates and P treatments were completely randomized with 3 replicates, and the position of the PVC tubes was changed every week.
After 10 days, fresh substrate samples were collected from the no-plant control and kept at 4°C until analysis. At plant sampling at 21 DAS, shoots were cut and roots were carefully extracted from the substrate as follows. The whole substrate columns were gently pulled out of the PVC tubes and the majority of substrate removed from the roots by hand. The roots were subsequently shaken and the remaining thin layer (i.e. approximately 2–4 mm) of substrate adhering to the roots was defined as rhizosphere substrate (Veneklaas et al. Citation2003). That fraction was collected separately from the bulk substrate by gently rubbing roots with fingers with clean nitrile gloves. The rhizosphere and bulk substrate samples were immediately stored in a cool box before transferring to a freezer set at −25°C. Roots were further cleaned by rinsing with tap water on a 1 mm sieve.
2.4. Plant and substrate measurements
Fresh substrate samples from the no-plant control were extracted in 0.01 M CaCl2 solution for 2 h (Houba et al. Citation2000) to measure inorganic and organic P concentrations as described for the method of P sorption isotherm.
Shoot and root dry weights were recorded after drying at 70°C for 2 days. Whole shoot samples were digested with nitric acid at 120°C in the block digester (DigiPREP MS, SCP Science Co.), and whole root samples digested with 40% aqua regia at room temperature (i.e. around 20–23°C) after muffling at 550°C for 4 h (Benton Jones, Jr. and Case, Citation1990). The P concentration of both plant parts were determined with Inductively Coupled Plasma Optical Emission Spectrometer (ICP-OES; iCAP 7000 series, Thermo Scientific Inc.). The P acquisition efficiency was expressed as the absolute value of shoot P content (mg P/plant) obtained at low P level. Root P uptake efficiency (RE) was calculated as total plant P content divided by root dry weight in mg P/g root dry weight. The RE was only calculated for the suboptimal P level (i.e. low P level) because P uptake at the optimal P level (i.e. medium and high P levels) is controlled by other factors than the efficiency in P uptake (Vandamme et al. Citation2016). At the low P level, RE was only calculated when detectable P uptake was observed (i.e. total P content > seed P content).
Phosphatase activity in the rhizosphere substrate of each genotype in the low P treatment was determined with a microplate assay using 4-methylumbelliferone (MU) which is measured fluorimetrically after releasing phosphate from its phosphorylated form, based on Marx, Wood, and Jarvis (Citation2001) and DeForest (Citation2009) after some modifications described below. Triplicate samples of the bulk substrate in each substrate treatment were included. Random genotypes were selected for bulk substrate sampling based on the assumption that the difference in genotype only influences rhizosphere substrate. Due to possible variation of measured activity among pots, the activity of the collected bulk substrates was compared with the rhizosphere substrates of the corresponding pots (i.e. n = 3). To measure phosphatase activity of selected substrate samples, 400 mg of frozen substrate sample was mixed with 40 ml of sterile 25 mM acetate buffer adjusted to pH 4.5 and homogenized by vortex for 2 minutes. While one sample was being weighed, the other samples were kept in a polystyrene box filled with ice cubes. All samples were handled within 20 minutes before the buffer was mixed to avoid thawing. Aliquots of 200 µl of the obtained homogenates were pipetted into the solid black microplate making three analytical replicates for each sample, and subsequently mixed with either 50 µl of increasing concentration of sterile MU solution (i.e. standard curve: 0, 2.5, 5, 10, 25, 50 µM) or 0.5 mM sterile 4-methylumbelliferyl phosphate (MUP) solution. A standard curve was made for each substrate sample due to the difference in background quenching. A duplicate of the buffer control (i.e. buffer without substrate mixed) was applied for each microplate set to calculate autohydrolysis of MUP. NaOH was not added to increase pH because the fluorescence was sufficiently detectable in the preliminary test. Microplates were incubated at 25°C for 45 minutes in the dark condition. The fluorescence intensity was measured using a microplate fluorimeter (Fluoroskan Ascent FL, Thermo Fisher Scientific Co.) with 355 nm excitation and 460 nm emission wavelength. The phosphatase activity was calculated as µmol MU released from MUP per g oven-dry substrate (105°C) per hour incubated. The MU stock solution was made 1 day before assay and renewed after 3–4 days to prevent degradation (DeForest Citation2009). The MU working standard series and the MUP solution were also made 1 day before assay, but freshly made every time. It should be noted that the comparison of absolute values is only valid within this experiment due to possible sample degradation after long storage of frozen substrate samples (i.e. over 6 month).
2.5. Statistical analysis
All data were subjected to analysis of variance (ANOVA) using JMP software (JMP pro 14, SAS Institute Inc.). The standard least square model was applied to examine the effect of genotype (G), substrate (S), P level (P) and their interactions on P uptake and RE of the tested rice plants. Tukey’s honestly significant difference (HSD) test with a threshold of P < 0.05 was used to compare means of genotypes within the S × P treatment. Dunnet’s test with a threshold of P < 0.05 was used to compare means of the phosphatase activity in the rhizosphere substrate with that of the bulk substrate.
A multiple linear regression model was tested in order to assess the effect of genotype, available P and substrate organic P fraction in the CaCl2 extract on P uptake expressed by shoot P content and RE. The model reads:
γ = (β0 + β0, genotype) + β1 * (PT) + (β2 + β2, genotype) * (PO/PT) + β3 * (PT) * (PO/PT)
where γ represents either P uptake or RE, and β0, β1, β2, β3 are regression coefficients which are adjusted to reflect the variation of genotype (categorical variable) by applying genotype-specific corrector values (βi, genotype; i is 0 or 2). PT represents the total P concentration (mg P/L) in the 0.01 M CaCl2 substrate extract at the day of transplanting, and PO/PT represents the percentage (%) of organic P to the total P concentration in the substrate extract. Data from the mineral low P substrate was excluded because of no detectable P uptake, and all data from the high P level was also excluded due to high P supply exceeding plant requirement. The threshold of P < 0.05 was applied to evaluate the significance of model parameters.
3. Results
3.1. Change of inorganic and organic P concentration in the substrate extract without plants
The total P concentration in the CaCl2 extract of the substrates and the organic fraction of P in that extract was significantly affected by the P level, the substrate and their interactions (). At the day of planting, the total P concentration (PT) ranged between 0.005–0.04 mg P/L among substrates at the low P level, with the mineral substrate severely P-deficient compared to the organic and the mixture substrate (). The organic fraction of the P in solution (PO/PT) ranged between 0–43% at this P level. The organic P fraction decreased in the mineral substrate as well as in the mixture substrate at the medium P level to roughly 20%, and it was mostly replaced by inorganic P in all substrates at the high P level. In the organic substrate, the organic P fraction was about 50% at the medium P level. After 10 days of substrate incubation, the total P concentration at the low P level was higher in the organic substrate compared to the two other substrates (). The fraction of organic P was depleted in two substrates except for the organic substrate. In this substrate, the organic P fraction decreased by 10% while the absolute concentration of organic P was unchanged.
Table 2. The total P concentration (PT) and the organic P fraction (PO/PT) in 0.01 M CaCl2 extracts of three substrates at 0 and 10 days after planting at three added P levels. *** = p < 0.001; ** = p < 0.01; * = p < 0.05; ns = p > 0.05, in the effect of P treatment, substrate and its interaction
3.2. Plant growth response to the increasing P level
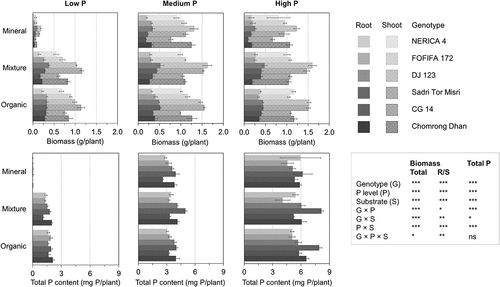
The plants demonstrated a large growth response to the increasing P availability from the low P to the medium P level (). Especially the plants grown in the mineral substrate displayed a sharp increase in biomass accumulation and P uptake, with total biomass and P content roughly increasing 10- and 80-fold, respectively. In the mineral substrate, plant growth was extremely limited at the low P level, as derived from extremely small biomass and the high root/shoot ratio in response to severe P deficiency stress. The average P content of 0.04 mg P/plant suggested that the plant P uptake from this substrate was negligible because it was almost as low as the average seed P content of 0.05 mg P/plant (data not shown). Data from the mineral substrate at the low P level was, therefore, excluded from further analysis of the genotypic variation in PAE and RE. In the mixture and the organic substrates, the plants experienced moderate P deficiency stress, as derived from consistent root/shoot ratio and relatively small decrease (30–34%) in total biomass compared to the severely P-deficient mineral substrate (88% decrease). In this experiment, solution P concentration at the medium P level was confirmed to be adequate for the maximal growth. Going from medium P to high P level, biomass accumulation stagnated while P uptake kept increasing indicating luxury uptake (). Therefore, in a further comparison of genotype performance related to P uptake and RE, we focused on the low P (P deficiency) and the medium P (optimal P) levels. The shoot P data from the low P mineral substrate and three high P substrates is available in Table S1 (Supplementary information).
Figure 1. Overview of the plant response to three P levels in three substrates. Bar plots represent the mean value of biomass (upper) and total P content (lower) with standard error of six genotypes within each substrate × P treatment (n = 3). The biomass is divided into shoot (meshed) and root (solid). ***, p < 0.001; **, p < 0.01; *, p < 0.05; ns, p > 0.05, in the effect of genotype (G), P level (P), substrate (S) and their interactions on total biomass, root/shoot ratio (R/S) and total P content. Substrates were prepared to have a range of SOC content as: mineral, low SOC (3%); mixture, medium SOC (7%); organic, high SOC (14%). P levels were adjusted based on the target P concentration in the CaCl2 extracts as: low P, native soil P at <0.05 mg P/L; medium P, 0.1 mg P/L; high P, 1 mg P/L
3.3. Effect of the organic P fraction on the genotypic ranking of PAE and RE
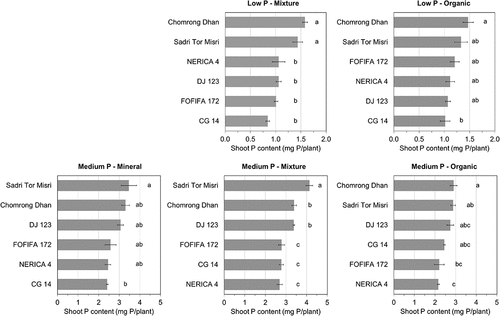
A significant genotypic variation in the shoot P content (mg P/plant) was observed in all substrates at both P levels (). At the medium P level, all genotypes experienced lower P uptake in the organic substrate compared to the other substrates. The multiple regression model for shoot P content showed a negative effect of the organic P fraction and a positive effect of its interaction with the total P, suggesting that the shoot P content was controlled by the P availability in the soil solution (). A significant effect of the genotype on P uptake was also found () whereas the difference in the organic P fraction did not affect the genotypic ranking of shoot P content (). This suggests little genotypic effects on the utilization of organic P. Chomrong Dhan and Sadri Tor Misri were among the best genotypes in terms of both P uptake potential (i.e. P uptake at the medium P level) and PAE (i.e. P uptake at the low P level), while CG 14 was among the lowest (). Chomrong Dhan also showed high relative shoot P content at the low P level compared to the medium P level in both substrates (). NERICA 4 and FOFIFA 172 (i.e. modern varieties) showed high relative shoot P content in the organic substrate at low P supply but the P uptake potential of these genotypes was among the lowest compared to the others.
Table 3. Parameter estimates and probability significance of the multivariate regression coefficients of the shoot P content and the root P uptake efficiency for six genotypes in three substrates at two P levels (i.e. the low and the medium P levels). Note that values from the mineral substrate at low P level were removed from this model due to no detectable P uptake, and all values from the high P level were also excluded due to high P supply exceeding plant requirement. Total model R2 is 0.88 for shoot P content and 0.78 for RE
Figure 2. Comparison of mean shoot P content of six genotypes in three substrates at the low P and the medium P levels. Error bar indicates standard error of mean shoot P content of genotypes within each substrate × P treatment (n = 3). Same alphabet indicates no significant difference among genotypes within each substrate × P treatment (Tukey’s HSD, p > 0.05). Genotypes are ordered from the highest (top) to the lowest mean value (bottom) for each substrate × P treatment. Substrates were prepared to have a range of SOC content as: mineral, low SOC (3%); mixture, medium SOC (7%); organic, high SOC (14%). P levels were adjusted based on the target P concentration in the CaCl2 extracts as: low P, native substrate P at <0.05 mg P/L; medium P, 0.1 mg P/L; high P, 1 mg P/L. Note that values from the mineral substrate at low P level were removed from this figure due to no detectable P uptake, and all values from the high P level were also excluded due to high P supply exceeding plant requirement
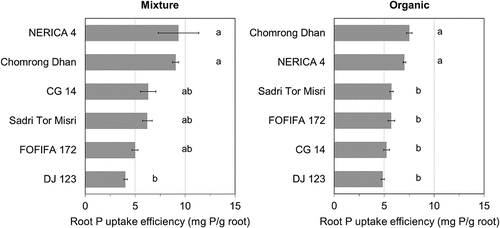
There were significant genotypic effects on RE in the organic and the mixture substrate at the low P level (). A poor correlation was observed between PAE and root biomass in both substrates (R2 = 0.004–0.01, data not shown). This may indicate that the genotypic performance in RE was not only reflecting the difference in root size but also the other factors e.g. plant capacity to use organic P in the substrate solution. However, the multiple regression model for RE revealed the similar trend as in shoot P content (). The total soluble P and its organic P fraction in soil explained 60% of the variation in RE, and adding the genotype increased that to 73%; however, adding the interaction between genotype and organic P fraction only increased that to 78% of the variation (details not shown). This illustrates that the effect of genotypes is only very poorly related to the different use of organic P in the soil solution. In both substrates, Chomrong Dhan and NERICA 4 showed high RE (). There was no effect of genotype on potential rhizosphere phosphatase activity, i.e. the tested genotypes showed a similar level of potential phosphatase activity in the rhizosphere soil, regardless of substrates (). A higher phosphatase activity was found in the rhizosphere than in the bulk soil for the mixture substrate only (Dunnett’s test, p < 0.01). This was possibly due to a large within-replicate variation in the organic substrate, because no significant difference was found between the mixture and the organic substrate in both rhizosphere and bulk substrate samples (p > 0.05; data not shown). No correlation was observed between RE and the rhizosphere phosphatase activity (Figure S2, supporting information).
Table 4. Comparison of six genotypes for mean acid phosphatase activity in the rhizosphere and bulk substrates at the low P level (i.e. native substrate P: <0.05 mg P/L in CaCl2 extracts). Standard deviation is indicated after mean values (n = 3 for the rhizosphere substrate of each genotype, and n = 3 for each of the bulk substrate). *** = p < 0.001; ** = p < 0.01; * = p < 0.05; ns = p > 0.05, for the variation in phosphatase activity among either genotypes (upper) or between rhizosphere and bulk substrates (lower). Substrates were prepared to have a range of SOC content as: mineral, low SOC (3%); mixture, medium SOC (7%); organic, high SOC (14%). Note that the mineral substrate was not included due to no detectable P uptake
Figure 3. Comparison of mean root P uptake efficiency (RE) of six genotypes in the mixture and the organic substrate at the low P level (i.e. native substrate P at <0.05 mg P/L in CaCl2 extracts). Error bars indicate standard error of mean RE of genotypes within each substrate × P treatment (n = 3). Same alphabet indicates no significant difference among genotypes within each substrate × P treatment (Tukey’s HSD, p > 0.05). Genotypes are ordered from the highest (top) to the lowest mean value (bottom) for each substrate × P treatment. Substrates were prepared to have a range of SOC content as: mineral, low SOC (3%); mixture, medium SOC (7%); organic, high SOC (14%). Note that values from the mineral substrate at low P level were removed from this figure due to no detectable P uptake
4. Discussion
4.1. Effect of soil organic P fraction on the genotypic variation of upland rice in RE in acid soil
Our model system did not achieve consistent P concentrations across the substrates at the low P level, because of extreme P deficiency of the mineral substrate (). This problem constrained the complete establishment of a gradation of organic P fractions at the low P level. Nevertheless, the remaining substrates achieved two distinct levels of organic P fraction size and hence allowed the comparison of the effect of organic P utilization on rice PAE and RE. At the low P level, the use of peat soil achieved a two-fold difference in organic P supply compared to the other substrates in the absence of plants as intended (). Higher P mineralization was observed in this peat soil, possibly due to the enhanced organic matter mineralization in the peat soil at the aerobic condition of this experiment (Qiu and McComb Citation1994) and microbial cell lysis after air-drying and re-wetting of the peat soil upon pre-incubation (Turner et al. Citation2003).
In our system, no P uptake was observed in the low P mineral substrate despite its reasonable level of total P (, ). In this type of soils, the presence of Fe/Al (hydr-)oxides controls P availability for rice plants by its strong binding with P, giving it strong protection from mobilization to become plant-available (Nishigaki et al. Citation2019). The obtained results support our assumption that rice plants have limited capacity to draw P from sparingly available P in highly weathered, acid soils without any amendment, as also suggested by some authors (Rose et al. Citation2013; Wissuwa, Gonzalez, and Watts-Williams Citation2020; De Bauw et al. Citation2020).
In both of the mixture and organic substrates, genotypes showed roughly two-fold variation in PAE as well as RE ( and ). The variation in PAE was not explained by the genotypic capacity to maintain larger root size to explore for plant-available P in the substrate, supporting the observations by Mori et al. (Citation2016) and Wissuwa, Gonzalez, and Watts-Williams (Citation2020) at medium P deficiency level. In their studies, the variation in RE was not completely explained by the difference of either root hair development or arbuscular mycorrhizal colonization (Nestler and Wissuwa Citation2016; Wissuwa, Gonzalez, and Watts-Williams Citation2020), suggesting other P-mining mechanisms involved. We hypothesized that the fraction of organic P in the substrate CaCl2 extract changes the genotypic ranking in PAE as well as RE because some genotypes may possess higher capacity to utilize the soil organic P pool at the low P availability. However, the organic P fractions in the two substrates neither affected PAE nor RE and genotypic ranking was consistent between the two substrates; the multiple regression model confirmed this lack of strong genotypic effect on organic P utilization (, and ). The organic P pool was specifically considered as labile organic P which does not require unrealistically high secretion of organic anions to break protection of metal-organic-P complexes but still requires hydrolyzing agents before P uptake. Hedley, Kirk, and Santos (Citation1994) observed that 6-week-old rice seedlings increased potential phosphatase activity at the rhizoplane, while the organic P (i.e. NaOH-PO) fraction was unaffected. Their conclusion on rice organic P utilization was hampered by the extremely severe P deficiency limiting plant P uptake to almost solely from seed P. Little genotypic variation in rhizosphere phosphatase activity () and the lack of relationship with the variation of RE (Figure S2) suggested that the tested rice genotypes had a similar potential to utilize organic P, with plant-microbial interactions as well as phosphatase-soil interactions taken into account. Taken together, the rice genotypes tested here were likely to take up a similar amount of P from soil organic P fraction, both in terms of potential and actual capacity in organic P mineralization. Little difference between the rhizosphere and the bulk substrate suggests that their organic P mineralization capacity was also very low (). This result is in line with the recent observation by Rakotoson, Holz, and Wissuwa (Citation2020), using three rice genotypes with contrasting PAE.
A limitation is that this study was still based on a small number of tested genotypes; i.e. the obtained results may have merely attributed to the lack of (existing) genotypes with higher capacity. A limited number of studies suggests the existence of such genotypes (Li et al. Citation2008; Alogaidi, Citation2013), although the difference in soil conditions should be taken into account as further discussed in the following subsection. The interpretation of this study is also limited to the early growth stage (i.e. 21 days). Since rhizosphere soil is greatly affected by rhizodeposition, the rhizosphere soil enzyme activity logically varies with plant growth stage, which affects both quality and quantity of root exudates (Ma et al. Citation2018). A general increase of enzyme activity during the vegetative stage has been observed for a number of crop species, as corresponding to the temporal dynamics of root exudation (Ma et al. Citation2018). For rice, Ge et al. (Citation2017) observed an increased activity of acid phosphatase during 30 days of growth. This result implies higher importance of organic P utilization at later growth stage of rice. This study hence leaves an opportunity for further research to test larger panel of rice genotypes before excluding organic P utilization from breeding target.
4.2. Potential effect of soil acidity on organic P utilization and RE of genotypes
Our study targeted acid soils (i.e. pH <5.5), where the interactions between P deficiency and soil acidity affects plant growth. We deliberately limed the soil only weakly for reflecting the field relevance. At this level of soil acidity (i.e. pH 4.5), acidity stresses (especially aluminum (Al) toxicity) was likely to affect rice PAE and RE by inhibiting root growth, reducing uptake of water and hence PI(Shavrukov and Hirai, Citation2016). Compared to the mixture substrate, higher PI in the organic substrate did not lead to higher plant biomass or P uptake at both low P and optimal P levels (, ). Moreover, the obtained genotypic ranking of PAE and/or RE for some tested genotypes considerably differed from previous studies (Koide et al. Citation2013; Saito et al. Citation2015; Mori et al. Citation2016; Wissuwa, Gonzalez, and Watts-Williams Citation2020), all of which tested at pH >5.0. In our study, DJ 123, CG 14 and Sadri Tor Misri were identified as less efficient varieties in both PAE and RE ( and ), while these genotypes consistently showed high PAE in the previous studies on various soil types. Especially DJ 123 showed high RE in andosols that are rich in organic P (Mori et al. Citation2016; Wissuwa, Gonzalez, and Watts-Williams Citation2020). De Bauw et al. (Citation2020) recently demonstrated that the differences in Al tolerance of upland rice genotypes could explain genotypic variation in response to farmyard manure application in highly weathered, acid soils. In our system, the effect of soil acidity on plant P uptake may have preceded the potential effect of organic P utilization.
To confirm that the tolerance to soil acidity may explain genotypic variation in PAE and RE, five rice genotypes (except for Sadri Tor Misri because of seed shortage) were further tested for the acidity tolerance by testing root elongation in the mineral soil that was either unlimed (i.e. pH 4.3) or limed to optimal levels (i.e. pH 5.5, 5.9, 6.3; Table S2, supporting information). The detailed experimental settings of this test can be found in the supporting information. The root length of the genotypes were reduced by 20–40% in the most acid soils compared to the optimal ones (Table S2). This test showed that the acid soil tolerance ranked FOFIFA 173> FOFIFA 172> Chomrong Dhan> CG 14> DJ 123> NERICA 4. Hence, this revealed the tendency of low to intermediate tolerance of tropical varieties versus high tolerance of Malagasy highland varieties. The obtained acidity tolerance ranking does not fully correspond to the PAE ranking; however, this may explain high performance of Chomrong Dhan and the low performance of DJ 123 in our system ( and ). The latter genotype was previously identified as high RE genotype with better root hair length and density in a P-deficient andosol that was not extremely acid, i.e. pH 5.7 (Nestler and Wissuwa Citation2016). These root hair traits were likely not advantageous in the acid soil as root hairs are highly sensitive to acidity stresses including both Al3+ and H+ toxicity (Shavrukov and Hirai, Citation2016). In line with the findings of De Bauw et al. (Citation2020), our study highlights the importance of acidity stresses in the genotypic comparison of P deficiency tolerance.
Supplemental Material
Download MS Word (433.5 KB)Acknowledgments
We would like to thank all the technical staffs and colleagues of the Division of Soil and Water Management at KU Leuven, for the extensive support during the experiment from set-up to data collection. We would like to thank Mr. Kristof Vanoirbeek from Centre for Food and Microbial Technology at KU Leuven, for the support during the phosphatase assay. We would like to thank Dr. Tobias Ceulemans for his support in the selection of the collection site of the peat soil used in this study.
Disclosure statement
The authors declare that there is no conflict of interest.
Supplementary material
Supplemental data for this article can be accessed here.
Additional information
Funding
References
- Alogaidi, F., and F. Mohammed. 2013. “Understanding Rice and Soil Phosphorus Interactions with an Emphasis on Rice Genetics and Soil Microbes.” Ph.D., University of Aberdeen. http://digitool.abdn.ac.uk:80/webclient/DeliveryManager?pid=203870.
- Benton Jones, J., Jr., and C. Vernon W. 1990. “Sampling, Handling, and Analyzing Plant Tissue Samples.” In Soil Testing and Plant Analysis, edited by R. L. Westerman, 389–428. 3rd ed. Madison, Wisconsin, USA: Soil Science Society of America.
- Celi, L., and E. Barberis. 2004. “Abiotic Stabilization of Organic Phosphorus in the Environment.” In Organic Phosphorus in the Environment, edited by B. L. Turner, E. Frossard, and D. S. Baldwin, 113–132. 1st ed. ed. Wallingford: CAB Publishing.
- De Bauw, P., E. Shimamura, T. Rakotoson, A. Andriamananjara, M. Verbeeck, R. Merckx, and E. Smolders. 2020. “Farm Yard Manure Application Mitigates Aluminium Toxicity and Phosphorus Deficiency for Different Upland Rice Genotypes.” Journal of Agronomy and Crop Science 00: 1–15. doi:10.1111/jac.12436.
- DeForest, J. L. 2009. “The Influence of Time, Storage Temperature, and Substrate Age on Potential Soil Enzyme Activity in Acidic Forest Soils Using MUB-Linked Substrates and l-DOPA.” Soil Biology & Biochemistry 41 (6): 1180–1186. doi:10.1016/j.soilbio.2009.02.029.
- Gao, W., L. Lu, W. Qiu, C. Wang, and H. Shou. 2017. “OsPAP26 Encodes a Major Purple Acid Phosphatase and Regulates Phosphate Remobilization in Rice.” Plant & Cell Physiology 58 (5): 885–892. doi:10.1093/pcp/pcx041.
- Ge, Tida, Xiaomeng Wei, Bahar S. Razavi, Zhenke Zhu, Yajun Hu, Yakov Kuzyakov, Davey L. Jones, and Jinshui Wu. 2017. “Stability and Dynamics of Enzyme Activity Patterns in the Rice Rhizosphere: Effects of Plant Growth and Temperature.” Soil Biology and Biochemistry 113: 108–15. https://doi.org/10.1016/j.soilbio2017.06.005
- Gerke, J. 2015. “The Acquisition of Phosphate by Higher Plants: Effect of Carboxylate Release by the Roots. A Critical Review.” Journal of Plant Nutrition and Soil Science 178 (3): 351–364. doi:10.1002/jpln.201400590.
- Guedes, R. S., A. Melo, L. Vergütz, A. Rodríguez-Vila, E. F. Covelo, and A. R. Fernandes. 2016. “Adsorption and Desorption Kinetics and Phosphorus Hysteresis in Highly Weathered Soil by Stirred Flow Chamber Experiments.” Soil and Tillage Research 162: 46–54. doi:10.1016/j.still.2016.04.018.
- Haefele, S. M., A. Nelson, and R. J. Hijmans. 2014. “Soil Quality and Constraints in Global Rice Production.” Geoderma 235-236: 250–259. doi:10.1016/j.geoderma.2014.07.019.
- Hedley, M. J., G. J. R. Kirk, and M. B. Santos. 1994. “Phosphorus Efficiency and the Forms of Soil Phosphorus Utilized by Upland Rice Cultivars.” Plant and Soil 158 (1): 53–62. doi:10.1007/BF00007917.
- Houba, V. J. G., E. J. M. Temminghoff, G. A. Gaikhorst, and W. Van Vark. 2000. “Soil Analysis Procedures Using 0.01 M Calcium Chloride as Extraction Reagent.” Communications in Soil Science and Plant Analysis 31 (9–10): 1299–1396. doi:10.1080/00103620009370514.
- Houba, V. J. G., J. J. van der Lee, I. Novozamsky, and I. Walinga, eds. 1989. Soil and Plant Analysis, a Series of Syllabi Part 5 Soil Analysis Procedures. 5th ed. Wageningen: Wageningen Agricultural University, Department of Soil Science and Plant Nutrition.
- Hue, N. V., and R. L. Fox. 2010. “Predicting Plant Phosphorus Requirements for Hawaii Soils Using a Combination of Phosphorus Sorption Isotherms and Chemical Extraction Methods.” Communications in Soil Science and Plant Analysis 41 (2): 133–143. doi:10.1080/00103620903426949.
- IUSS Working Group WRB. 2015. “World Reference Base for Soil Resources 2014, Update 2015 International Soil Classification System for Naming Soils and Creating Legends for Soil Maps.” World Soil Resources Reports, No.106. Rome.
- Koide, Y., J. Pariasca Tanaka, T. Rose, A. Fukuo, K. Konisho, S. Yanagihara, Y. Fukuta, M. Wissuwa, and M. Yano. 2013. “QTLs for Phosphorus Deficiency Tolerance Detected in Upland NERICA Varieties.” Plant Breeding 132 (3): 259–265. doi:10.1111/pbr.12052.
- Li, Y.-F., A.-C. Luo, X.-H. Wei, and X.-G. YAO. 2008. “Changes in Phosphorus Fractions, PH, and Phosphatase Activity in Rhizosphere of Two Rice Genotypes.” Pedosphere 18 (6): 785–794. doi:10.1016/S1002-0160(08)60074-0.
- Lu, L., W. Qiu, W. Wenwen Gao, S. D. Tyerman, H. Shou, and C. Wang. 2016. “OsPAP10c, a novel secreted acid phosphatase in rice, plays an important role in the utilization of external organic phosphorus.” Plant, Cell & Environment 39 (10): 2247–2259. doi:10.1111/pce.12794.
- Ma, X., Y. Liu, M. Mohsen Zarebanadkouki, B. S. Razavi, E. Blagodatskaya, and Y. Kuzyakov. 2018. “Spatiotemporal Patterns of Enzyme Activities in the Rhizosphere: Effects of Plant Growth and Root Morphology.” Biology and Fertility of Soils 54 (7): 819–828. doi:10.1007/s00374-018-1305-6.
- Marx, M.-C., M. Wood, and S. C. Jarvis. 2001. “A Microplate Fluorimetric Assay for the Study of Enzyme Diversity in Soils.” Soil Biology & Biochemistry 33 (12–13): 1633–1640. doi:10.1016/S0038-0717(01)00079-7.
- Masso, C., G. Nziguheba, J. Mutegi, C. Galy-lacaux, J. Wendt, K. Butterbach-bahl, L. Wairegi, and A. Datta. 2017. “Soil Fertility Management in Sub-Saharan Africa.” In Vol. 25 of Sustainable Agriculture Reviews Volume, edited by E. Lichtfouse, 1st ed., 205–231. Cham, Switzerland: Springer International Publishing AG. 10.1007/978-3-319-58679-3.
- McLaren, T. I., R. J. Smernik, M. J. McLaughlin, T. M. McBeath, J. K. Kirby, R. J. Simpson, C. N. Guppy, A. L. Doolette, and A. E. Richardson. 2015. “Complex Forms of Soil Organic Phosphorus–A Major Component of Soil Phosphorus.” Environmental Science & Technology 49 (22): 13238–13245. doi:10.1021/acs.est.5b02948.
- Mehra, P., B. K. Pandey, and J. Giri. 2017. “Improvement in Phosphate Acquisition and Utilization by a Secretory Purple Acid Phosphatase (Ospap21b) in Rice.” Plant Biotechnology Journal 15 (8): 1054–1067. doi:10.1111/pbi.12699.
- Mori, A., T. Fukuda, P. Vejchasarn, J. Nestler, J. Pariasca-Tanaka, and M. Wissuwa. 2016. “The Role of Root Size versus Root Efficiency in Phosphorus Acquisition in Rice.” Journal of Experimental Botany 67 (4): 1179–1189. doi:10.1093/jxb/erv557.
- Nestler, J., and M. Wissuwa. 2016. “Superior Root Hair Formation Confers Root Efficiency in Some, but Not All, Rice Genotypes upon P Deficiency.” Frontiers in Plant Science 7: 1935. doi:10.3389/fpls.2016.01935.
- Nishigaki, T., Y. Tsujimoto, S. Rinasoa, T. Rakotoson, A. Andriamananjara, and T. Razafimbelo. 2019. “Phosphorus Uptake of Rice Plants Is Affected by Phosphorus Forms and Physicochemical Properties of Tropical Weathered Soils.” Plant and Soil 435 (1–2): 27–38. doi:10.1007/s11104-018-3869-1.
- Pariasca-Tanaka, J., K. Satoh, T. Rose, R. Mauleon, and M. Wissuwa. 2009. “Stress Response versus Stress Tolerance: A Transcriptome Analysis of Two Rice Lines Contrasting in Tolerance to Phosphorus Deficiency.” Rice 2 (4): 167–185. doi:10.1007/s12284-009-9032-0.
- Qiu, S., and A. J. McComb. 1994. “Effects of Oxygen Concentration on Phosphorus Release from Reflooded Air-Dried Wetland Sediments.” Australian Journal of Marine and Freshwater Research 45 (7): 1319–1328. doi:10.1071/MF9941319.
- Quiquampoix, H., and D. Mousain. 2004. “Enzymatic Hydrolysis of Organic Phosphorus.” In Organic Phosphorus in the Environment, edited by B. L. Turner, E. Frossard, and D. S. Baldwin, 113–132. 1st ed. Wallingford: CAB Publishing.
- Raboin, L.-M., T. Randriambololona, T. Radanielina, A. Ramanantsoanirina, N. Ahmadi, and J. Dusserre. 2014. “Upland Rice Varieties for Smallholder Farming in the Cold Conditions in Madagascar’s Tropical Highlands.” Field Crops Research 169: 11–20. Dec.. doi:10.1016/j.fcr.2014.09.006.
- Rakotoson, T., M. Holz, and M. Wissuwa. 2020. “Phosphorus Deficiency Tolerance in Oryza Sativa: Root and Rhizosphere Traits.” Rhizosphere 14: 28–30. Mar.. doi:10.1016/j.rhisph.2020.100198.
- Richardson, A. E., J. P. Lynch, P. R. Ryan, E. Delhaize, F. A. Smith, S. E. Smith, P. R. Harvey, et al. 2011. “Plant and Microbial Strategies to Improve the Phosphorus Efficiency of Agriculture.” Plant and Soil 349 ((1–2)): 121–156. doi:10.1007/s11104-011-0950-4.
- Rose, T. J., S. M. Impa, M. T. Rose, J. Pariasca-Tanaka, A. Mori, S. Heuer, S. E. Johnson-Beebout, and M. Wissuwa. 2013. “Enhancing Phosphorus and Zinc Acquisition Efficiency in Rice: A Critical Review of Root Traits and Their Potential Utility in Rice Breeding.” Annals of Botany 112 (2): 331–345. doi:10.1093/aob/mcs217.
- Saito, K., E. Vandamme, Z. Segda, M. Fofana, and K. Ahouanton. 2015. “A Screening Protocol for Vegetative-Stage Tolerance to Phosphorus Deficiency in Upland Rice.” Crop Science 55 (3): 1223–1229. doi:10.2135/cropsci2014.07.0521.
- Sanchez, P. A., K. D. Shepherd, M. J. Soule, F. M. Place, R. J. Buresh, A.-M. N. Izac, A. Uzo Mokwunye, F. R. Kwesiga, C. G. Ndiritu, and P. L. Woomer. 1997. Soil Fertility Replenishment in Africa: An Investment in Natural Resource Capital. In Replenishing Soil Fertility in Africa, edited by R. J. Buresh, P. A. Sanchez, and F. Calhoun, 1–46. SSSA Special Publication 51. Madison: Soil Science Society of America and American Society of Agronomy.
- Schwertmann, U. 1964. ““Differenzierung Der Eisenoxide Des Bodens Durch Extraktion Mit Ammoniumoxalat-Lösung”. [The Differentiation of Iron Oxides in Substrates by Extraction with Ammonium Oxalate Solution].” Zeitschrift für Pflanzenernährung, Düngung, Bodenkunde 105 (3): 194–202. doi:10.1002/jpln.3591050303.
- Shand, C. A., and S. Smith. 1997. “Enzymatic Release of Phosphate from Model Substrates and P Compounds in Soil Solution from a Peaty Podzol.” Biology and Fertility of Soils 24 (2): 183–187. doi:10.1007/s003740050229.
- Shavrukov, Y., and Y. Hirai. 2016. “Good and Bad Protons: Genetic Aspects of Acidity Stress Responses in Plants.” Journal of Experimental Botany 67 (1): 15–30. doi:10.1093/jxb/erv437.
- Six, L., E. Smolders, and R. Merckx. 2013. “The Performance of DGT versus Conventional Soil Phosphorus Tests in Tropical Soils—Maize and Rice Responses to P Application.” Plant and Soil 366 (1–2): 49–66. doi:10.1007/s11104-012-1375-4.
- Spohn, M., A. Ermak, and Y. Kuzyakov. 2013. “Microbial Gross Organic Phosphorus Mineralization Can Be Stimulated by Root Exudates – A 33P Isotopic Dilution Study.” Soil Biology & Biochemistry 65: 254–263. doi:10.1016/j.soilbio.2013.05.028.
- Turner, B. L. 2006. “Organic Phosphorus in Madagascan Rice Soils.” Geoderma 136 (1–2): 279–288. doi:10.1016/j.geoderma.2006.03.043.
- Turner, B. L., and A. B. Leytem. 2004. “Phosphorus Compounds in Sequential Extracts of Animal Manures: Chemical Speciation and a Novel Fractionation Procedure.” Environmental Science & Technology 38 (22): 6101–6108. doi:10.1021/es0493042.
- Turner, B. L., J. P. Driessen, P. M. Haygarth, and I. D. Mckelvie. 2003. “Potential Contribution of Lysed Bacterial Cells to Phosphorus Solubilisation in Two Rewetted Australian Pasture Soils.” Soil Biology & Biochemistry 35 (1): 187–189. doi:10.1016/S0038-0717(02)00244-4.
- Turner, B. L., and S. Newman. 2005. “Phosphorus Cycling in Wetland Soils: The Importance of Phosphate Diesters.” Journal of Environmental Quality 34 (5): 1921–1929. doi:10.2134/jeq2005.0060.
- Van Moorleghem, C. V., L. Six, F. Degryse, E. Smolders, and R. Merckx. 2011. “Effect of Organic P Forms and P Present in Inorganic Colloids on the Determination of Dissolved P in Environmental Samples by the Diffusive Gradient in Thin Films Technique, Ion Chromatography, and Colorimetry.” Analytical Chemistry 83 (13): 5317–5323. doi:10.1021/ac200748e.
- Van Veldhoven, P. P., and G. P. Mannaerts. 1987. “Inorganic and Organic Phosphate Measurements in the Nanomolar Range.” Analytical Biochemistry 161 (1): 45–48. doi:10.1016/0003-2697(87)90649-X.
- Vandamme, E., T. Rose, K. Saito, K. Jeong, and M. Wissuwa. 2016. “Integration of P Acquisition Efficiency, P Utilization Efficiency and Low Grain P Concentrations into P-Efficient Rice Genotypes for Specific Target Environments.” Nutrient Cycling in Agroecosystems 104 (3): 413–427. doi:10.1007/s10705-015-9716-3.
- Veneklaas, E. J., J. Jason Stevens, G. R. Cawthray, S. Turner, A. A. M. Grigg, and H. Lambers. 2003. “Chickpea and White Lupin Rhizosphere Carboxylates Vary with Soil Properties and Enhance Phosphorus Uptake.” Plant and Soil 248 (1/2): 187–197. doi:10.1023/A:1022367312851.
- Wissuwa, M. 2003. “How Do Plants Achieve Tolerance to Phosphorus Deficiency? Small Causes with Big Effects.” Plant Physiology 133 (4): 1947–1958. doi:10.1104/pp.103.029306.
- Wissuwa, M., D. Gonzalez, and S. J. Watts-Williams. 2020. “The Contribution of Plant Traits and Soil Microbes to Phosphorus Uptake from Low-Phosphorus Soil in Upland Rice Varieties.” Plant and Soil 448 (1–2): 523–537. doi:10.1007/s11104-020-04453-z.
- Wissuwa, M., and N. Ae. 2001. “Genotypic Variation for Tolerance to Phosphorus Deficiency in Rice and the Potential for Its Exploitation in Rice Improvement.” Plant Breeding 120 (1): 43–48. doi:10.1046/j.1439-0523.2001.00561.x.