
ABSTRACT
Precise use of fertilizers has been a focal point in world agriculture for years because it increases crop production and reduces the negative impact of over-fertilization. Smart fertilizer management using information/data, sensors, and smart tools allows correct fertilization in precision agriculture, smart agriculture, and integrated nutrient management. Recent progress in prediction methods, such as hyperspectral imaging with machine learning, supports accurate N fertilization. In contrast, damage caused by the deficiency of several nutrients, such as Fe, K, and N, can be accurately identified by red, green, and blue (RGB) images. Current imaging technologies cannot cover all nutrients, but it has been proposed that nutrient biomarkers could be able to quantitatively predict the status of a particular nutrient with high specificity. This review presents an overview of the current approaches to plant phenotyping by imaging/sensor- and plant biomarker-technologies, and to soil analysis by imaging/sensor technologies for smart fertilizer management.
1. Introduction
High-input agricultural production by high-yielding crops requires a drastic increase in fertilizer use (Roberts and Mattoo Citation2018; Timsina Citation2018). In fact, the current world agricultural production includes the use of large quantities of fertilizers in most commercial crops, mainly nitrogen (N), phosphorus (P), and potassium (K). A study entitled ‘World fertilizer trends and outlook to 2020’ (FAO Citation2017) reported that the global demand for fertilizer nutrients by the end of 2020 (201.66 million tons) was about 10% higher than that in 2016. Reduction/optimization of fertilizer input would be an essential step in the agricultural sector which would allow the crop producers to manage fertilizer use more precisely and to improve productivity and sustainability.
In this context, smart fertilization, utilizing the Internet of Things (IoT) and other information and sensing tools is an important concept in current agricultural production (Sun et al. Citation2020). It is a part of a wider concept called ‘smart agriculture’ which encourages the use of information technologies and robotics (https://www.maff.go.jp/e/policies/tech_res/smaagri/robot.html) or sensors and IoT tools in agricultural practice (Walter et al. Citation2017; Lavanya, Rani, and Ganeshkumar Citation2019). In fact, precision agriculture (PA), which has been adopted by 40% of farms in the USA (Hellerstein et al. Citation2019), introduces optimized fertilization with smart tools in order to reduce production costs and increase plant yield. In turn, it reduces the environmental cost of fertilizer use because it saves energy and raw materials required for processing fertilizers, and it protects the environment from pollution by over-fertilization (Bacenetti et al. Citation2020). In addition, optimized fertilizer management can improve the quality of crops, which can decrease as a consequence of over-fertilization. The quality of olive oil was found to decrease because of N over-fertilization (Erel et al. Citation2013), and that of tomato fruits decreased because of P over-fertilization (Nowaki et al. Citation2017).
Smart N fertilization has been adopted on farms that use PA, where farmers try to supply fertilizers by implementing the correct treatment in the right place at the right time (Pierce and Nowak Citation1999; Robert Citation2002). Recently site-specific N management in PA is supported by the ‘newly-developed technologies’, such as global positioning systems (GPS) and geographic information systems (GIS) developed in the 1990s (Stafford Citation2000), which enabled customized fertilization management for small areas within fields instead of managing whole fields as a single unit (Rogovska et al. Citation2019) in order to increase nitrogen use efficiency. In fact, smart N fertilization is an important target in PA (Hellerstein et al. Citation2019). PA has also employed remote sensing, sensors, and cameras to evaluate the nutrient status in soils and plants for predicting optimal fertilizer levels. This was achieved by continuous development of sensing/imaging tools (e.g., hyperspectral cameras) and methods of image analysis (e.g., machine learning), which further allowed more precise fertilization. PA originally involves fertilizer management for the reduction of production costs and for the increase in plant yield (Bacenetti et al. Citation2020).
The development of reliable procedures for smart N fertilization is related to several factors. The N status of crop plants correlates with their capacity for photosynthesis, which is well correlated with their growth/yield (Makino Citation2003). In contrast, as a major component of photosynthesis, the content of chlorophyll can be predicted by imaging (Wang et al. Citation2019). To date, such relationships between nutrient status and some detectable indexes have been studied for other nutrients. In this review, we summarized the current progress of fertilizer management in PA, mostly related to N fertilizers, and we discussed various technologies that monitor the status of other nutrients in plants and soil.
2. Smart N fertilizer management by remote sensing
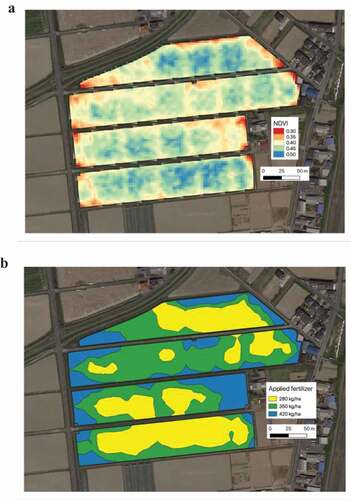
Currently, for the decision-making process, PA utilizes GIS data and plant/soil parameters obtained through remote sensing and other analyses. For example, several developed countries, such as Sweden, the USA, Australia, and Canada, have implemented national projects to map the soil properties, including organic matter content and other chemical soil properties, in different regions using GIS (Say et al. Citation2018), for the development of soil management protocols (Söderström et al. Citation2016). On the other hand, vegetation indices (VIs), which are generated from multi-spectral data, allow the evaluation of crop growth and N status (Osco et al. Citation2019a). The combination of these information allows the control of a variable-rate applicator (VRA) equipped with a GPS-positioned tractor, which accurately conducts N fertilization at the right positions (). This can be achieved because of the increased resolution of GPS and satellite images, while it is also related to the development of cameras, sensors, and imaging methods (Maes and Steppe Citation2019).
Figure 1. Example of normalized difference vegetation index (NDVI)-based site specific fertilizer management. NDVI-map can be generated using the planet satellite imagery for the field growing crops (https://www.planet.com/) (A). Blue color indicates high NDVI, while red color indicates low NDVI value. According to the NDVI-value, fertilizer level was decided at 280 (yellow), 350 (green) and 420 (blue) Kg/ha (B). Images were taken from wheat field (Kaizu, Gifu, Japan) for designing for variable-rate fertilizer application
At the early stage of satellite imaging, natural plant habitation was monitored by VIs, which were transformed from the spectral reflectance of red and near-infrared (NIR) (Lloyd Citation1990). The red/infrared ratio is based on the fact that healthy vegetation reflects more NIR than red light (Herrero et al. Citation2020), which is partially explained by the difference in the amount of chlorophyll between healthy vegetation and stressed vegetation (Fillella and Penuelas Citation1994; Gitelson, Gritz, and Merzlyak Citation2003). Several VIs (using different formulas and different wavelengths) have been proposed for modeling plant growth capacity, yield, and N status. Among the various VIs, the normalized difference vegetation index (NDVI) is the most popular VI which is extensively used to determine the N status of crops in PA (Padilla et al. Citation2015; Stefanini et al. Citation2019). NDVI is calculated as NDVI = (NIR-Red)/(NIR + Red), and it can well describe the variation in chlorophyll content and thus in the crop N status (Vizzari, Santaga, and Benincasa Citation2019). Chlorophyll fluorescence [spectral emission ranges approximately 650–800 nm in intact leaves with two maxima (under normal ambient temperatures): one in the red spectral region around 685–690 nm (F685) and the other in the far-red spectral region around 730–740 nm (F740); Mohammed et al. 2019] driven by solar or laser radiation, which allows the evaluation of chlorophyll contents more accurately than VIs, has recently been used for the determination of crop N status (Yang et al. Citation2018; Mohammed et al. Citation2019). Continuous development of imaging technologies, which include unmanned aerial vehicles (UAVs; Liu et al. Citation2018; Osco et al. Citation2019b; Yang et al. Citation2020), hyperspectral data (camera/sensor; see next section for details on hyperspectral imaging, HSI), and data analysis (e.g., machine learning, ML; Tantalaki, Souravlas, and Roumeliotis Citation2019), allow more precise N fertilizer management. Several new VIs have been proposed by the data mining of HSI, which allow the prediction of the N content in crops other than well-studied grain crops, for example in spinach, (Corti et al. Citation2017), citrus species, (Liu et al. Citation2015) and cucumber (Ji-Yong et al. Citation2012) ().
Table 1. Evaluation of nutrients status and content in crops by imaging techniques
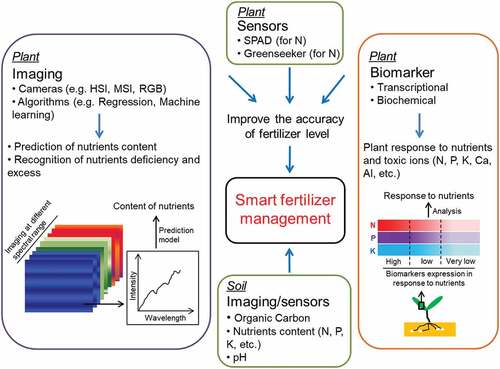
The N status of crops (i.e., endogenous N level that supports physiological processes such as photosynthesis), which is associated with plant growth and yield, is more useful than tissue N content for efficient N management. In order to improve the accuracy of N status prediction, multispectral imaging (MSI) is combined with data obtained by other methods, such as HSI, visible red, green, and blue (RGB) images, and data obtained by sensors (). Portable sensors that estimate the amount of chlorophyll and N status are currently used at farming sites (Cardim Ferreira Lima et al. Citation2020). Two nondestructive sensors have been widely adopted for measuring the plant N status, namely soil plant analysis development (SPAD; chlorophyll absorbance assessed by transmission of red light at 650 nm; Xiong et al. Citation2015) and GreenSeeker (red and near-infrared reflectance; Cao et al. Citation2015). These sensors can easily obtain proximal data at farming sites and can be combined with remote sensing data. This integration sometimes improves the effectiveness of the N fertilization model (Á, Lloveras, and Martínez-Casasnovas Citation2018). For phenotyping major cereal crops in the field, it is important to develop airborne images using UAVs (e.g., drones) with various prediction models (Maes and Steppe Citation2019). Recently, Maimaitijiang et al. (Citation2017) integrated different types of cameras and sensors on the same drone to obtain the most accurate and efficient combination of data for accurate estimation of plant traits with the goal of stress assessment. These types of studies can promote the development of models for combined estimation of grain yields and economic returns (Á, Lloveras, and Martínez-Casasnovas Citation2018).
Figure 2. Diagrammatic representation of smart fertilizer management. Smart fertilizer management utilizes imaging, sensors, and biomarkers to phenotype the nutrient status in plants and soils. HSI, hyperspectral imaging; MSI, multispectral imaging; RGB, red-green-blue; SPAD, soil plant analysis development
Recently, RGB imaging has been used to predict the N status of crops in field conditions, including barley (Pagola et al. Citation2009), rice (Lee and Lee Citation2013), wheat (Li et al. Citation2010), and cotton (Jia et al. Citation2014) (). Some of these studies utilized on-ground sensors (e.g., reflectance sensors) with air-born images to improve the accuracy of the prediction model (Elsayed, Barmeier, and Schmidhalter Citation2018).
3. Phenotyping of other nutrient status and content by imaging and sensor technologies
Numerous studies have been carried out to investigate how imaging and sensor technology can be used to improve the management of fertilizers other than N (Mulla Citation2013). This section focuses on the combination of imaging and sensor technology for the analysis of crop and soil nutrient status with the goal of smart fertilizer management.
3.1. Plants nutrients phenotyping by imaging and sensor technologies
MSI, which includes two or three wavelengths (e.g., red and NIR), is quite useful for evaluating the N status in plants (Geipel et al. Citation2016; Zheng et al. Citation2018; Lu et al. Citation2019; Shendryk et al. Citation2020) (), but is not useful for evaluating the status of other nutrients. Recent progress in HSI and imaging analysis methods has made it possible to predict the N status along with other nutrients. HSI data, which are obtained by spectral ranging with narrow intervals (e.g., 1 or 10 nm), can be transformed into radiometric quantities, such as reflectance, absorbance, and transmittance, which can be further correlated to physiological variables such as the content of water, fat, protein, and other carbon-hydrogen-oxygen bonded constituents (Mahesh et al. Citation2015).
HSI technology usually uses the light reflected from objects to detect their constituents (Kamruzzaman and Sun Citation2016). The intensities of certain precise spectral bands can be utilized if they are associated with nutrient content (e.g., Yu et al. Citation2014). Recent progress in data analysis methods allows the utilization of HSI data for predicting the status of various nutrients. Different algorithms, including statistical methods such as multiple linear regression (MLR; Ji-Yong et al. Citation2012; Bruning et al. Citation2019; Ye, Abe, and Zhang Citation2020) and machine learning methods such as neural networks (Wiegmann et al. Citation2019; Patrício and Rieder Citation2018) and random forest (Bruning et al. Citation2019), have been used for identifying certain wavelengths used for the prediction of the content of each nutrient. HSI has been intensively used for the prediction of various nutrients content along with N content and status in various crops (e.g., Moharana and Dutta Citation2016; Corti et al. Citation2017; Pandey et al. Citation2017; Yu, Lu, and Liu Citation2018; Banerjee et al. Citation2020) (), which was not well studied using MSI.
Using HSI, Borhan et al. (Citation2017) predicted the N content in potato, and Liu et al. (Citation2015) predicted P contents along with N in citrus leaves. The contents of several nutrients can be predicted by HSI data mining, but this prediction would be less accurate than that of N. Pandey et al. (Citation2017) predicted N, P, and K contents in soybean and maize using HSI. The model developed for predicting N contents was accurate (R2 by PLSR > 0.95), but those developed for predicting P and K contents were less accurate (R2 by PLSR <0.7). The authors concluded that further improvement of the prediction of P and K content, such as integration of other sensing methods, would be necessary for optimal P and K management.
Visible RGB images obtained by regular cameras have been utilized to predict the nutrients status of crops, including their N status and deficiencies of several nutrients (Pagola et al. Citation2009; Li et al. Citation2010; Mercado-Luna et al. Citation2010; Yao and Luo Citation2012) (). Digital cameras are a simple source of RGB images, which are widely used for plant phenotyping (Jia et al. Citation2014). The progress of phenotyping by RGB is supported by the improvement of camera and image analysis methods, which can predict the N status (e.g., using linear regression, Tewari et al. Citation2013, or using the support vector machine, Lisu, Yuanyuan, and Ke Citation2017). In addition, RGB imaging using regular cameras (e.g., smart phones) along with IoT could be useful in smart fertilizer management (Patil, Adamuthe, and Umbarkar Citation2018). Several studies have shown that RGB imaging can be useful for identifying plants damage caused by several nutrient deficiencies. For example, Ghosal et al. (Citation2018) provided an explanatory deep-learning method that was able to accurately classify soybean leaf damage using RGB imaging, enabling Fe and K deficiency to be differentiated from other tested damages. This method would be useful for phenotyping nutrient deficiencies that occur in low-input agriculture systems. In the past several decades, the Indian government introduced integrated nutrient management (INM) to increase agricultural production, which can enhance production in low-input agriculture systems (http://agricoop.nic.in/divisiontype/integrated-nutrient-management). INM utilizes chemical, organic, and free-living microbes, such as plant growth-promoting rhizobacteria or arbuscular mycorrhizal fungi, to obtain synergetic effects of multiple fertilizers (such as P and N) (Kurle and Pfleger Citation1994; Roesti et al. Citation2006; Khan and Zaidi Citation2007; Agrahari et al. Citation2020a). The avoidance of nutrient deficiency is an important technology for increasing the benefit of INM in low-input agriculture. Anami, Malvade, and Palaiah (Citation2020) recently succeeded in recognizing N, P, K, Mg, Fe, and Zn deficient spots in Indian rice paddy fields using RGB image analysis. This approach is important for establishing smart fertilization, particularly at the farms operating INM. Recently, studies have also successfully identified the cause of stress in plants based on plant morphological indicators (Olas, Fichtner, and Apelt Citation2020). For example, Zhang et al. (Citation2020) used a robust method (U-Net model for RGB image analysis) for purple rapeseed leaf segmentation, providing a new method for crop N stress monitoring. Recognition and discrimination between different stress factors that damage crops would help to rearrange the fertilization strategies for the subsequent harvest.
3.2. Soil nutrients phenotyping by imaging and sensor technologies
Quantitative evaluation of the N status of plants has almost been made available by imaging-based remote sensing and by several portable sensors (e.g., SPAD and GreenSeeker). In addition, high correlation between the N status and crop growth and yield compare to the other nutrients can help to develop a model to predict crops yield, therefore smart N fertilization has been more successful than smart fertilization with other nutrients.
The problem of less effective management of other nutrients could be solved by developing reliable and economical procedures that could estimate their status in soil and plants. Integrated management of digitized data of soil fertility and plant nutrient status is one approach for achieving this, but it has a high cost for setup nationwide digitized soil data. This is only available in certain countries, such as Sweden (Söderström et al. Citation2016) and the USA (Owens et al. Citation2020). In other countries, different procedures are required to evaluate soil properties, e.g., sensors (which can assess soil organic substances, moisture, color, nutrients, pH; Povh et al. Citation2014; Murray Citation2018), diagnostic kits (which can assess soil pH; Stevens, Dunn, and Phipps Citation2001), or imaging technologies (which can assess soil organic carbon; Hobley et al. Citation2018).
Sensor technology is based on electrical, electromagnetic, optical, radiometric, hydraulic, acoustic, pneumatic, and electrochemical principals and measurements, using which the sensors are capable real-time measurements of soil nutrients and pH, thereby supporting fertilization management (Adamchuk et al. Citation2018). Most recently, Erler et al. (Citation2020) developed a sensor that utilizes laser-induced breakdown spectroscopy with multivariate regression methods (i.e., least absolute shrinkage and selection operator regression), which enables in-field determination of the concentration of several soil nutrients (such as Ca, K, Mg, N, P, Mn, and Fe).
On the other hand, already developed HSI technology in the NIR range (NIR-HSI) provides the information that can predict soil nutrients accurately (Manley Citation2014). NIR-HSI utilizes electromagnetic radiation between 750 nm and 2500 nm, which is mainly absorbed by molecular bonds with highly harmonic vibrational modes, such as C-H, O-H, and N-H (Pasquini Citation2018) which are characteristic of soil organic matters (Araújo, Demattê, and Vicente Citation2014). Recently Pudełko et al. (Citation2020) compared the performance of NIR spectroscopy and NIR-HSI in predicting the organic carbon and total N contents in mine soils. They developed predictive models based on partial least square regression or artificial neural networks (ANN). They found that NIR-HSI based models had distinctly higher accuracy of organic carbon and total N content prediction than NIR spectroscopy. Swetha et al. (Citation2020) developed an RGB imaging method that can predict soil texture using a deep learning algorithm [convolutional neural network (CNN) model].The development of RGB-based soil imaging is in the beginning stage, but in the future, it could help to further improve soil nutrient status management using HSI and sensor-based technologies.
4. Biomarkers for smart fertilizer management
In smart fertilizer management, it is very important to evaluate the plant response to nutrients at the early stage of plant development. This can be done by developing sensitive procedures, such as biomarker assessment, which can evaluate plant nutrient status using physiological and molecular biological markers. The term ‘biomarker’ originates from the field of pre-clinical research and clinical diagnosis (Biomarkers Definitions Working Group Citation2001). For example, chlorophyll is a kind of biomarker that can predict the N status in plant leaves, suggesting that other biological molecules could be utilized as biomarkers in agricultural practice. Recently, several laboratory and field studies have been conducted to identify biomarkers for potential use in agriculture.
4.1. Transcriptional biomarkers
Transcriptional or RNA biomarkers, which could be defined as specific changes in gene expression toward particular factors (Sewall et al. Citation1995), are correlated with various nutrients. Although transcriptional biomarkers have some limitations in terms of cost and handling RNA samples, they have high specificity and robustness among a wide range of plant species (in terms of gene ontology; Ito et al. Citation2019; Agrahari et al. Citation2020b), as well as high reliability for diagnosing various plant conditions other than nutrient deficiencies. Hermans et al. (Citation2010) reported specific gene expression in the mature leaves of Arabidopsis thaliana under Mg deprivation, which was not affected by other mineral deficiencies (i.e., N, P, and K deficiencies) and environmental stresses (salt and drought stress) (). Recently, plant microRNA profiling revealed various miRNAs related to P deficiency and their specific expression under P-deficient and P-sufficient conditions (Zhao et al. Citation2013; Hackenberg et al. Citation2013; Bej and Basak Citation2014) (). These markers were not tested in field or pot soil experimental conditions, but several studies have identified certain biomarkers in field conditions.
Table 2. Biomarkers used for plant nutrients status analysis
Yang et al. (Citation2011) identified N-responsive transcriptional biomarkers using various maize genotypes grown under different N conditions, and they found several biomarker genes with N specificity and quantitative differences among various maize genotypes. N-biomarkers are robust among genotypes, and they could potentially serve as early N deficiency indicators for field-grown plants (). Takehisa and Sato (Citation2019) identified three gene sets for monitoring the N and P status of rice throughout its growth under field conditions. These gene sets were selected by large-scale co-expression gene network analysis from previous transcriptome data of rice plants under N, P, and K deficiencies in laboratory conditions (Takehisa et al. Citation2013, Citation2015).
Recently, based on model plant studies (Sawaki et al. Citation2016); another type of transcriptional biomarker which can quantitatively monitor aluminum toxicity in acid soil was established in soybean (Agrahari et al. Citation2020b). An ortholog of the Arabidopsis Al-specific gene ALUMINUM SENSITIVE 3 (ALS3; Sawaki et al. Citation2016) in soybean (GmALS3) was inducible in the shoots of plants grown in acid soil with insufficient CaCO3. The Al-inducible expression of GmALS3 was found to be robust among genotypes and highly specific to Al stress compared to other stresses. Along with soybean, other legumes showed Al-specific inducible expression of ALS3 orthologs in the shoots. This suggested that ALS3 orthologs can be utilized as potential transcriptional biomarkers for crops to determine the liming level (Al toxicity) in acidic soil.
4.2. Biochemical biomarkers
Nutrient deficiency in plants leads to changes that affect their metabolic pathways, resulting in major changes in particular metabolites (e.g., amino acids, organic acids, lipids, and sugars). Such metabolites act as biomarkers for nutrient deficiencies (Steinfath et al. Citation2010; Sung et al. Citation2015). Several signature metabolites have been identified as biochemical biomarkers for plant nutrient responses.
In plants, K deficiency strongly influences various metabolites, such as the accumulation of free putrescine, one of the polyamines that play a role in the replacement of K+ as an organic cation in K-deficient plants (Tachimoto et al. Citation1992). Putrescine in leaves is considered to be specific to severe K deficiency symptoms (Cui et al. Citation2020). Conversely, excess K causes a decrease in putrescine by converting it to higher molecular weight polyamines (i.e., spermine and spermidine; Aurisano et al. Citation1993; Reggiani et al. Citation1993) or it causes putrescine extrusion efflux from the cytoplasm of the roots into the external medium (Tamai et al. Citation2000). Thus, putrescine level is sensitive to external K and appears to be a good biomarker for K deficiency (). In contrast, the accumulation of free spermidine and spermine in plant leaves can be a biomarker for excess K (Geny et al. Citation1997).
Anthocyanin production is stimulated by prolonged P starvation in plants (Jiang et al. Citation2007; Xu, Weng, and Yang Citation2007). It protects the photosynthetic apparatus against photodamage and increases photosynthetic efficiency (Steyn et al. Citation2002; Henry et al. Citation2012). On the other hand, P starvation induces arrested primary root elongation and lateral root development. These changes in root architecture include the formation of starch granules in the columella cells of primary roots (Sack Citation1997; Sato and Miura Citation2011; Péret et al. Citation2011; Waidmann et al. Citation2019). The sensitivity to anthocyanin accumulation in the leaves and starch granules in the primary roots may act as a biomarker for P starvation in plants (Schachtman and Shin Citation2007; Wang et al. Citation2015) ().
Plants reduce their chlorophyll content in response to N deficiency (Coleman, Rosen, and Schwartzbach Citation1988), which, in combination with SPAD (nondestructive sensors), is considered as a biochemical biomarker () for detection of plant N status in plants in agricultural fields (Yue et al. Citation2020; Cardim Ferreira Lima et al. Citation2020). Jouili, Bouazizi, and El Ferjani (Citation2011) found that under heavy metal stress conditions, the changes in quantitative and qualitative profiles of peroxidases, along with enzyme activity, are considered to be biomarkers of heavy metal stress. As in the conditions of heavy metal stress, plants also reduce the activity of nitrate reductase (NR) and glutamate dehydrogenase (GDH) during N starvation (Coleman, Rosen, and Schwartzbach Citation1988). It is possible that these enzymes are also affected by other nutrient or environmental stresses, but in the statistical sense (order of magnitude; Jouili, Bouazizi, and El Ferjani Citation2011), they can be considered as biochemical biomarkers for detecting the N response of plants to N deficiency (Scheible et al. Citation1997; Urbanczyk-Wochniak and Fernie Citation2005; Srivastava and Singh Citation2006).
On the other hand, it was found that S deficiency reduces glucosinolate accumulation in plants (Falk, Tokuhisa, and Gershenzon Citation2007). After the integration of transcriptomics and metabolomics in order to understand the global response of nutrient deficiency in Arabidopsis, Hirai et al. (Citation2004) found that genes or transcription factors that encode the metabolites involved in glucosinolate metabolism belong to a particular gene–metabolite network which is coordinately regulated under S deficiency. However, glucosinolate accumulation was not investigated as a biomarker for S response under field conditions.
As described in this review, the recent development of high-throughput technologies, particularly in transcriptomics and metabolomics, has facilitated the identification of plant biomarkers that can monitor plant responses to nutrients at the early stage of plant development in real time. The development of such approaches can be helpful for further development of smart fertilization ().
5. Conclusion and future prospects
Smart fertilizer management has greatly impacted N fertilization by expanding the limits of advanced phenotyping of nutrient status in plants and soils (Á, Lloveras, and Martínez-Casasnovas Citation2018; Pudełko et al. Citation2020). Although most of these techniques have not been tested at the field level to date, advanced ideas/technologies which show better performance than other technologies applied in current agriculture are being developed in laboratories. Further studies are necessary to examine the efficient sampling scheme in field-level surveys, but several investigated biomarkers can evaluate plant nutrient status more accurately than other available methods. If the primary diagnostic criteria derived from current imaging technologies and biomarkers are used as auxiliary information, a smaller sample size for biomarker assessment might be sufficient for rational diagnosis. Therefore, biomarkers can be utilized for standardizing and developing the diagnostic tools for managing plant nutrients in real time, in a more precise and specific manner. On the other hand, the advancement of imaging-technology tested in different research fields (e.g., nutrient content in fruits in post-harvest qualification, Torkashvand, Ahmadi, and Nikravesh Citation2017; Maes and Steppe Citation2019) would increase the prediction accuracy for other minerals.
The following challenges in smart fertilizer management include the development of automatic, fast, and real-time management, which can be made possible by integration of phenotyping with IoT and robotics. In addition, advanced genotyping, such as genome-wide association studies and genomic selection, are promising prospects for genetic improvement of crop genotypes with improved nutrient efficiency, which can help to improve fertilizer management (Zhang et al. Citation2014; Lyra et al. Citation2017; Jaiswal et al. Citation2019; Nakano et al. Citation2020).
Acknowledgments
The author RKA is thankful to the Japanese Government (Monbukagakusho: MEXT) for the scholarship. The authors RKA and HK are thankful to the Japan Society for the Promotion of Science KAKENHI Grant.
Disclosure statement
The authors declare no conflicts of interest.
Correction Statement
This article has been republished with minor changes. These changes do not impact the academic content of the article.
Additional information
Funding
References
- Á, M., J. Lloveras, and J. A. Martínez-Casasnovas. 2018. “Use of Multispectral Airborne Images to Improve In-season Nitrogen Management, Predict Grain Yield and Estimate Economic Return of Maize in Irrigated High Yielding Environments.” Remote Sensing 10 (4): 543. doi:https://doi.org/10.3390/rs10040543.
- Adamchuk, V., W. Ji, R. V. Rossel, R. Gebbers, and N. Tremblay. 2018. Proximal soil and plant sensing. In Precision agriculture basics, 119–140. Madison: American Society of Agronomy, Crop Science Society of America, and Soil Science Society of America. WI, USA: https://doi.org/10.2134/precisionagbasics.2016.0093
- Agrahari, R. K., P. Singh, H. Koyama, and S. K. Panda. 2020a. “Plant-microbe Interactions for Sustainable Agriculture in the Post-genomic Era.” Curr. Genom 21 (3): 168–178. doi:10.2174/1389202921999200505082116.
- Agrahari, R. K., Y. Kobayashi, P. Borgohain, S. K. Panda, and H. Koyama. 2020b. “Aluminum-specific Upregulation of GmALS3 in the Shoots of Soybeans: A Potential Biomarker for Managing Soybean Production in Acidic Soil Regions.” Agronomy 10 (9): 1228. doi:10.2134/precisionagbasics.2016.0093.
- Anami, B. S., N. N. Malvade, and S. Palaiah. 2020. “Classification of Yield Affecting Biotic and Abiotic Paddy Crop Stresses Using Field Images.” Inf. Process. Agric 7: 272–285. doi:10.1016/j.inpa.2019.08.005.
- Araújo, S. R., J. A. Demattê, and S. Vicente. 2014. “Soil Contaminated with Chromium by Tannery Sludge and Identified by vis-NIR-mid Spectroscopy Techniques.” Int. J. Remote Sens 35 (10): 3579–3593. doi:10.1080/01431161.2014.907940.
- Aurisano, N., A. Bertani, M. Mattana, and R. Reggiani. 1993. “Abscisic Acid Induced Stress‐like Polyamine Pattern in Wheat Seedlings, and Its Reversal by Potassium Ions.” Physiologia Plantarum 89: 687–692.
- Bacenetti, J., L. Paleari, S. Tartarini, F. M. Vesely, M. Foi, E. Movedi, R. A. Ravasi, et al. 2020. “May Smart Technologies Reduce the Environmental Impact of Nitrogen Fertilization? A Case Study for Paddy Rice.” The Science of the Total Environment 715: 136956. doi:10.1016/j.scitotenv.2020.136956.
- Banerjee, B., S. Joshi, E. Thoday-Kennedy, R. K. Pasam, J. Tibbits, M. Hayden, G. Spangenberg, and S. Kant. 2020. “High-throughput Phenotyping Using Digital and Hyperspectral Imaging-derived Biomarkers for Genotypic Nitrogen Response.” J. Exp. Bot 71 (15): 4604–4615. doi:10.1093/jxb/eraa143.
- Bej, S., and J. Basak. 2014. “MicroRNAs: The Potential Biomarkers in Plant Stress Response.” Am. J. Plant Sci 05 (5): 748–759. doi:10.4236/ajps.2014.55089.
- Biomarkers Definitions Working Group. 2001. “Biomarkers and Surrogate Endpoints: Preferred Definitions and Conceptual Framework.” Clin. Pharmacol. Ther 69 (3): 89–95. doi:10.1067/mcp.2001.113989.
- Borhan, M. S., S. Panigrahi, M. A. Satter, and H. Gu. 2017. “Evaluation of Computer Imaging Technique for Predicting the SPAD Readings in Potato Leaves.” Inf. Process. Agric 4: 275–282. doi:10.1016/j.inpa.2017.07.005.
- Bruning, B., H. Liu, C. Brien, B. Berger, M. Lewis, and T. Garnett. 2019. “The Development of Hyperspectral Distribution Maps to Predict the Content and Distribution of Nitrogen and Water in Wheat (Triticum Aestivum).” Front. Plant Sci 10. doi:10.3389/fpls.2019.01380.
- Cao, Q., Y. Miao, G. Feng, X. Gao, F. Li, B. Liu, S. Yue, S. Cheng, S. L. Ustin, and R. Khosla. 2015. “Active Canopy Sensing of Winter Wheat Nitrogen Status: An Evaluation of Two Sensor Systems.” Computers and Electronics in Agriculture 112: 54–67. doi:10.1016/j.compag.2014.08.012.
- Cardim Ferreira Lima, M., A. Krus, C. Valero, A. Barrientos, J. Del Cerro, and R.-G. Jj. 2020. “Monitoring Plant Status and Fertilization Strategy through Multispectral Images.” Sensors 20 (2): 435. doi:10.3390/s20020435.
- Coleman, L. W., B. H. Rosen, and S. D. Schwartzbach. 1988. “Preferential Loss of Chloroplast Proteins in Nitrogen Deficient Euglena.” Plant & Cell Physiology 29: 1007–1014. doi:10.1093/oxfordjournals.pcp.a077580.
- Corti, M., P. M. Gallina, D. Cavalli, and G. Cabassi. 2017. “Hyperspectral Imaging of Spinach Canopy under Combined Water and Nitrogen Stress to Estimate Biomass, Water, and Nitrogen Content.” Biosyst. Eng 158: 38–50. doi:10.1016/j.biosystemseng.2017.03.006.
- Cui, J., I. Pottosin, E. Lamade, and G. Tcherkez. 2020. “What Is the Role of Putrescine Accumulated under Potassium Deficiency?” Plant Cell Environ 43 (6): 1331–1347. doi:10.1111/pce.13740.
- Elsayed, S., G. Barmeier, and U. Schmidhalter. 2018. “Passive Reflectance Sensing and Digital Image Analysis Allows for Assessing the Biomass and Nitrogen Status of Wheat in Early and Late Tillering Stages.” Front. Plant Sci 9: 1478. doi:10.3389/fpls.2018.01478.
- Erel, R., Z. Kerem, A. Ben-Gal, A. Dag, A. Schwartz, I. Zipori, L. Basheer, and U. Yermiyahu. 2013. “Olive (Olea Europaea L.) Tree Nitrogen Status Is a Key Factor for Olive Oil Quality.” J. Agric. Food Chem 61 (47): 11261–11272. doi:10.1021/jf4031585.
- Erler, A., D. Riebe, T. Beitz, H. G. Löhmannsröben, and R. Gebbers. 2020. “Soil Nutrient Detection for Precision Agriculture Using Handheld Laser-induced Breakdown Spectroscopy (LIBS) and Multivariate Regression Methods (PLSR, Lasso and GPR).” Sensors 20 (2): 418. doi:10.3390/s20020418.
- Falk, K. L., J. G. Tokuhisa, and J. Gershenzon. 2007. “The Effect of Sulfur Nutrition on Plant Glucosinolate Content: Physiology and Molecular Mechanisms.” Plant Biology 9 (5): 573–581. doi:10.1055/s-2007-965431.
- FAO. 2017. The Future of Food and Agriculture: Trends and Challenges. Rome: Food and Agriculture Organization of the United Nations.
- Fillella, I., and J. Penuelas. 1994. “The Red Edge Position and Shape as Indicators of Plant Chlorophyll Content, Biomass and Hydric Status.” Int J Remote Sens 15 (7): 1459–1470. doi:10.1080/01431169408954177.
- Geipel, J., J. Link, J. A. Wirwahn, and W. Claupein. 2016. “A Programmable Aerial Multispectral Camera System for In-season Crop Biomass and Nitrogen Content Estimation.” Agriculture 6 (1): 4. doi:10.3390/agriculture6010004.
- Geny, L., M. Broquedis, J. Martin-Tanguy, J. P. Soyer, and J. Bouard. 1997. “Effects of Potassium Nutrition on Polyamine Content of Various Organs of Fruiting Cuttings of Vitisvinifera L. Cv. Cabernet Sauvignon.” American Journal of Enology and Viticulture 48: 85–92.
- Ghosal, S., D. Blystone, A. K. Singh, B. Ganapathysubramanian, A. Singh, and S. Sarkar. 2018. “An Explainable Deep Machine Vision Framework for Plant Stress Phenotyping.” Proc. Natl. Acad. Sci. USA 115 (4613–4618): 4613–4618. doi:10.1073/pnas.1716999115.
- Gitelson, A. A., U. Gritz, and M. N. Merzlyak. 2003. “Relationships between Leaf Chlorophyll Content and Spectral Reflectance and Algorithms for Non-destructive Chlorophyll Assessment in Higher Plant Leaves.” Journal of Plant Physiology 160: 271–282. doi:10.1078/0176-1617-00887.
- Hackenberg, M., B. J. Shi, P. Gustafson, and P. Langridge. 2013. “Characterization of Phosphorus-regulated miR399 and miR827 and Their Isomirs in Barley under Phosphorus-sufficient and Phosphorus-deficient Conditions.” BMC Plant Boil 13 (1): 214. doi:10.1186/1471-2229-13-214.
- Hellerstein, D., Vilorio, D., Ribaudo, M. 2019. “Agricultural Resources and Environmental Indicators.” EIB-208, U.S. Department of Agriculture, Economic Research Service
- Henry, A., S. Chopra, D. G. Clark, and J. P. Lynch. 2012. “Responses to Low Phosphorus in High and Low Foliar Anthocyanin Coleus (Solenostemon Scutellarioides) and Maize (Zea Mays).” Funct Plant Biol 39: 255–265. doi:10.1071/FP11256.
- Hermans, C., M. Vuylsteke, F. Coppens, A. Craciun, D. Inzé, and N. Verbruggen. 2010. “Early Transcriptomic Changes Induced by Magnesium Deficiency in Arabidopsis Thaliana Reveal the Alteration of Circadian Clock Gene Expression in Roots and the Triggering of Abscisic Acid‐responsive Genes.” New Phytologist 187 (1): 119–131. doi:10.1111/j.1469-8137.2010.03258.x.
- Herrero, H., P. Waylen, J. Southworth, R. Khatami, D. Yang, and B. Child. 2020. “A Healthy Park Needs Healthy Vegetation: The Story of Gorongosa National Park in the 21st Century.” Remote Sensing 12 (3): 476. doi:10.3390/rs12030476.
- Hirai, M. Y., M. Yano, D. B. Goodenowe, S. Kanaya, T. Kimura, M. Awazuhara, M. Arita, T. Fujiwara, and K. Saito. 2004. “Integration of Transcriptomics and Metabolomics for Understanding of Global Responses to Nutritional Stresses in Arabidopsis Thaliana. Proc. Natl. Acad. Sci.” USA 101 (27): 10205–10210. doi:10.1073/pnas.0403218101.
- Hobley, E., M. Steffens, S. L. Bauke, and I. Kögel-Knabner. 2018. “Hotspots of Soil Organic Carbon Storage Revealed by Laboratory Hyperspectral Imaging.” Sci. Rep 8 (1): 1–13. doi:10.1038/s41598-018-31776-w.
- Ito, H., Y. Kobayashi, Y. Y. Yamamoto, and H. Koyama. 2019. “Characterization of NtSTOP1-regulating Genes in Tobacco under Aluminum Stress.” Soil Science and Plant Nutrition 65 (3): 251–258. doi:10.1080/00380768.2019.1603064.
- Jaiswal, V., T. Bandyopadhyay, V. Gahlaut, S. Gupta, A. Dhaka, N. Ramchiary, and M. Prasad. 2019. “Genome-wide Association Study (GWAS) Delineates Genomic Loci for Ten Nutritional Elements in Foxtail Millet (Setariaitalica L.).” Journal of Cereal Science 85: 48–55. doi:10.1016/j.jcs.2018.11.006.
- Jia, B., H. He, F. Ma, M. Diao, G. Jiang, Z. Zheng, J. Cui, and H. Fan. 2014. “Use of a Digital Camera to Monitor the Growth and Nitrogen Status of Cotton.” Sci. World J 2014: 602647. doi:10.1155/2014/602647.
- Jiang, C., X. Gao, L. Liao, N. P. Harberd, and X. Fu. 2007. “Phosphate Starvation Root Architecture and Anthocyanin Accumulation Responses are Modulated by the gibberellin-DELLA Signaling Pathway in Arabidopsis.” Plant Physiology 145 (4): 1460–1470. doi:10.1104/pp.107.103788.
- Ji-Yong, S., Z. Xiao-Bo, Z. Jie-Wen, W. Kai-Liang, C. Zheng-Wei, H. Xiao-Wei, Z. De-Tao, and M. Holmes. 2012. “Nondestructive Diagnostics of Nitrogen Deficiency by Cucumber Leaf Chlorophyll Distribution Map Based on near Infrared Hyperspectral Imaging.” Scientia Horticulturae 138: 190–197. doi:10.1016/j.scienta.2012.02.024.
- Jouili, H., H. Bouazizi, and E. El Ferjani. 2011. “Plant Peroxidases: Biomarkers of Metallic Stress.” Acta Physiol. Plant 33 (6): 2075. doi:10.1007/s11738-011-0780-2.
- Kamruzzaman, M., and D. W. Sun. 2016. “Introduction to Hyperspectral Imaging Technology.” In Computer Vision Technology for Food Quality Evaluation, edited by D. ‐. W. Sun, 111–139. 2nd ed. San Diego: Academic Press.
- Khan, M. S., and A. Zaidi. 2007. “Synergistic Effects of the Inoculation with Plant Growth-promoting Rhizobacteria and an Arbuscular Mycorrhizal Fungus on the Performance of Wheat.” Turk. J. Agric. For 31: 355–362.
- Kurle, J. E., and F. L. Pfleger. 1994. “Arbuscular Mycorrhizal Fungus Spore Populations Respond to 518 Conversions between Low-input and Conventional Management Practices in a Corn-soybean 519 Rotation.” Agronomy Journal 86 (3): 467–475. doi:10.2134/agronj1994.00021962008600030002x.
- Lavanya, G., C. Rani, and P. Ganeshkumar. 2019. “An Automated Low Cost IoT Based Fertilizer Intimation System for Smart Agriculture.” Sustainable Computing: Informatics and Systems 1: 1. doi:10.1016/j.suscom.2019.01.002..
- Lee, K. J., and B. W. Lee. 2013. “Estimation of Rice Growth and Nitrogen Nutrition Status Using Color Digital Camera Image Analysis.” Eur. J. Agron 48: 57–65. doi:10.1016/j.eja.2013.02.011.
- Li, Y., D. Chen, C. N. Walker, and J. F. Angus. 2010. “Estimating the Nitrogen Status of Crops Using a Digital Camera.” Field Crops Research 118 (3): 221–227. doi:10.1016/j.fcr.2010.05.011.
- Lisu, C., S. Yuanyuan, and W. Ke. 2017. “Rapid Diagnosis of Nitrogen Nutrition Status in Rice Based on Static Scanning and Extraction of Leaf and Sheath Characteristics.” Int. J. Agric. Biol. Eng 10: 158–164. doi:10.3965/j.ijabe.20171003.1860.
- Liu, S., L. Li, W. Gao, Y. Zhang, Y. Liu, S. Wang, and J. Lu. 2018. “Diagnosis of Nitrogen Status in Winter Oilseed Rape (Brassica Napus L.) Using In-situ Hyperspectral Data and Unmanned Aerial Vehicle (UAV) Multispectral Images.” Computers and Electronics in Agriculture 151: 185–195. doi:10.1016/j.compag.2018.05.026.
- Liu, Y., Q. Lyu, S. He, S. Yi, X. Liu, R. Xie, Y. Zheng, and L. Deng. 2015. “Prediction of Nitrogen and Phosphorus Contents in Citrus Leaves Based on Hyperspectral Imaging.” Int. J. Agric. Biol. Eng 8: 80–88. doi:10.3965/j.ijabe.20150802.1464.
- Lloyd, D. 1990. “A Phenological Classification of Terrestrial Vegetation Cover Using Shortwave Vegetation Index Imagery.” Int. J. Remote Sens 11 (12): 2269–2279. doi:10.1080/01431169008955174.
- Lu, N., W. Wang, Q. Zhang, D. Li, X. Yao, Y. Tian, Y. Zhu, et al. 2019. “Estimation of Nitrogen Nutrition Status in Winter Wheat from Unmanned Aerial Vehicle Based Multi-angular Multispectral Imagery.” Front. Plant Sci 10: 1601. doi:10.3389/fpls.2019.01601.
- Lyra, D. H., L. De Freitas Mendonça, G. Galli, F. C. Alves, G. Ísc, and R. Fritsche-Neto. 2017. “Multi-trait Genomic Prediction for Nitrogen Response Indices in Tropical Maize Hybrids.” Molecular Breeding : New Strategies in Plant Improvement 37: 80. doi:10.1007/s11032-017-0681-1.
- Maes, W. H., and K. Steppe. 2019. “Perspectives for Remote Sensing with Unmanned Aerial Vehicles in Precision Agriculture.” Trends Plant Sci 24 (2): 152–164. doi:10.1016/j.tplants.2018.11.007.
- Mahesh, S., D. S. Jayas, J. Paliwal, and N. D. G. White. 2015. “Hyperspectral Imaging to Classify and Monitor Quality of Agricultural Materials.” Journal of Stored Products Research 61: 17–26. doi:10.1016/j.jspr.2015.01.006.
- Maimaitijiang, M., A. Ghulam, P. Sidike, S. Hartling, M. Maimaitiyiming, K. Peterson, E. Shavers, et al. 2017. “Unmanned Aerial System (Uas)-based Phenotyping of Soybean Using Multi-sensor Data Fusion and Extreme Learning Machine.” ISPRS J. Photogramm. Remote Sens 134: 43–58. doi:10.1016/j.isprsjprs.2017.10.011.
- Makino, A. 2003. “Rubisco and Nitrogen Relationships in Rice: Leaf Photosynthesis and Plant Growth.” Soil Sci. Plant Nutr 49 (3): 319–327. doi:10.1080/00380768.2003.10410016.
- Manley, M. 2014. “Near-infrared Spectroscopy and Hyperspectral Imaging: Non-destructive Analysis of Biological Materials.” Chem. Soc. Rev 43 (24): 8200–8214. doi:10.1039/C4CS00062E.
- Mercado-Luna, A., E. Rico-García, A. Lara-Herrera, G. Soto-Zarazúa, R. Ocampo-Velázquez, R. Guevara-González, G. Herrera-Ruiz, and I. Torres-Pacheco. 2010. “Nitrogen Determination on Tomato (Lycopersicon Esculentum Mill.) Seedlings by Color Image Analysis (RGB).” Afr. J. Biotechnol 9: 5326–5332.
- Mohammed, G. H., R. Colombo, E. M. Middleton, U. Rascher, C. Van Der Tol, L. Nedbal, Y. Goulas, et al. 2019. “Remote Sensing of Solar-induced Chlorophyll Fluorescence (SIF) in Vegetation: 50 Years of Progress.” Remote Sens. Environ 231: 111177. doi:10.1016/j.rse.2019.04.030.
- Moharana, S., and S. Dutta. 2016. “Spatial Variability of Chlorophyll and Nitrogen Content of Rice from Hyperspectral Imagery.” ISPRS J. Photogramm. Remote Sens 122: 17–29. doi:10.1016/j.isprsjprs.2016.09.002.
- Mulla, D. J. 2013. “Twenty Five Years of Remote Sensing in Precision Agriculture: Key Advances and Remaining Knowledge Gaps.” Biosyst. Eng 114 (4): 358–371. doi:10.1016/j.biosystemseng.2012.08.009.
- Murray, S. C. 2018. “Optical Sensors Advancing Precision in Agricultural Production.” Photon. Spectra 51: 48.
- Nakano, Y., K. Kusunoki, O. A. Hoekenga, K. Tanaka, S. Iuchi, Y. Sakata, M. Kobayashi, Y. Y. Yamamoto, H. Koyama, and Y. Kobayashi. 2020. “Genome-wide Association Study and Genomic Prediction Elucidate the Distinct Genetic Architecture of Aluminum and Proton Tolerance.” Arabidopsis Thaliana. Front. Plant Sci 11. doi:10.3389/fpls.2020.00405.
- Nowaki, R. H., P. Sé, A. B. Cecílio Filho, D. E. Rozane, N. B. Meneses, J. A. Silva, W. Natale, and L. E. Parent. 2017. “Phosphorus Over-fertilization and Nutrient Misbalance of Irrigated Tomato Crops in Brazil.” Front. Plant Sci 8: 825. doi:10.3389/fpls.2017.00825.
- Olas, J. J., F. Fichtner, and F. Apelt. 2020. “All Roads Lead to Growth: Imaging-based and Biochemical Methods to Measure Plant Growth.” J Exp. Bot 71 (1): 11–21. doi:10.1093/jxb/erz406.
- Osco, L. P., A. P. M. Ramos, D. R. Pereira, M. Éas, N. N. Imai, E. T. Matsubara, N. Estrabis, et al. 2019b. “Predicting Canopy Nitrogen Content in Citrus-trees Using Random Forest Algorithm Associated to Spectral Vegetation Indices from UAV-Imagery.” Remote Sensing 11 (24): 2925. doi:10.3390/rs11242925.
- Osco, L. P., A. P. M. Ramos, M. Éas, M. De Souza, J. M. Junior, E. T. Matsubara, N. N. Imai, and J. E. Creste. 2019a. “Improvement of Leaf Nitrogen Content Inference in Valencia-orange Trees Applying Spectral Analysis Algorithms in UAV Mounted-sensor Images.” International Journal of Applied Earth Observation and Geoinformation : ITC Journal 83: 101907. doi:10.1016/j.jag.2019.101907.
- Owens, P. R., M. J. Dorantes, B. A. Fuentes, Z. Libohova, and A. Schmidt. 2020. “Taking Digital Soil Mapping to the Field: Lessons Learned from the Water Smart Agriculture Soil Mapping Project in Central America.” Geoderma Regional 22: e00285. doi:10.1016/j.geodrs.2020.e00285.
- Padilla, F. M., M. T. Peña‐Fleitas, M. Gallardo, and R. B. Thompson. 2015. “Threshold Values of Canopy Reflectance Indices and Chlorophyll Meter Readings for Optimal Nitrogen Nutrition of Tomato.” Ann. Appl. Biol 166 (2): 271–285. doi:10.1111/aab.12181.
- Pagola, M., R. Ortiz, I. Irigoyen, H. Bustince, E. Barrenechea, P. Aparicio-Tejo, C. Lamsfus, and B. Lasa. 2009. “New Method to Assess Barley Nitrogen Nutrition Status Based on Image Colour Analysis: Comparison with SPAD-502.” Comput. Electron. Agric 65 (2): 213–218. doi:10.1016/j.compag.2008.10.003.
- Pandey, P., Y. Ge, V. Stoerger, and J. C. Schnable. 2017. “High Throughput in Vivo Analysis of Plant Leaf Chemical Properties Using Hyperspectral Imaging.” Front. Plant Sci 8: 1348. doi:10.3389/fpls.2017.01348.
- Pasquini, C. 2018. “Near Infrared Spectroscopy: A Mature Analytical Technique with New perspectives–A Review.” Analytica Chimica Acta 1026: 8–36. doi:10.1016/j.aca.2018.04.004.
- Patil, M. A., A. C. Adamuthe, and A. J. Umbarkar. 2018. “Smartphone and IoT Based System for Integrated Farm Monitoring.” In Techno-Societal, edited by P. Pawar, B. Ronge, R. Balasubramaniam, A. Vibhute, and S. Apte, 471–478. Cham: Springer. doi:10.1007/978-3-030-16848-3_43.
- Patrício, D. I., and R. Rieder. 2018. “Computer Vision and Artificial Intelligence in Precision Agriculture for Grain Crops: A Systematic Review.” Computers and Electronics in Agriculture 153: 69–81. doi:10.1016/j.compag.2018.08.001.
- Péret, B., M. Clément, L. Nussaume, and T. Desnos. 2011. “Root Developmental Adaptation to Phosphate Starvation: Better Safe than Sorry.” Trends Plant Sci 16 (8): 442–450. doi:10.1016/j.tplants.2011.05.006.
- Pierce, F. J., and P. Nowak. 1999. “Aspects of Precision Agriculture.” Adv. Agron 67: 1–85. doi:10.1016/S0065-2113(08)60513-1.
- Povh, F. P., D. A. Wdpg, M. Yasin, H. Sw, and H. Arof. 2014. “Optical Sensors Applied in Agricultural Crops.” Optical sensors-New Developments and Practical Applications 141–163.
- Pudełko, A., M. Chodak, J. Roemer, and T. Uhl. 2020. “Application of FT-NIR Spectroscopy and NIR Hyperspectral Imaging to Predict Nitrogen and Organic Carbon Contents in Mine Soils.” Measurement 164: 108117. doi:10.1016/j.measurement.2020.108117.
- Reggiani, R., N. Aurisano, M. Mattana, and A. Bertani. 1993. “Influence of K+ Ions on Polyamine Level in Wheat Seedlings.” Journal of Plant Physiology 141 (2): 136–140.
- Robert, P.C. 2002. “Precision agriculture: a challenge for crop nutrition management.“ Plant and Soil 247: 143–149. doi:10.1023/A:1021171514148
- Roberts, D. P., and A. K. Mattoo. 2018. “Sustainable agriculture—Enhancing Environmental Benefits, Food Nutritional Quality and Building Crop Resilience to Abiotic and Biotic Stresses.” Agriculture 8: 8. doi:10.3390/agriculture8010008.
- Roesti, D., R. Gaur, B. N. Johri, G. Imfeld, S. Sharma, K. Kawaljeet, and M. Aragno. 2006. “Plant Growth Stage, Fertiliser Management and Bio-inoculation of Arbuscular Mycorrhizal Fungi and Plant Growth Promoting Rhizobacteria Affect the Rhizobacterial Community Structure in Rain-fed Wheat Fields.” Soil Biol. Biochem 38 (5): 1111–1120. doi:10.1016/j.soilbio.2005.09.010.
- Rogovska, N., D. A. Laird, C. P. Chiou, and L. J. Bond. 2019. “Development of Field Mobile Soil Nitrate Sensor Technology to Facilitate Precision Fertilizer Management.” Precis. Agric 20 (1): 40–55. doi:10.1007/s11119-018-9579-0.
- Sack, F. D. 1997. “Plastids and Gravitropic Sensing.” Planta 203 (S1): S63–S68. doi:10.1007/PL00008116.
- Sato, A., and K. Miura. 2011. “Root Architecture Remodeling Induced by Phosphate Starvation.” Plant Signal. Behav 6 (8): 1122–1126. doi:10.4161/psb.6.8.15752.
- Sawaki, K., Y. Sawaki, C. R. Zhao, Y. Kobayashi, and H. Koyama. 2016. “Specific Transcriptomic Response in the Shoots of Arabidopsis Thaliana after Exposure to Al Rhizotoxicity:-potential Gene Expression Biomarkers for Evaluating Al Toxicity in Soils.” Plant and Soil 409 (1–2): 131–142. doi:10.1007/s11104-016-2960-8.
- Say, S. M., M. Keskin, M. Sehri, and Y. E. Sekerli. 2018. “Adoption of Precision Agriculture Technologies in Developed and Developing Countries.” Online J. Sci. Technol 8: 7–15.
- Schachtman, D. P., and R. Shin. 2007. “Nutrient Sensing and Signaling: NPKS.” Annu. Rev. Plant Biol 58 (1): 47–69. doi:10.1146/annurev.arplant.58.032806.103750. 2007.
- Scheible, W. R., M. Lauerer, E. D. Schulze, M. Caboche, and M. Stitt. 1997. “Accumulation of Nitrate in the Shoot Acts as a Signal to Regulate Shoot‐root Allocation in Tobacco.” The Plant Journal 11 (4): 671–691. doi:10.1046/j.1365-313X.1997.11040671.x.
- Sewall, C. H., D. A. Bell, G. C. Clark, A. M. Tritscher, D. B. Tully, J. Vanden Heuvel, and G. W. Lucier. 1995. “Induced Gene Transcription: Implications for Biomarkers.” Clin. Chem 41 (12): 1829–1834. doi:10.1093/clinchem/41.12.1829.
- Shendryk, Y., J. Sofonia, R. Garrard, Y. Rist, D. Skocaj, and P. Thorburn. 2020. “Fine-scale Prediction of Biomass and Leaf Nitrogen Content in Sugarcane Using UAV LiDAR and Multispectral Imaging.” Int. J. Appl. Earth Obs. Geoinf 92: 102177. doi:10.1016/j.jag.2020.102177.
- Söderström, M., G. Sohlenius, L. Rodhe, and K. Piikki. 2016. “Adaptation of Regional Digital Soil Mapping for Precision Agriculture.” Precis. Agric 17 (5): 588–607. doi:10.1007/s11119-016-9439-8.
- Srivastava, A. K., and S. Singh. 2006. “Biochemical Markers and Nutrient Constraints Diagnosis in Citrus: A Perspective.” J. Plant Nutr 29 (5): 827–855. doi:10.1080/01904160600651688.
- Stafford, J. V. 2000. “Implementing Precision Agriculture in the 21st Century.” J. Agric. Eng. Res 76 (3): 267–275. doi:10.1006/jaer.2000.0577.
- Stefanini, M., J. A. Larson, D. M. Lambert, X. Yin, C. N. Boyer, P. Scharf, B. S. Tubaña, et al. 2019. “Effects of Optical Sensing Based Variable Rate Nitrogen Management on Yields, Nitrogen Use and Profitability for Cotton.” Precis. Agric 20 (3): 591–610. doi:10.1007/s11119-018-9599-9.
- Steinfath, M., N. Strehmel, R. Peters, N. Schauer, D. Groth, J. Hummel, M. Steup, et al. 2010. “Discovering Plant Metabolic Biomarkers for Phenotype Prediction Using an Untargeted Approach.” Plant Biotechnol. J 8 (8): 900–911. doi:10.1111/j.1467-7652.2010.00516.x.
- Stevens, G., D. Dunn, and B. Phipps. 2001. “How to Diagnose Soil Acidity and Alkalinity Problems in Crops: A Comparison of Soil pH Test Kits.” J. Ext 39: 4. https://www.joe.org/joe/2001august/tt3.php.
- Steyn, W. J., S. J. E. Wand, D. M. Holcroft, and G. Jacobs. 2002. “Anthocyanins in Vegetative Tissues: A Proposed Unified Function in Photoprotection.” New Phytologist 155 (3): 349–361. doi:10.1046/j.1469-8137.2002.00482.x.
- Sun, J., A. M. Abdulghani, M. A. Imran, and Q. H. Abbasi 2020: IoT Enabled Smart Fertilization and Irrigation Aid for Agricultural Purposes. In Proceedings of the 2020 International Conference on Computing, Networks and Internet of Thing, Sanya, China, 71–75. doi.10.1145/3398329.3398339
- Sung, J., S. Lee, Y. Lee, S. Ha, B. Song, T. Kim, and W. B. M. Krishnan HB. 2015. “Metabolomic Profiling from Leaves and Roots of Tomato (Solanum Lycopersicum L.) Plants Grown under Nitrogen, Phosphorus or Potassium-deficient Condition.” Plant Science : An International Journal of Experimental Plant Biology 241: 55–64. doi:10.1016/j.plantsci.2015.09.027.
- Swetha, R. K., P. Bende, K. Singh, S. Gorthi, A. Biswas, B. Li, D. C. Weindorf, and S. Chakraborty. 2020. “Predicting Soil Texture from Smart Phone-captured Digital Images and an Application.” Geoderma 376: 114562. doi:10.1016/j.geoderma.2020.114562.
- Tachimoto, M., M. Fukutomi, H. Matsushiro, M. Kobayashi, and E. Takahashi. 1992. “Role of Putrescine in Lemna Plants under Potassium Deficiency.” Soil Science and Plant Nutrition 38 (2): 307–313. doi:10.1080/00380768.1992.10416494.
- Takehisa, H., and Y. Sato. 2019. “Transcriptome Monitoring Visualizes Growth Stage‐dependent Nutrient Status Dynamics in Rice under Field Conditions.” The Plant Journal 97 (6): 1048–1060. doi:10.1111/tpj.14176.
- Takehisa, H., Y. Sato, B. Antonio, and Y. Nagamura. 2015. “Coexpression Network Analysis of Macronutrient Deficiency Response Genes in Rice.” Rice 8 (1): 24. doi:10.1186/s12284-015-0059-0.
- Takehisa, H., Y. Sato, B. A. Antonio, and Y. Nagamura. 2013. “Global Transcriptome Profile of Rice Root in Response to Essential Macronutrient Deficiency.” Plant Signal Behav 8 (6): e24409. doi:10.4161/psb.24409.
- Tamai, T., Y. Shimada, T. Sugimoto, N. Shiraishi, and Y. Oji. 2000. “Potassium Stimulates the Efflux of Putrescine in Roots of Barley Seedlings.” J Plant Physiol 157 (6): 619–626. doi:10.1016/S0176-1617(00)80004-8.
- Tantalaki, N., S. Souravlas, and M. Roumeliotis. 2019. “Data-Driven Decision Making in Precision Agriculture: The Rise of Big Data in Agricultural Systems.” Journal of Agricultural & Food Information 20 (344–380). doi:10.1080/10496505.2019.1638264.
- Tewari, V. K., A. K. Arudra, S. P. Kumar, V. Pandey, and N. S. Chandel. 2013. “Estimation of Plant Nitrogen Content Using Digital Image Processing.” Agric Eng Int: CIGR J 15: 78–86.
- Timsina, J. 2018. “Can Organic Sources of Nutrients Increase Crop Yields to Meet Global Food Demand?” Agronomy 8 (10): 214. doi:10.3390/agronomy8100214.
- Torkashvand, A. M., A. Ahmadi, and N. L. Nikravesh. 2017. “Prediction of Kiwifruit Firmness Using Fruit Mineral Nutrient Concentration by Artificial Neural Network (ANN) and Multiple Linear Regressions (MLR).” J. Integr. Agric 16 (7): 1634–1644. doi:10.1016/S2095-3119(16)61546-0.
- Urbanczyk-Wochniak, E., and A. R. Fernie. 2005. “Metabolic Profiling Reveals Altered Nitrogen Nutrient Regimes Have Diverse Effects on the Metabolism of Hydroponically-grown Tomato (Solanum Lycopersicum) Plants.” Journal of Experimental Botany 56 (410): 309–321. doi:10.1093/jxb/eri059.
- Vizzari, M., F. Santaga, and P. Benincasa. 2019. “Sentinel 2-based Nitrogen VRT Fertilization in Wheat: Comparison between Traditional and Simple Precision Practices.” Agronomy 9 (6): 278. doi:10.3390/agronomy9060278.
- Waidmann, S., M. R. Rosquete, M. Schöller, E. Sarkel, H. Lindner, T. LaRue, I. Petřík, et al. 2019. “Cytokinin Functions as an Asymmetric and Anti-gravitropic Signal in Lateral Roots.” Nature Communications 10 (1): 1–14. doi:10.1038/s41467-019-11483-4.
- Walter, A., R. Finger, R. Huber, and N. Buchmann. 2017. “Opinion: Smart Farming Is Key to Developing Sustainable Agriculture.” Proc. Natl. Acad. Sci 114 (24): 6148–6150. doi:10.1073/pnas.1707462114. USA.
- Wang, L., J. H. Q. Zeng, J. Song, S. J. Feng, and Z. M. Yang. 2015. “miRNA778 and SUVH6 are Involved in Phosphate Homeostasis in Arabidopsis.” Plant Science : An International Journal of Experimental Plant Biology 238: 273–285. doi:10.1016/j.plantsci.2015.06.020.
- Wang, Y., X. Hu, G. Jin, Z. Hou, J. Ning, and Z. Zhang. 2019. “Rapid Prediction of Chlorophylls and Carotenoids Content in Tea Leaves under Different Levels of Nitrogen Application Based on Hyperspectral Imaging.” J. Sci. Food Agric 99 (4): 1997–2004. doi:10.1002/jsfa.9399.
- Wiegmann, M., A. Backhaus, U. Seiffert, W. T. Thomas, A. J. Flavell, K. Pillen, and A. Maurer. 2019. “Optimizing the Procedure of Grain Nutrient Predictions in Barley via Hyperspectral Imaging.” PloS One 14 (11): e0224491. doi:10.1371/journal.pone.0224491.
- Xiong, D., J. Chen, T. Yu, W. Gao, X. Ling, Y. Li, S. Peng, and J. Huang. 2015. “SPAD-based Leaf Nitrogen Estimation Is Impacted by Environmental Factors and Crop Leaf Characteristics.” Sci. Rep 5 (1): 13389. doi:10.1038/srep13389.
- Xu, H. X., X. Y. Weng, and Y. Yang. 2007. “Effect of Phosphorus Deficiency on the Photosynthetic Characteristics of Rice Plants.” Russian Journal of Plant Physiology: A Comprehensive Russian Journal on Modern Phytophysiology 54 (6): 741–748. doi:10.1134/S1021443707060040.
- Yang, J., L. Du, W. Gong, S. Shi, J. Sun, and B. Chen. 2018. “Potential of Vegetation Indices Combined with Laser-induced Fluorescence Parameters for Monitoring Leaf Nitrogen Content in Paddy Rice.” PloS One 13 (1): e0191068. doi:10.1371/journal.pone.0191068.
- Yang, M., M. A. Hassan, K. Xu, C. Zheng, A. Rasheed, Y. Zhang, X. Jin, X. Xia, Y. Xiao, and Z. He. 2020. “Assessment of Water and Nitrogen Use Efficiencies through UAV-based Multispectral Phenotyping in Winter Wheat.” Front. Plant Sci 11: 927. doi:10.3389/fpls.2020.00927.
- Yang, X. S., J. Wu, T. E. Ziegler, X. Yang, A. Zayed, M. S. Rajani, D. Zhou, et al. 2011. “Gene Expression Biomarkers Provide Sensitive Indicators of in Planta Nitrogen Status in Maize.” Plant Physiology 157 (4): 1841–1852. doi:10.1104/pp.111.187898.
- Yao, X. M., and W. Luo. 2012. “Foliar Image Color Features for Rubber Nitrogen Deficiency Status Analysis.” Adv. Mat. Res 488: 1674–1679..
- Ye, X., S. Abe, and S. Zhang. 2020. “Estimation and Mapping of Nitrogen Content in Apple Trees at Leaf and Canopy Levels Using Hyperspectral Imaging.” Precis. Agric 21 (1): 198–225. doi:10.1007/s11119-019-09661-x.
- Yu, K. Q., Y. R. Zhao, X. L. Li, Y. N. Shao, F. Liu, and Y. He. 2014. “Hyperspectral Imaging for Mapping of Total Nitrogen Spatial Distribution in Pepper Plant.” PloS One 9 (12): e116205. doi:10.1371/journal.pone.0116205.
- Yu, X., H. Lu, and Q. Liu. 2018. “Deep-learning-based Regression Model and Hyperspectral Imaging for Rapid Detection of Nitrogen Concentration in Oilseed Rape (Brassica Napus L.) Leaf.” Chemom. Intell. Lab. Syst 172: 188–193. doi:10.1016/j.chemolab.2017.12.010.
- Yue, X., Y. Hu, H. Zhang, and U. Schmidhalter. 2020. “Evaluation of Both SPAD Reading and SPAD Index on Estimating the Plant Nitrogen Status of Winter Wheat.” Int. J. Plant Prod 14 (1): 67–75. doi:10.1007/s42106-019-00068-2.
- Zhang, D., H. Song, H. Cheng, D. Hao, H. Wang, G. Kan, H. Jin, and D. Yu. 2014. “The Acid Phosphatase-encoding Gene GmACP1 Contributes to Soybean Tolerance to Low-phosphorus Stress.” PLoS Genetics 10 (1): 1. doi:10.1371/journal.pgen.1004061.
- Zhang, J., T. Xie, C. Yang, H. Song, Z. Jiang, G. Zhou, D. Zhang, H. Feng, and J. Xie. 2020. “Segmenting Purple Rapeseed Leaves in the Field from UAV RGB Imagery Using Deep Learning as an Auxiliary Means for Nitrogen Stress Detection.” Remote Sensing 12 (9): 1403. doi:10.3390/rs12091403.
- Zhao, H., R. Sun, U. Albrecht, C. Padmanabhan, A. Wang, M. D. Coffey, T. Girke, et al. 2013. “Small RNA Profiling Reveals Phosphorus Deficiency as a Contributing Factor in Symptom Expression for Citrus Huanglongbing Disease.” Mol. Plant 6 (2): 301–310. doi:10.1093/mp/sst002.
- Zheng, H., T. Cheng, D. Li, X. Yao, Y. Tian, W. Cao, and Y. Zhu. 2018. “Combining Unmanned Aerial Vehicle (Uav)-based Multispectral Imagery and Ground-based Hyperspectral Data for Plant Nitrogen Concentration Estimation in Rice.” Front. Plant Sci 9: 936. doi:10.3389/fpls.2018.00936.