
ABSTRACT
In the Mekong Delta, triple rice cropping is widely spread. The rice cultivation is characterized by a short cropping period and nearly year-round flooding. Putting the soil under an oxidative condition through changing the water regimes during cropping periods might have a potential to increase the rice yield. To test this potential, an experiment was conducted at a typical triple-cropping farmer’s alluvial paddy in a central area of the delta for five years, 15 consecutive cropping seasons. We adopted an intermittent irrigation technique known as alternate wetting and drying (AWD). Under AWD, we irrigated to a depth of 5 cm above the soil surface only when the field water level dropped to 15 cm below the soil surface, with some exceptions. As a control, we prepared a treatment under which the paddy was continuously flooded (CF) except 2 weeks before expected harvest. We also prepared three straw treatments: all raw straw return, all straw-ash return, and no straw return to the paddy. For other field management, we adopted locally conventional methods. Results show that the straw treatment effects on the rice yield were not significant. For water treatments, the soil redox potential under AWD remained higher, in most cases, than that under CF; and the rough rice yield, harvest index, and percentage of ripened grains under AWD respectively became 8.9%, 4.4%, and 3.5% higher (p < 0.01) than those under CF, with lower N contents in rice grains and 43% less irrigation water use. The increase in rice yield by AWD was found with an increase in harvest index and a decrease in aboveground biomass and nitrogen content, indicating that it was due to the promotion of nutrient translocation in rice by AWD. The effect of AWD was enhanced particularly in the winter–spring cropping season, during which the nighttime temperature was the lowest. This piece of evidence that the rice yield of the delta can be increased simply by introducing AWD has the potential to encourage farmers to take voluntary actions that will also lead to a reduction in methane emission from rice paddies.
1. Introduction
The Mekong Delta is a globally important region for rice production and international rice commerce. Vietnam has been the world’s fifth-ranked producer of rice since 1992 (42.8 and 44.0 Mt of paddy in 2017 and 2018, respectively) (FAOSTAT Citation2020). Simultaneously, Vietnam was world’s second or third largest exporter of rice since 1996 (5.8 Mt of milled-equivalent total rice in 2017) (FAOSTAT Citation2020). In sustaining this high level of Vietnamese rice production, the Mekong Delta has played a central role. Although the delta accounts for only 11% (4.06 M ha) of Vietnam’s area, it accounts for more than half (23.6 Mt of paddy in 2017) of the country’s rice production (General Statistics Office of Vietnam Citation2019). The delta’s rice planted area reached 4.19 M ha in 2017 (General Statistics Office of Vietnam Citation2019); 57.4% of the area in 2012 is estimated as triple-cropped (Son et al. Citation2013). The triple cropping must provide farmers with higher and more stable annual yields than single or double cropping. On the other hand, there are paddy fields that are enclosed by high dikes that prevent floods from entering in order to realize three crops a year, and in the case of such paddies, there are reports that the advantage in increasing annual yields will diminish in the long run (e.g., Tran et al. Citation2018a). The government is also encouraging diversification of cropping including the combination with aquaculture (Kien, Han, and Cramb Citation2020).
The delta’s triple-cropping rice paddies are submerged nearly year-round. Many of them have not only three flooding cropping-seasons but also an annual flooding fallow season (except those protected by high dikes), during which rice cannot be cultivated due to the high water level. Each rice cropping period is, therefore, very short, and their soil is in a condition to be reductive throughout the year. We supposed that, under such an environment, giving mild water stress to rice or putting the soil under a more oxidative condition through changing the water regimes during rice cropping periods might have a potential to increase the rice grain yield of the region.
Water regimes before and during a rice cultivation period are also known to be a major factor of methane (CH4) emission intensity as summarized by Ogle et al. (Citation2019). Multiple drainage is considered one of the practical and effective options to mitigate CH4 emissions but has not been disseminated very widely in the delta. It is very likely because many of the farmers do not find any appealing benefits in adopting multiple drainage, but if it increases rice yields as we assumed, then the potential for dissemination of this irrigation practice that reduces methane emission will increase. Indeed some irrigation techniques that provide multiple drainage for paddy fields such as moderate or safe alternate wetting and drying (AWD) that does not impose strong drought stress successfully reduce irrigation water use without significantly sacrificing yield and increase the productivity of total water input (Bouman et al. Citation2007; Chidthaisong et al. Citation2018; Lampayan et al. Citation2015; Setyanto et al. Citation2018; Sibayan et al. Citation2018; Tran et al. Citation2018b; Samoy-Pascual et al. Citation2019), but few, e.g., Yang and Zhang (Citation2010), reported significant increase in yield. However, the story may be different if water-abundant triple rice cropping areas are targeted for the introduction of such water-saving irrigation techniques instead of water-scarce areas, which have been mainly targeted. Targeting water-abundant triple rice cropping areas is indeed less meaningful from the water-saving point of view but very natural from the viewpoint of enhancing soil aeration. We hypothesized that in such paddies submerged nearly year-round, the benefits to the rice of placing the rice in a slightly more aerobic soil environment would outweigh the disadvantages to the rice caused by the mild water stress that comes in exchange. We therefore examined the potential of increased yield by introducing a moderate AWD to a typical triple-cropping farmer’s rice paddy of the delta.
2. Materials and methods
2.1. Site
For the five years since November 2011 (in this paper, we call the a-year period starting from the rice cropping season that started from November 2011 as the experimental year 2012 (hereinafter EY 2012), followed by EY 2013, EY 2014, EY 2015, and EY 2016), during 15 rice cropping seasons, an experiment was conducted at a typical triple-cropping farmer’s rice paddy (10○18ʹN, 105○54ʹE) of Tan Loi 2 Hamlet, Tan Hung Ward, Thot Not Village, Can Tho City, Vietnam, located at the central part of Vietnamese Mekong Delta. The site is in an area of a silty-clay fluvisol that consists of a Holocene complex of river levees and basins. The paddy’s 0–10-cm-deep soil had 52% clay, 48% silt, 0.3% sand, 44.7 ± 3.6 g kg−1 organic C, 3.8 ± 0.3 g kg−1 total nitrogen, pH(H2O) 5.15 ± 0.47, pH(KCl) 4.88 ± 0.66, pH(H2O2) 4.2 ± 0.5 (mean ± standard deviation; n = 18 each). The climate is classified as tropical savannah in the Köppen climate classification categories. At the site, we had a flooding fallow season each year for about 2 months during September–November. Counting from the first cropping after the flood fallow season, the three cropping seasons a year at the site were called winter–spring (W–S; November – February/March), spring–summer (S–S; February/March – May/June), and summer–autumn (S–A; May/June – September). The non-cropping periods between the harvest of the W–S and S–S cropping and the seeding of the S–S and S–A cropping, respectively, were only around a week. According to Hong Van et al. (Citation2014), 50 farm households of Tan Loi 2 Hamlet, including the household that supplied the paddy field used for the experiment, had adopted triple rice cropping continuously for at least five years since 2007. A full description of the seasonal and geological characteristics of the studied area and its indigenous rice cropping practices is provided by Hong Van et al. (Citation2014).
2.2. Experimental design
2.2.1. General cropping method
Rice cropping in the experiment followed the hamlet community’s triple rice cropping calendar (dates of major field operations (including rice heading) in the whole 5-year experimental period during 15 cropping seasons is shown in Supplementary Materials, Fig. S1). Except field water and harvested rice straw treatments, we also adopted locally conventional methods of rice field management in the experiment, including rice cultivars, the manners of harvest hand-reaping, land preparation before seeding, seeding, and application of fertilizers (Table S1) and other agro-chemicals.
2.2.2. Field water treatments
To put the paddy soil under oxidative and reductive conditions, we prepared an alternate wetting and drying irrigation treatment (AWD) and a continuously flooding/saturating treatment (CF), respectively. For both field water treatments, the soils were kept saturated for a week after seeding. Then the soils were kept flooded for a week. After that, water was supplied to a depth of 5 cm above the soil surface when a criterion, mentioned below, for irrigation of each treatment was satisfied. From 2 weeks before the expected harvest, standing water of both treatments was drained.
Under CF, rice plots were kept flooded from 1 week after seeding until 2 weeks before the expected rice harvest. Water was supplied when the standing water level decreased to approximately 1 cm above the soil surface.
Under AWD, although water management was the same as that of CF for 2 weeks after seeding, from then until 2 weeks before the expected rice harvest, rice plots were irrigated only when the field water level dropped to 15 cm below the soil surface, except for 10 days after heading and when we applied fertilizers. The day of heading was judged as the day when the ratio of heading spikes reaching 5% for the first time, and for 10 days after that, we kept the plot flooded. Immediately before applying fertilizers, we irrigated.
2.2.3. Rice straw treatments
As with field water management, the amount of rice straw applied to paddies is well known to be one of the few factors affecting soil redox potential that can be realistically adjusted by farmers. Because actual mode of rice straw treatment after harvest in the study site depended on farmers and cropping seasons (Hong Van et al. Citation2014), we adopted three rice straw treatments to make our experiment cover the diverse rice straw treatments in the community: all raw straw return (SR), all straw-ash return (SA), and no straw return (S0) to the paddy. Rice straw was hand-reaped at harvest. The length/height and weight of the straw that was hand-reaped and remaining on the field as stumps at harvests of respective cropping seasons are presented in .
Table 1. Length/height and dry weight of hand-reaped rice straw and remaining rice straw as stumps at harvest of each cropping season during the 5-year experimental term. Hand-reaping was done following the local farmers’ conventional practices. When we collected samples of stumps (remaining straw) for the dry weight determination, the stumps were hand-reaped exactly at the soil surface height
All raw straw return treatment (SR): All rice straw hand-reaped at each plot was returned directly to the plot immediately after harvesting and threshing. After W–S and S–S cropping, the straw was spread over the plot evenly and was then incorporated into the plot soil when the field was ploughed/puddled by using a hand-tractor. After the S–A cropping, after which we had the approximately-for-2-months flooding fallow season, the straw was spread over the standing water or wet soil surface of the plot evenly and left during the flood fallow season. After the flood fallow season, the decomposed straw remained visually identified on the soil surface. Only for the rice straw harvested in September 2011 after the S–A cropping before starting the experiment, the straw was not spread on the standing water or wet soil surface immediately after harvest but was instead left on the community dike and returned to the plots immediately before the subsequent W–S rice cropping.
All straw-ash return treatment (SA): All rice straw hand-reaped at each plot was returned to the plot as ash immediately after harvesting, threshing, sun-drying, and burning. The harvested straw of the W–S and S–S cropping had been spread over the plot surface evenly for sun-drying normally for a few days and had been burned directly in the plot normally in 2 days immediately after sun-drying. When we needed to pile up the straw for burning because of the high-water content of the straw, we scattered ash over the plot by hand after burning in the plot. Regarding the straw of the S–A cropping, we transferred that of each plot individually to the community dike for sun-drying (when rainy, covered using a plastic sheet) because the field of the season was very wet or flooded. After drying, the straw was piled up individually on metal sheets/plates under a roof and was burned for a day. Whole ash obtained from the straw from each plot was spread over the wet soil surface or standing water of the plot and was left during the approximately-for-2-months flood fallow season. Carbon and nitrogen returned to the field through the straw-ash application were described in Arai et al. (Citation2015).
No straw return treatment (S0): All hand-reaped rice straw, excluding the stumps, was removed from each plot. The amounts of removed straw and left stumps are presented in .
2.2.4. Dimension, allocation, and general setting of experimental field plots
A typical long-and-narrow-shaped triple-cropping farmer’s rice paddy (approximately 306 × 26 m (0.78 ha)) was used for the experiment. The paddy was split into six 51 × 26 m (0.13 ha) blocks with five 26-m-long parallel internal borders. Each block was surrounded by a ridge. Along the ridge, 60-cm-high and 0.05-cm-thick corrugated hard-PVC sheets (Azenami; Takiron Co. Ltd., Japan) were tightly inserted into the soil to reach a depth of 50 cm below the rice paddy soil surface to prevent standing water and 0–50-cm-deep soil water from exchanging inside and outside the block. Three of the blocks were used for AWD. The other three were used for CF. The two treatments were alternately allocated for the six blocks, which formed a row in the experimental field.
Each block was split into three 17 × 26 m (0.043 ha) plots randomly for three rice straw treatments (SR, SA, and S0) with two 26-m-long parallel internal border ridges into which no impermeable sheet was inserted when we started the experiment in November 2011, and 50-cm-high PP sheets (Tairipro, Taiwan) were inserted to reach a depth of 40 cm below the rice paddy soil surface in September 2012. In consequence, we prepared 18 plots (17 × 26 m; 0.043 ha), which formed a row in the experimental field, with six treatments (AWD-SR, AWD-SA, AWD-S0, CF-SR, CF-SA, and CF-S0) in triplicate.
To monitor the amount of irrigation water use, along one of the long sides (306 m long) of the whole experimental field, we installed a PVC irrigation tube (16.0 cm inner diameter; 16.8 cm outer diameter), into which irrigation water was pumped from a canal that ran parallel and close with one of the short sides (26 m long) of the whole experimental field, across the community dike.
In the first experimental year (EY 2012), we managed the field water, taking a 51 × 26 m block as a field water management unit, i.e., we set an irrigation water inlet with a flowmeter for each block and irrigated to the three plots in a block at once when one of the three plots reached a criterion for irrigation. In November 2012 after inserting the impermeable sheets into the two internal border ridges in each block before starting the second experimental year, we set an irrigation water inlet with a flowmeter for each plot and started managing the field water of each plot individually.
2.2.5. Land preparation for seeding
We adopted locally conventional ways for land preparation for seeding. Among experimental plots, no difference was given in the manner and timing of ploughing/puddling and leveling the field. Those operations for land preparation were done by using a hand-tractor and were completed within approximately a week, which enabled the seeding to be done approximately a week after the harvest of the prior cropping (except when the flood fallow season wedged between the harvest and the next seeding). The field was ploughed/puddled and then leveled before the S–S and S–A cropping, although the field was only leveled before the W–S cropping, before which we had an approximately-for-2-months flooding fallow season, after which all stumps were well decomposed and became very soft.
2.2.6. Rice cultivars and seeding
We used Jasmine 85, an aromatic long-grain indica rice cultivar developed in Thailand, for W–S cropping. For the S–S and S–A cropping, we used OM4218, a non-photoperiod-sensitive indica rice cultivar that was developed by the Cuu Long Delta Rice Research Institute, Can Tho, Vietnam. Those cultivars were the most popular cultivars in the community for the respective cropping seasons. According to the survey results of Hong Van et al. (Citation2014), Jasmine 85 was adopted for W–S cropping in 2007–2011 by 90.8% of investigated 50 farm households of the hamlet where we conducted the experiment, and OM4218 for the S–S and S–A cropping by 80.2% and 76.9%, respectively.
As for seeding, 231 kg dry weight ha−1 crop−1 of pre-germinated commercial seeds (after a 2-day soaking and 2-day drying treatment) were broadcast to wet paddies by hand after field leveling, irrespective of rice cultivar or cropping season.
2.3. Observations and analyses
2.3.1. Hydro-meteorological observations
Air temperature and relative humidity were measured every hour at 2 m above the soil surface at the middle of one of the long sides of the whole experimental paddy field, using a device (HOBO U23 Pro v2 Temperature/Relative Humidity Data Logger – U23-001; Onset Computer Corp., USA) installed in a solar radiation shield (RS1; Onset Computer Corp., USA). The water level of the canal, from which irrigation water was pumped into the experimental irrigation tube, was recorded every 30 min using water level data loggers (HOBO U20; Onset Computer Corp., USA) that were installed in a PVC tube (5-cm inner diameter × 3-m height) with water-exchange holes.
2.3.2. Field water level
In order to monitor the field water level in each plot, two types of water level gauges were installed at a distance of 8 m from a long side (26 m) and 5 m from a short side (17 m) in each plot (Fig. S2). One was for visual measurement. The field water level was visually measured by checking the water level in an open-ended PVC tube (slightly larger inner diameter than that of a ping-pong ball) with one end buried in the soil and the other end open to the air above the soil surface and with slits in the lateral surface to allow water exchange. In the water in the tube, we floated a ping-pong ball with a ruler glued to the top and used the length of the ruler sticked out from the tube top to calculate the water level. Using this gauge, the field water level of each plot was visually observed every day at around 8 AM, except during flood fallow seasons and land preparation periods before seeding. This field water level information was recorded and used for irrigation management.
The other was for automatic recording. HOBO U20 Water Level Data Logger (Onset Computer Corp., USA) was used and set to be able to measure the field water level within the range of −25 cm – +375 cm above the soil surface and to record the water level every 10 minutes. This system was used continuously from November 2012 (except land preparation periods) until the end of the whole experimental period, including flood fallow seasons.
2.3.3. Irrigation water use
Cumulative irrigation water use for each cropping, i.e., that from the first irrigation for land preparation before seeding to the last irrigation before harvesting of each cropping, was monitored with a rotor type water flowmeter (LXS-15E-50E; Cixi Yongxi Instrument Factory, China) of an irrigation water inlet installed in each 17 × 26 m plot (EYs 2013–2016) or in each 51 × 26 m block (EY 2012).
2.3.4. Soil redox potential
Four platinum-tipped electrodes (Hirose Rica Co., Japan) for measuring the Eh of 5-cm deep soil were installed in soil of each plot, approximately 50-cm distant from the field water level monitoring tubes. The soil Eh was measured every morning using an Eh-meter (PRN-41; Fujiwara Scientific Company Co. Ltd., Japan).
2.3.5. Rice sample and data collection at harvest
The weight of each rice plant sample described below was calculated as having 14% moisture content. For the calculation, each sample was oven-dried in an oven at 70 °C for 3 days. The moisture content of the dried sample was assumed to be 3% according to the method of Dobermann and Fairhurst (Citation2000) described for grain.
2.3.5.1. Selection of a representative area in a plot
In the area within approximately 3 m from the water-level monitoring tubes of each plot, a representative 2 × 2 m observation area that had moderate rice conditions in terms of growth in plant height, leaf and spike color, lodging, and damage by animals, workers, and/or disease was chosen.
2.3.5.2. Plant height and flag-leaf color index
Before collecting rice plant samples from the representative 2 × 2 m area in each plot, 20 hills, 5 of which were selected randomly from the area near each side of the representative area in the representative area, were used for nondestructive determination of the rice plant height and flag-leaf color index measured using a chlorophyll meter (SPAD-502 Plus; Konica Minolta, Inc., Japan). Three SPAD reading values were obtained near the midpoint (but not on the leaf vein) of the main stem’s flag leaf of a hill. The highest SPAD value of the three was used for analysis as the value of the hill.
2.3.5.3. Aboveground biomass and yield components
After the nondestructive determination, all aboveground rice plants in each representative area were hand-reaped exactly at the height of soil surface and were separated into straw and panicles to ascertain each plot’s yield components (panicle number, spikelet number, % of filled spikelet, and grain weight). The panicles were hand-threshed. The filled and unfilled spikelets were separated by submerging them in a salt solution with specific gravity of 1.060 (Tamai and Ma Citation2008). Air-dried subsamples of 50 g filled and 50 g unfilled spikelets were taken to ascertain the numbers and weights of the respective spikelets.
2.3.5.4. Root biomass and length density
After collecting the aboveground rice plant samples, rice root samples were collected in each representative area with a hard-PVC-made cylindrical soil sampler. The soil sampler (159 mm and 168 mm inner and outer diameters, respectively) was inserted into the soil at the intersection point of the area’s diagonals to collect 0–5, 5–10, 10–20, 20–30, and 30–35-cm deep soil samples. The dry weight and length densities of roots in each soil sample were found using the Tennant method (Tennant Citation1975) with slight modification as described in Murakami, Yamada, and Yoshida (Citation1999). The amounts of roots per unit area were calculated on the assumption that no roots were below 35 cm soil depth.
In the same manner (but with no collection of aboveground rice plant samples), a rice root survey was administered at each plot on each heading day, too, the definition of which day is described in 2.2.2, in 2013–2016 at a place that had moderate rice conditions (the criteria were the same as that of 2.3.5.1). That was approximately 3 m distant from the water level monitoring location, and the place was not used for the subsequent rice root survey conducted at the harvest of the same cropping.
2.3.5.5. Stump biomass and height
After collecting the sample and data in the representative area in a plot, we harvested the outside of the representative area in the plot by hand according to the local farmers’ conventional method. After that, rice stump biomass of each plot was ascertained from the dry weight of the entire aboveground stump biomass that had been hand-reaped exactly at the soil surface from two 0.5 × 0.5 m areas that had moderate conditions. One of the 0.5 × 0.5 m areas was selected approximately 10–20 cm away from one of vertices of the 2 × 2 m representative area, and the other 0.5 × 0.5 m area was selected approximately 10–20 cm away from the opposite vertex of the 2 × 2 m representative area. Twenty rice stumps in each plot were also selected randomly to ascertain the rice stump heights at the respective plots.
2.3.5.6. Carbon and nitrogen contents in plant samples
Oven-dried rice grain, straw, and root samples obtained in 2012–2014 were ground. Carbon and nitrogen contents of each sample were found using a nitrogen and carbon analyzer (CN corder MT-500; Yanagimoto Co., Ltd., Japan).
2.3.6. Statistical analyses
Data were analyzed using a linear mixed model considering the blocked split–split plot experimental design with software (Statistical Package R; R Development Core Team 2005; ver. 3.3.0, http://www.r-project.org/). As fixed effects (whole-plot treatment, split-plot treatment, and split–split plot treatment), the observed rice cropping season (W–S, S–S, or S–A), the water management (AWD or CF), and the straw management (SR, SA, or S0) were treated, respectively. As random effects, the observation year (2012, 2013, 2014, 2015, or 2016) and six water management blocks were also included. Each water-management block consists of all straw treatments consistently. To compare a single water management effect, the means were also analyzed statistically using Student unpaired t-tests.
3. Results
3.1. Rice straw treatments and production
Adopting the locally conventional hand-reaping rice harvest, approximately 51-cm-long rice straw was harvested and approximately 36-cm-high rice stumps were left on each plot after harvest throughout the whole experimental period irrespective of rice straw treatment or cropping season (). The dry weight of the hand-reaped straw was, however, only around half that of the left stumps. Consequently, approximately two thirds of the produced rice straw biomass was left on the plots as stumps ().
The amounts of straw biomass produced in the S–A cropping season were significantly (p < 0.01) smaller than those produced in the other cropping seasons ( and Fig. S3(b)). The amounts of hand-reaped straw of the S–A rice also became the smallest ().
Table 2. ANOVA results of the effect of season (the winter–spring, the spring–summer, or the summer–autumn cropping season), water treatment (continuously flooding or alternate wetting and drying), straw treatment (all raw straw returned, all straw-ash returned, or no straw returned) on the root biomass at rice harvest, root length density at harvest, SPAD value at rice harvest, panicle number, spikelet number, percentage of filled spikelet (number of filled spikelet / number of total spikelet), grain weight, rice yield, straw biomass, aboveground biomass, and the harvest index (rice yield / aboveground biomass). As random effects, the experimental year (EY 2012, EY 2013, EY 2014, EY 2015, or EY 2016) and six water treatment blocks were also considered
Table 3. ANOVA results of the effect of season (the winter–spring, the spring–summer, or the summer–autumn cropping season), water treatment (continuously flooding or alternate wetting and drying), and straw treatment (all raw straw returned, all straw-ash returned, or no straw returned) on the annually produced biomass carbon of grain (a), straw (c), roots (e), and all (grain + straw + roots) (g), annually produced biomass nitrogen of grain (b), straw (d), roots (f), and all (grain + straw + roots) (h)), the C/N ratio of grain (i) and straw (j), and the grain N content ((k): mg N grain−1 and (l): mg N g−1) at rice harvest. As random effects, the experimental year (EY 2012, EY 2013, or EY 2014) and six water treatment blocks were also considered
The amounts of produced rice straw biomass were also affected by water and rice straw treatments. The amounts produced in AWD plots became significantly (p < 0.01) smaller than those in CF plots (). The amounts produced in SR plots became significantly (p < 0.01) larger than those in the other rice straw treatment plots ( and Fig. S3(b)).
3.2. Irrigation and soil redox potential
Irrigation was done as planned (, d, f, h, j, l)), and AWD reduced irrigation water use by 43% on average from EY 2013 to EY 2016 ()). Under AWD, there was no standing water during 39.5% (in average) of the period from 1 week after seeding to 2 weeks before the expected harvest day (during the period, CF plots were flooded continuously). In CF plots, the Eh values of 5-cm deep soil were low from the start of each cropping season, dropped to nearly −200 mV approximately 2 weeks after seeding and then mostly (except the approximately 2-week drainage periods before harvest) remained below 0 mV during the rice cropping seasons, irrespective of rice straw treatment or rice cropping season (, g, k)), In contrast, in AWD plots, high Eh values of 5-cm deep soil were observed (, i, m), particularly during the S–S cropping season, when the canal water level became low, precipitation was average, and air temperature was high ()). The Eh values in EY 2012 tended to be lower than those in the following EYs (during the EYs, a 17 × 26 m plot was an irrigation management unit). During the EY, we irrigated to the three plots in a 51 × 26 m block at once when one of the three plots reached a criterion for irrigation, and the intensity of water level decrease tended to be milder than that of the following EYs (, h, l)).
Figure 1. Variation of air temperature (°C) ((a)), average values (n = 3) of field water levels (cm) ((b), (d), (f), (h), (j), and (l)), and Eh at 5-cm-deep soil (mV) ((c), (e), (g), (i), (k), and (m)) throughout the experimental period (experimental years (EY) 2012–2016 during November 2011 – November 2016). Each EY had three crops in the order of the winter–spring rice (W–S), the spring–summer rice (S–S), and the summer–autumn rice (S–A). (b), (c), (f), (g), (j), and (k) show those values of the continuously flooded field-water treatment (CF), and (d), (e), (h), (i), (l), and (m) show those of the alternate wetting and drying field-water treatment (AWD). (b)–(e), (f)–(i), and (j)–(m) show those of all raw straw return treatment (SR) plots, all straw-ash return treatment (SA) plots, and no straw return treatment (S0), respectively. The 0-cm water level corresponds with the level of the soil surface of the experimental field. The periods shown by the shaded bars are the flooding fallow periods between the harvest of the S–A crop and the sowing of the next W–S crop (water levels above 15 cm are not shown)
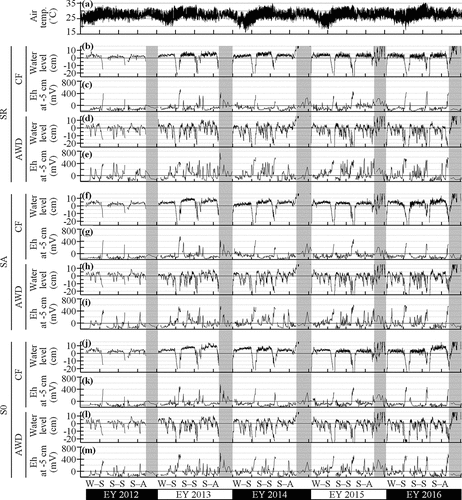
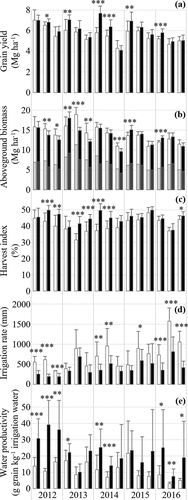
Figure 2. Rice grain yield (Mg ha−1) (a), aboveground biomass (Mg ha−1) (b), harvest index (%; rice grain yield/aboveground biomass) (c), irrigation rate (mm) (d), and water productivity (g grain kg−1 irrigation water) (e) at respective rice harvests (rice straw treatments are not taken into account). Rice grain yields and aboveground biomass are shown for 14% moisture content equivalent. Values of continuously flooded field-water treatment (CF) and of the alternate wetting and drying field-water treatment (AWD) are shown respectively as solid-white and solid-black bars, which are arranged in chronological order from left to right, started from the winter–spring crop of the experimental year 2012 (all years shown are experimental years). Bars shaded and unshaded in (b) show straw biomass and grain biomass, respectively. Error bars show standard deviations (n = 9). Significant differences between CF and AWD analyzed according to Student t test are shown as *, **, and ***, respectively denoting significance at 10%, 5%, and 1%
3.3. Harvest data
3.3.1. Effects of water treatments
3.3.1.1. Yield components
In the yield components, the percentages of filled spikelets became significantly (p < 0.01) higher at AWD than CF () by 3.5% on average in EYs 2012–2016 ()); and in EYs 2012, 2013, 2014, 2015, and 2016, respectively, by 0.4–3.2%, 7.8–11.1%, 2.7–4.3%, −0.2–1.9%, and −0.2–5.5% when those of the same straw treatments of respective EYs are compared (Fig. S4(d)). No significant difference was found in the other yield components (panicle number, spikelet number, and grain weight) between AWD and CF ( and , c, e), S4(b), S4(c), and S4(e)).
Figure 3. SPAD values of flag leaves (a), panicle numbers (m−2) (b), spikelet numbers (panicle−1) (c), % of filled spikelet (number of filled spikelet/number of total spikelet) (d), and grain weights (g 1000-filled spikelets) (e) at respective rice harvests (rice straw treatments are not taken into account). Grain weights are shown for 14% moisture content equivalent. The values of the continuously flooded treatment (CF) and of the alternate wetting and drying field-water treatment (AWD) are shown respectively as solid-white and solid-black bars, which are arranged in chronological order from left to right, started from the winter–spring crop of the experimental year 2012 (all years shown are experimental years). Error bars show standard deviations (n = 9). Significant differences between CF and AWD analyzed according to Student t tests are shown as *, **, and ***, respectively denoting significance at 10%, 5%, and 1%
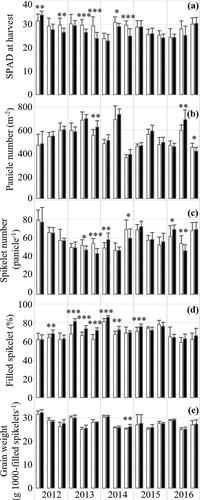
Among the cropping seasons, the panicle number and total spikelet (the product of panicle number and spikelet number) were significantly (p < 0.05) the highest in the S–S cropping season, during which solar radiation was the strongest among the cropping seasons (Tables S2 and S3), and not significantly different between the W–S and S–A cropping seasons ( and Figs. S4(b) and S4(c)). On the other hand, the grain weight was significantly (p < 0.01) the heaviest in the W–S cropping season, during which nighttime temperature (5-year average of the seasonal daily minimum temperature: 22.4 °C) were lower than those of the S–S (24.7 °C) and S–A cropping seasons (24.9 °C) ()), and not significantly different between the S–S and S–A cropping seasons ( and Fig. S4(e)). Consequently, the product of the above total spikelets and grain weight was not significantly different between the W–S and S–S cropping seasons and significantly (p < 0.01) the lightest in the S–A cropping season ().
3.3.1.2. Grain yield
The rice yields became significantly (p < 0.01) higher at AWD than CF () by 8.9% on average in EYs 2012–2016 ()); and in EYs 2012, 2013, 2014, 2015, and 2016, respectively, by −5.7–17.9%, 1.2–24.4%, −11.1–35.9%, 0.6–28.5%, and −0.8–13.6% when those of the same straw treatments of respective cropping seasons are compared (Fig. S3(a)) and by 2.6–4.9%, 4.4–12.7%, 13.0–18.7%, 2.8–14.8%, and 4.9–6.7% when those of the same straw treatments of respective EYs are compared. The AWD’s effect on rice yield increase in EYs 2013–2016 tended to be highest in the W–S cropping season, followed by the S–S and S–A cropping seasons, in that order ()), respectively, by −5.7–35.9%, 0.6–23.3%, and −11.1–17.9% when those of the same straw treatments of respective cropping seasons are compared (Fig. S3(a)).
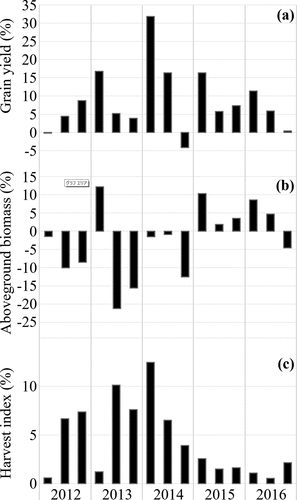
Figure 4. Rice grain yield (%) (a), aboveground biomass (%) (b), and harvest index (%) (c) at respective rice harvests (rice straw treatments are not taken into account) increased by the alternate wetting and drying field-water treatment (AWD), compared with the continuously flooded field-water treatment (CF). Bars are arranged in chronological order from left to right, started from the winter–spring crop of the experimental year 2012 (all years shown are experimental years)
3.3.1.3. Aboveground biomass
Annual aboveground biomass produced in AWD plots became significantly (p < 0.05) smaller than that in CF plots during EYs 2012–2016 ( and )) by 2.5–11.1%, 6.3–12.2%, 0.2–8.1%, −11.7–0.9%, and −4.4 – −0.7%, respectively, in EYs 2012, 2013, 2014, 2015, and 2016 when those of the same straw treatments are compared (Fig. S3(b)).
3.3.1.4. Root biomass and length density
No significant (p > 0.1) effect of field water treatments on root biomass C ( and Fig. S5(a)), root biomass N ( and Fig. S5(b)), root biomass ( and Fig. S7), or root length density ( and Fig. S8) was found.
Table 4. Pearson’s correlation coefficients (r) between the root length density on heading day and the rice harvest and the panicle number, spikelet number, percentage of filled spikelet (number of filled spikelet / number of total spikelet), grain weight, rice yield, SPAD value at harvest, aboveground biomass, and the harvest index (rice yield / aboveground biomass) measured in 12 rice cropping seasons (winter–spring, spring–summer, and summer–autumn cropping seasons in EYs 2013, 2014, 2015, and 2016 (n = 216 (18 plots × 3 cropping seasons in each year × 4 years))
3.3.1.5. Harvest index
The harvest indexes became significantly (p < 0.01) higher at AWD than CF () by 4.4% on average in EYs 2012–2016 ()); and in EYs 2012, 2013, 2014, 2015, and 2016, respectively, by −0.5–10.5%, −2.3–14.6%, 1.7–12.8%, −1.6–7.0% and −1.0–3.6% when those of the same straw treatments of respective cropping seasons are compared (Fig. S3(c)) and by 3.5–6.0%, 5.0–7.5%, 7.5–8.6%, 0.4–3.8%, and 0.3–2.2% when those of the same straw treatments of respective EYs are compared.
3.3.1.6. Leaf color
The SPAD values at harvest of AWD became significantly (p < 0.05) lower than those of CF (), showing clear differences in EYs 2013 and 2014 () and S4(a)).
3.3.1.7. Nitrogen in grains and straw
N contents in rice straw of AWD also became significantly (p < 0.01) lower than those of CF ( and Fig. S5(b)). Annually produced rice biomass N, which consists of grain N, straw N, and root N, at AWD plots became nearly always smaller than that at CF, irrespective of rice straw treatment or EY by 2.5–12.8%, 5.4–15.2%, and −0.2–19.1%, respectively, in EYs 2012, 2013, and 2014 when those of the same straw treatments are compared (Fig. S5(b)). The N contents in rice grains produced in AWD plots also became significantly (p < 0.1) lower than those in CF plots ( and Fig. S6). The effect of AWD on the increase in the C/N ratio of rice grains in EYs 2012–2014 was the weakest during the W–S cropping season, followed by the S–S and S–A cropping seasons, respectively, in order of −0.5–2.4, 0.3–4.5, and 2.3–6.1 when those of the same straw treatments of respective cropping seasons are compared (Fig. S5(c)).
3.3.2. Effect of rice straw treatments
SR had significantly (p < 0.01) increased straw biomass and aboveground biomass production ( and Fig. S3(b)) compared to the other rice straw treatments, but SR had significantly (p < 0.01) decreased harvest index ( and Fig. S3(c)). Consequently, no significant effect of the rice straw treatment was found for rice yields ( and Fig. S3(a)); and for yield components ( and Fig. S4), root biomass ( and Fig. S7), root biomass C and N ( and Figs. S5(a) and S5(b)), nor root length density ( and Fig. S8) as well.
4. Discussion
4.1. The effect of AWD
4.1.1. Annual effect
The AWD irrigation technique was developed as a water-conservation technique for irrigated rice. The technique has naturally been applied mostly to water-scarce areas. For this study, however, we applied the technique to an area abundant in water resources, a typical farmer’s triple rice cropping alluvial paddy of the Mekong Delta. Results obtained from this 5-year study conducted throughout 15 rice cropping seasons provide a piece of evidence that the rice yield of triple rice cropping alluvial paddies of the Mekong Delta can be increased simply by introducing AWD, irrespective of rice straw treatment or cropping season ( and , , and S3(a)). The case where the AWD increased the rice yield as in this study is exceptional. As reviewed by Lampayan et al. (Citation2015) for AWD and reported by Itoh et al. (Citation2011) on prolonged mid-season drainage, the correct introduction of those irrigation techniques did not statistically significantly reduce the rice yield but seldom increased it. Because the triple rice cropping paddies of the delta are submerged nearly year-round, the rice plants of the delta tend to suffer damage as a result of the continuously reductive soil environment (, g, k)), which includes toxicity of hydrogen sulfide, organic acids, and iron (Yoshida Citation1981). The delta’s soil tends to have a high sulfur content and hence has the potential to damage rice roots by hydrogen sulfide produced by the reduction of sulfate. Even at some 0–10-cm-deep topsoils of the experimental field of this study that is classified into alluvial soil, we observed markedly low soil pH(H2O2). The pH(H2O2) we observed was in a range of 2.94–4.77 (n = 18). Although this study is not aimed at elucidating substances that affected the rice yield, below we discuss which functions of rice in the AWD environment were superior to those in the CF environment in terms of achieving the high grain yield.
Giving mild water stress to rice, in particular during the ripening stage, is well known to activate the oxidation capacity of rice roots, to hasten rice plant body senescence, to shorten the ripening period, and to increase the remobilization of assimilation from the rice straw to its grains (Kobata and Takami Citation1981; Nicolas et al. Citation1985; Palta et al. Citation1994; Asseng. and Van Herwarrden Citation2003; Plaut et al. Citation2004) although continuous-flooding field-water management and surplus N fertilizer application to irrigated lowland rice paddies often result in excessive vegetative growth in rice, delay in ripening, underdeveloped root systems, unhealthy canopy structure, and a lower harvest index (Yang and Zhang Citation2010). In this study, most of the common-sense points presented above were reconfirmed. AWD significantly increased the percentage of filled spikelets (p < 0.01; and ) and S4(d)), the grain yield (p < 0.01; and ), , and S3(a)), and the harvest index (p < 0.01; and ), , and S3(c)). In addition, AWD significantly (p < 0.05) decreased the SPAD value at harvest ( and ) and S4(a)), which is known to correlate positively with the N content of a leaf and, in the experiment, was particularly strongly negatively correlated (p < 0.01, r = – 0.41, and n = 270) with the percentage of filled spikelets. From those results, the increase in grain yield by AWD is regarded as having been caused by the promotion of nutrient translocation in rice by AWD. On the other hand, AWD significantly decreased not only straw biomass (p < 0.01; and ) and S3(b)) but also aboveground biomass (p < 0.05; and ) and S3(b)), which includes the rice grain yield, without significantly affecting root biomass at harvest ( and Figs. S7(f)–(j)). The above results indicate that AWD decreased whole rice body biomass, but promoted nutrient translocation in rice, and as a result of those negative and positive effects, the grain yield was increased by AWD because the latter positive effect was greater than the former negative effect.
The decrease in straw biomass production by AWD must function to reduce greenhouse gas emissions. As summarized by e.g., Ogle et al. (Citation2019), it is commonly known that rice straw application to paddy fields strongly influences methane (CH4) emissions. Actually, according to Hong Van et al. (Citation2014), 55.6% of the rice straw produced in the hamlet where we conducted the experiment was incorporated directly into paddy soil (the stubble remaining on the rice field was regarded as having been incorporated directly into paddy soil). In addition, according to the same Hong Van et al. (Citation2014), 23.0% of the rice straw produced in the hamlet was burned directly in the field (the stubble remaining on the rice field was regarded as having been incorporated directly into paddy soil without burning). Through the burning processes, the rice straw produced in the S0 plots elicited greenhouse gases: not only carbon dioxide but also carbon monoxide, CH4, nitrous oxide, and non-methane volatile organic carbon (Arai et al. Citation2015).
Regarding the effect of AWD on rice root indexes, reportedly, the use of AWD for transplanting rice increased root biomass and its oxidation activity, promoted the translocation of photo-assimilate, and increased the harvest index and the grain yield (Yang et al. Citation2004; Yang and Zhang Citation2010). In this study, however, AWD did not markedly affect the root biomass ( and Fig. S7), root biomass C ( and Fig. S5(a)), root biomass N ( and Fig. S5(b)), nor root length density ( and Fig. S8). Because seeds had been broadcast at a high rate (231 kg dry weight ha−1 season−1) on the experimental field according to a locally conventional way, the rice roots might have generally been under an overcrowding condition (Figs. S7 and S8). Therefore, there might not have been sufficient room for roots to grow further, with response to the AWD condition. The root length density was correlated negatively with the aboveground biomass () and positively with the harvest index (). Results suggest that the development of roots correlated with the translocation of photo-assimilate and N retranslocation more closely than with the biomass production and the nutrient absorption capability, at least in the study site environment. Further research is needed to clarify why the effects of AWD on roots were not significant in this study environment.
Table 5. ANOVA results of the effect of season (the winter–spring, the spring–summer, or the summer–autumn cropping season), water treatment (continuously flooding or alternate wetting and drying), and straw treatment (all raw straw returned, all straw-ash returned, or no straw returned) on the irrigation rate and grain productivity of irrigation water. As random effects, the experimental year (EY 2013, EY 2014, EY 2015, or EY 2016) and six water treatment blocks were also examined
The N contents in grains (Fig. S5(b)) and straw (Fig. S5(b)) and the SPAD value read at harvest (Fig. S4 (a)) of AWD became significantly (p < 0.1 (), 0.01 (), and 0.01 (), respectively) lower than those of CF. In the case of wheat grains, Martre et al. (Citation2003) reported that N contents in the grains were source-regulated. Although we have almost no literature to discuss those of rice, our results indicate that the effect of the decreased amount of N absorbed by rice under AWD directly affected the N contents in grains and straw at harvest. Because the high protein content in rice grains tends to spoil rice palatability (Miyamori Citation1996) through the inhibition of rice starch’s water absorption, swelling, and gelatinization (Matsuda et al. Citation1997), introduction of AWD to the experimental environment might increase the market value of rice. Because surplus N accumulation in stems and leaves of rice causes negative influences including lodging, mutual shading, and susceptibility to disease (Ma Citation2004), it can be also expected that those negative influences under the surplus N application environment can be mitigated using AWD irrigation.
4.1.2. Seasonal effect
Among the cropping seasons, the rice-yield-increasing effect of AWD was significantly (p < 0.1) different ( and )). It was most greatly increased in the W–S cropping season, followed by the S–S and S–A cropping seasons, in that order. Because different cultivars (Jasmine 85 for the W–S cropping season and OM4218 for the S–S and S–A cropping seasons) were used in this study, adopting the most popular one for each cropping season in the area, the influence of the cultivars cannot be ignored when discussing the difference depending on the season. However, because OM4218 also achieved the greatest rice-yield-increasing effect of AWD and the highest rice yield itself in a W–S cropping season among five consecutive cropping seasons including the previous two cropping seasons and the following two cropping seasons in a supplementary experiment (data not shown), we discuss below, knowing that the effects of cultivars cannot be ignored. The supplementary experiment was conducted in a 4 × 4 m sub-plot in each 17 × 26 m plot of the current experiment during the W–S cropping season of EY 2014. In the sub-plot, we used OM4218 in place of Jasmine 85.
Not only the rice-yield-increasing effect of AWD but also the rice yield itself ( and ) and S3(a)) and aboveground biomass ( and ) and S3(b)) were significantly (p < 0.1) different among the cropping seasons and most greatly increased in the W–S cropping season, followed by the S–S and S–A cropping seasons, in that order. From the viewpoint of the photosynthetic capacity, however, this result sounds strange because, based on the daily global solar radiation at the Hydro-meteorology Center of Can Tho City during 15 November 2012–9 June 2014 (Table S2) and the photosynthetic active radiation in the Mekong Delta during 15 November 2015–10 September 2019 (Table S3), it is very likely that the amount of solar radiation that can be used for photosynthesis was the maximum in the S–S cropping season not in the W–S cropping season. Despite that, the rice yield and the aboveground biomass were the highest in the W–S cropping season. One of the reasons must have been the lowest nighttime and daily mean temperatures during the W–S cropping season ()). In the S–S cropping season, it is considered that the maintenance respiration rate must have been kept lowest due to the lowest nighttime and daily mean temperatures (Long Citation1991; Amthor Citation2000) and hence that the proportion of carbon assimilate that was available for the growth and yield must have increased (Monteith Citation2007).
Regarding the effect of the nighttime temperature, Peng et al. (Citation2004) reported that the grain yield and aboveground biomass of rice decreased as the nighttime temperature increased and that the yield decline resulted from the panicle number decrease because of less tillering as the nighttime temperature increased. In our study, the panicle number was significantly (p < 0.05) different among the cropping seasons (), but the highest was that of the S–S rice not the W–S rice (Fig. S4(b)), the nighttime temperature during which cropping season was the lowest ()). Also, although the nighttime temperatures during the S–S and S–A cropping seasons were similar, the panicle number and the amount of solar radiation (Tables S2 and S3) were much higher in the S–S cropping season. The above indicates that the amount of solar radiation affected the panicle number more than the nighttime temperature.
Another possible factor that maximized the rice yield and aboveground biomass in the W–S cropping season is the seasonal differences in the N environment in soil. As a result of a single year observation of soluble N and microbial biomass N in the topsoil of the experimental plots conducted during November 2011 – November 2012, both of the N concentrations were also the highest in the W–S cropping season, followed by the S–S and S–A cropping seasons (Fig. S9). This indicates that the available N concentration in soil increased during the around-2-month no-crop flood season, which existed between the S–A and W–S cropping seasons, and decreased until the next flood season. This annual cyclical variation of available N concentration in soil might have been one of the factors that caused the seasonal differences in N content in rice. Actually, both rice biomass N ( and Fig. S5(b)), which consists of aboveground biomass N and root biomass N, and grain N contents ( and Fig. S6) were significantly (p < 0.1) different among the cropping seasons and most greatly increased in the W–S cropping season, followed by the S–S and S–A cropping seasons, in that order. The C/N ratios of rice grains and straw were also significantly (p < 0.1) different among the cropping seasons ( and Figs. S5(c and d, respectively)), the lowest in the W–S cropping season, followed by the S–S and S–A cropping seasons, in that order. Because the chlorophyll content is considered to be positively correlated with the N content of a leaf, the highest available N content in soil might also have been another factor that helped the rice yield and aboveground biomass of the W–S rice increase through strengthening its photosynthetic capacity.
From the above, the reason why the rice yield and aboveground biomass of the W–S rice were the highest although the amount of solar radiation that can be used for photosynthesis during the same season was not the maximum can be explained as follows; the positive effect caused by the low nighttime and daily mean temperatures and high available N content in soil during the season exceeded the negative effect caused by not the highest amount of solar radiation during the season. In other words, it can be explained that the rice yield and aboveground biomass of the W–S rice were the highest because the source capacity of the same rice was the largest (the term ‘source capacity’ here takes into account not only the photosynthetic capacity of rice, which is affected by the amount of solar radiation and available soil N, but also the amount of the maintenance respiration of rice, which is affected by nighttime and daily mean temperatures). The maximum effect of AWD on increasing rice yields in the W–S cropping season can be explained by this largest source capacity of the W–S rice and the difference in the strength of the nutrient translocation capacity of rice between AWD and CF. The increase in source capacity of rice during the W–S cropping season led to the significant increase in rice yield under the AWD environment with a high nutrient translocation capacity, whereas, under the CF environment with a low nutrient translocation capacity, the increase in source capacity of rice during the same season did not lead to an increase in rice yield comparable to that under AWD.
Comparing the effects of the nighttime and daily mean temperatures and the amount of available soil N, the former would affect the rice yield more generally in the Mekong Delta because the highest yields of the three cropping seasons have been observed in the W–S cropping season even in other Mekong Delta’s triple-cropping rice paddies surrounded by high-dykes that prevent floodwater intrusion (e.g., Nhan et al. Citation2016; Taminato and Matsubara Citation2016). It is feared that the rice-yield-increasing effect of AWD brought by the low nighttime and daily mean temperatures will be attenuated by the rise of those temperatures caused by the global warming in the future. Again, we discuss the above based on the results obtained using a different rice cultivar for the W–S cropping season from that used in the other cropping seasons. The effect of nighttime and daily mean temperatures on rice yields needs to be confirmed by more rigorous experiments.
4.2. The effect of rice straw treatments
The rice straw treatments did not significantly affect the rice yield ( and Fig. S3(a)) or the yield per irrigation water use (). One explanation for this result might be the amount of rice biomass produced and retained in the plots. As a result of adoption of the local farmers’ conventional hand-reaping harvest manner for this experiment, two-thirds or more of the produced rice straw biomass was left on the plots as stumps, irrespective of rice straw treatment (). Therefore, even S0 plots, from which all hand-reaped rice straw had been taken out, had received two thirds of the produced rice straw biomass together with the whole root biomass that had been produced three times a year. The input of this considerable amount of rice biomass even to S0 might have assisted in making the differences among the rice straw treatments non-significant. Another explanation might be the water environment. Under CF treatment, the field plots were submerged nearly year-round (, f, j)). All CF plot soils, even S0 soils, might not have had sufficient oxidation capacity. Actually, in CF plots, the Eh values of 5-cm deep soil decreased quickly after seeding, dropped to around −200 mV approximately 2 weeks after seeding and then mostly (except the approximately 2-week drainage periods before harvest) remained below 0 mV during the rice cropping seasons, irrespective of rice straw treatment or rice cropping season (, g, k)). From the possible reasons explained above, the rice straw treatments might have non-significantly affected the soil redox condition and the rice yield.
5. Conclusion
This five-year study, conducted at a farmer’s rice paddy throughout 15 rice cropping seasons, produced direct evidence suggesting that the rice yield of triple rice cropping alluvial paddies of the Mekong Delta can be increased simply by introducing AWD irrigation technique. The increase in rice yield by AWD was found with an increase in harvest index and a decrease in above ground biomass and nitrogen content, indicating that it was due to the promotion of nutrient translocation capacity of rice by AWD. The effect of AWD was particularly enhanced in the winter–spring cropping season, during which the nighttime and daily mean temperatures were the lowest of the three cropping seasons. As summarized by Ogle et al. (Citation2019), since it is well known that methane emissions from multiple-aerated rice paddies are significantly lower than those from continuously flooded, this piece of evidence has the potential to encourage farmers to voluntarily adopt AWD irrigation technique that will also lead to a reduction in methane emission from rice paddies.
Disclosure of potential conflicts of interest
No potential conflict of interest was reported by the author(s).
Supplemental Material
Download Zip (29.9 MB)Acknowledgments
This study was implemented under the Research Project “Development of Agricultural Technologies in Developing Countries to Respond to Climate Change” of Japan International Research Center For Agricultural Sciences (JIRCAS) during Japanese fiscal years 2011–2016. A portion of this study was supported by International Research Network Program on Global Issues (during Japanese fiscal years 2010–2012) of the Agriculture, Forestry and Fisheries Research Council, Ministry of Agriculture, Forestry and Fisheries of Japan, and by JSPS KAKENHI Grant Number JP15H05267 (during Japanese fiscal years 2015–2017). Research product of solar radiation (produced from Himawari-8) that was used in this paper was supplied by the P-Tree System, Japan Aerospace Exploration Agency (JAXA). Dr. Tran Kim Tinh, Can Tho University, and his research group helped us considerably when setting up the experiment in the field including their design of the manual water-level monitoring system. Dr. Nguyen Tran Thien Khanh, An Giang University, and Dr. Nobuko Katayanagi/Takemoto, then of JIRCAS, also helped us considerably in the preparation of the field experiment. Persons in Tan Loi 2 Hamlet including Mr. Pham Thanh Ut and Ms. Tran Thi Le Thuy provided adequate and constant care of the experimental field. Without their care, the experiment would have not been conducted successfully.
Supplementary material
Supplemental data for this article can be accessed here
Additional information
Funding
Related Research Data
References
- Amthor, J. S. 2000. “The McCree–de Wit–Penning De Vries–Thornley Respiration Paradigms: 30 Years Later.” Annals of Botany 86 (1): 1–20. doi:10.1006/anbo.2000.1175.
- Arai, H., Y. Hosen, N. P. Hong Van, T. T. Nga, N. H. Chiem, and K. Inubushi. 2015. “Greenhouse Gas Emissions Derived from Rice Straw Burning and Straw-mushroom Cultivation in a Triple Rice Cropping System in the Mekong Delta.” Soil Science and Plant Nutrition 61 (4): 719–735. doi:10.1080/00380768.2015.1041862.
- Asseng., S., and A. F. Van Herwarrden. 2003. “Analysis of the Benefits to Wheat Yield from Assimilates Stored Prior to Grain Filling in a Range of Environments.” Plant and Soil 256 (1): 217–219. doi:10.1023/A:1026231904221.
- Bouman, B., R. Barker, E. Humphreys, T. P. Tuong, G. Atlin, J. Bennett, D. Dawe, et al. 2007. “Rice: Feeding the Billions.” In Water for Food, Water for Life: A Comprehensive Assessment of Water Management in Agriculture, edited by D. Molden, 515–549. London and Sterling, VA: Earthscan.
- Chidthaisong, A., N. Cha-un, B. Rossopa, C. Buddaboon, C. Kunuthai, P. Sriphirom, S. Towprayoon, T. Tokida, A. T. Padre, and K. Minamikawa. 2018. “Evaluating the Effects of Alternate Wetting and Drying (AWD) on Methane and Nitrous Oxide Emissions from a Paddy Field in Thailand.” Soil Science and Plant Nutrition 64 (1): 31–38. doi:10.1080/00380768.2017.1399044.
- Dobermann, A., and T. H. Fairhurst. 2000. Rice: Nutrient Disorders & Nutrient Management. Potash & Phosphate Institute of Canada, and International Rice Research Institute: Potash and Phosphate Institute.
- FAOSTAT ( accessed July 17, 2020). URL:http://faostat.fao.org/
- General Statistics Office of Vietnam. 2019. Statistical Yearbook of Vietnam 2018. Hanoi: Statistical Publishing House.
- Hong Van, N. P., T. T. Nga, H. Arai, Y. Hosen, N. H. Chiem, and K. Inubushi. 2014. “Rice Straw Management by Farmers in a Triple Rice Production System in the Mekong Delta, Vietnam.” Tropical Agriculture and Development 58: 155–162. https://www.jstage.jst.go.jp/article/jsta/58/4/58_155/_pdf
- Itoh, M., S. Sudo, S. Mori, H. Saito, T. Yoshida, Y. Shiratori, S. Suga, et al. 2011. “Mitigation of Methane Emissions from Paddy Fields by Prolonging Midseason Drainage.” Agriculture, Ecosystems & Environment 141 (3–4): 359–372. doi:10.1016/j.agee.2011.03.019.
- Kien, N. V., N. H. Han, and R. Cramb. 2020. “Trends in Rice-Based Farming Systems in the Mekong Delta.” In White Gold: The Commercialisation of Rice Farming in the Lower Mekong Basin, edited by R. Cramb, 347–373. Singapore: Springer Nature Singapore Pte . doi:10.1007/978-981-15-0998-8.
- Kobata, T., and S. Takami. 1981. “Maintenance of the Grain Growth in Rice Subject to Water Stress during the Early Grain Filling.” Japanese Journal of Crop Science 50 (4): 536–545. doi:10.1626/jcs.50.536.
- Lampayan, R. M., R. M. Rejesus, G. R. Singleton, and B. A. M. Bouman. 2015. “Adoption and Economics of Alternate Wetting and Drying Water Management for Irrigated Lowland Rice.” Field Crops Research 179: 95–108. doi:10.1016/j.fcr.2014.10.013.
- Long, S. P. 1991. “Modification of the Response of Photosynthetic Productivity to Rising Temperature by Atmospheric CO2 Concentrations: Has Its Importance Been Underestimated?” Plant, Cell & Environment 14 (8): 729–739. doi:10.1111/j.1365-3040.1991.tb01439.x.
- Ma, J. F. 2004. “Role of Silicon in Enhancing the Resistance of Plants to Biotic and Abiotic Stresses.” Soil Science and Plant Nutrition 50 (1): 11–185. doi:10.1080/00380768.2004.10408447.
- Martre, P., J. R. Porter, P. D. Jamieson, and E. Triboï. 2003. “Modeling Grain Nitrogen Accumulation and Protein Composition to Understand the Sink/Source Regulations of Nitrogen Remobilization for Wheat.” Plant Physiology 133 (4): 1959–1967. doi:10.1104/pp.103.030585.
- Matsuda, H., H. Fujii, Y. Shibata, C. Kominami, S. Hasegawa, K. Oobushi, and H. Andou. 1997. “Effect of Number of Grains per Amount of N at Heading and Amount of N in Grain on the Protein Content of Milled Rice.” Japanese Journal of Soil Science and Plant Nutrition 68: 501–507.
- Miyamori, Y. 1996. “Role of Si in Production of Low Protein Rice and Diagnosis Parameters.” Japanese Journal of Soil Science and Plant Nutrition 67: 696–700.
- Monteith, J. L. 2007. “Climatic Variation and the Growth of Crops.” Quarterly Journal of the Royal Meteorological Society 107 (454): 749–774. doi:10.1002/qj.49710745402.
- Murakami, T., K. Yamada, and S. Yoshida. 1999. “Improved Method for Easy and Rapid Determination of Root Length of Vegetables.” Soil Science and Plant Nutrition 45 (2): 471–478. doi:10.1080/00380768.1999.10409361.
- Nhan, P. P., L. V. Hoa, C. N. Qui, N. X. Huy, T. P. Huu, B. C. T. MacDonald, and T. P. Tuong. 2016. “Increasing Profitability and Water Use Efficiency of Triple Rice Crop Production in the Mekong Delta, Vietnam.” The Journal of Agricultural Science 154 (6): 1015–1025. doi:10.1017/S0021859615000957.
- Nicolas, M. E., H. Lambers, R. J. Simpson, and M. J. Dalling. 1985. “Effect of Drought on Metabolism and Partitioning of Carbon in Two Wheat Varieties Differing in Drought-tolerance.” Annals of Botany 55 (5): 727–747. doi:10.1093/oxfordjournals.aob.a086951.
- Ogle, S. M., S. J. Wakelin, L. Buendia, B. McConkey, J. Baldock, H. Akiyama, A. W. Kishimoto-Mo, et al.2019. “Crop Land.” In Volume 4: Agriculture, Forestry and Other Land Use, 2019 Refinement to the 2006 IPCC Guidelines for National Greenhouse Gas Inventories, edited by E. Calvo Buendia, K. Tanabe, A. Kranjc, J. Baasansuren, M. Fukuda, S. Ngarize, A. Osako, et al., 5.1–5.102. Switzerland: IPCC. https://www.ipcc-nggip.iges.or.jp/public/2019rf/pdf/19R_V4_advance.zip
- Palta, J. A., T. Kobata, N. C. Turner, and I. R. Fillery. 1994. “Remobilization of Carbon and Nitrogen in Wheat as Influenced by Postanthesis Water Deficits.” Crop Science 34 (1): 118–124. doi:10.2135/cropsci1994.0011183X003400010021x.
- Peng, S., J. Huang, J. E. Sheehy, R. C. Laza, R. M. Visperas, X. Zhong, G. S. Centeno, G. S. Khush, and K. G. Cassman. 2004. “Rice Yields Decline with Higher Night Temperature from Global Warming.” Proceedings of the National Academy of Sciences of the United States of America 101 (27): 9971–9975. doi:10.1073/pnas.0403720101.
- Plaut, Z., B. J. Butow, C. S. Blumenthal, and C. W. Wrigley. 2004. “Transport of Dry matter into Developing Wheat Kernels and Its Contribution to Grain Yield under Post-anthesis Water Deficit and Elevated Temperature.” Field Crops Research 86 (2–3): 185–198. doi:10.1016/j.fcr.2003.08.005.
- Samoy-Pascual, K., E. B. Sibayan, F. S. Grospe, A. T. Remocal, A. T-Padre, T. Tokida, and K. Minamikawa. 2019. “Is Alternate Wetting and Drying Irrigation Technique Enough to Reduce Methane Emission from a Tropical Rice Paddy?” Soil Science and Plant Nutrition 65 (2): 23–30. doi:10.1080/00380768.2019.1579615.
- Setyanto, P., A. Pramono, T. A. Adriany, H. L. Susilawati, T. Tokida, A. T. Padre, and K. Minamikawa. 2018. “Alternate Wetting and Drying Reduces Methane Emission from a Rice Paddy in Central Java, Indonesia without Yield Loss.” Soil Science and Plant Nutrition 64 (1): 23–30. doi:10.1080/00380768.2017.1409600.
- Sibayan, E. B., K. Samoy-Pascual, F. S. Grospe, M. E. D. Casil, T. Tokida, A. T. Padre, and K. Minamikawa. 2018. “Effects of Alternate Wetting and Drying Technique on Greenhouse Gas Emissions from Irrigated Rice Paddy in Central Luzon, Philippines.” Soil Science and Plant Nutrition 64 (1): 39–46. doi:10.1080/00380768.2017.1401906.
- Son, N.-T., C.-F. Chen, C.-R. Chen, H.-N. Duc, and L.-Y. Chang. 2013. “A Phenology-based Classification of Time-series MODIS Data for Rice Crop Monitoring in Mekong Delta, Vietnam.” Remote Sensing 6 (1): 135–156. doi:10.3390/rs6010135.
- Tamai, K., and J. F. Ma. 2008. “Reexamination of Silicon Effects on Rice Growth and Production under Field Conditions Using a Low Silicon Mutant.” Plant and Soil 307 (1–2): 21–27. doi:10.1007/s11104-008-9571-y.
- Taminato, T., and E. Matsubara. 2016. “Impacts of Two Types of Water-saving Irrigation System on Greenhouse Gas Emission Reduction and Rice Yield in Paddy Fields in the Mekong Delta.” IDRE Journal. 303(84): I_195–I_200. Available online: https://www.jstage.jst.go.jp/article/jsidre/84/3/84_I_195/_pdf ( accessed on 4 November 2020). (In Japanese)
- Tennant, D. 1975. “A Test of A Modified Line Intersect Method of Estimating Root Length.” Journal of Ecology 63 (3): 995–1001. doi:10.2307/2258617.
- Tran, D. D., G. V. Halsema, P. J. G. J. Hellegers, and F. Ludwig. 2018a. “Questioning Triple Rice Intensification on the Vietnamese Mekong Delta Floodplains: An Environmental and Economic Analysis of Current Land-use Trends and Alternatives.” Journal of Environmental Management 217: 429–441. doi:10.1016/j.jenvman.2018.03.116.
- Tran, D. H., T. N. Hoang, T. Tokida, A. Tirol-Padre, and K. Minamikawa. 2018b. “Impacts of Alternate Wetting and Drying on Greenhouse Gas Emission from Paddy Field in Central Vietnam.” Soil Science and Plant Nutrition 64 (1): 14–22. doi:10.1080/00380768.2017.1409601.
- Yang, C., L. Yang, Y. Yang, and Z. Quyang. 2004. “Rice Root Growth and Nutrient Uptake as Influenced by Organic Manure in Continuously and Alternately Flooded Paddy Soils.” Agricultural Water Management 70 (1): 67–81. doi:10.1016/j.agwat.2004.05.003.
- Yang, J., and J. Zhang. 2010. “Crop Management Techniques to Enhance Harvest Index in Rice.” Journal of Experimental Botany 61 (12): 3177–3189. doi:10.1093/jxb/erq112.
- Yoshida, S. 1981. Fundamentals of Rice Crop Science. Los Baños: International Rice Research Institute.