?Mathematical formulae have been encoded as MathML and are displayed in this HTML version using MathJax in order to improve their display. Uncheck the box to turn MathJax off. This feature requires Javascript. Click on a formula to zoom.
ABSTRACT
Previous studies have reported two major methods of increasing PR solubility; calcination and partial acidulation. In addition, soil water condition would influence the solubility of P fertilizers. However, the effects of local P fertilizers, namely calcined PR (CPR) and partially acidulated PR (PAPR) on rice yield under different soil water conditions have not been explored comprehensively. The aims of the present study were to evaluate the effects of local P fertilizers produced from PR in Burkina Faso under different soil water conditions and to propose local fertilizers with optimal application rates for different soil water conditions. The field experiments were conducted at four farmers’ fields with different ground-water levels (GWL). CPR, PAPR, and superphosphate were applied at rates of 0, 7.6, 15.3, and 30.5 kg P ha−1, respectively. Superphosphate mostly consists of water-soluble P fraction (WP), PAPR of WP and alkaline ammonium citrate-soluble P fraction (SP), and CPR of SP and 2% citric acid-soluble P fraction (CP). The solubility is in the order of WP > SP > CP. The GWL was monitored during the growing season, and yield components were observed. Results of multiple regression analysis showed that WP influenced grain yield under all soil water conditions, whereas SP only influenced grain yied at mean GWL > −24.7 cm. Therefore, PAPR with high WP has an advantage over CPR in the field with GWL > −18.7 cm, and both CPR and PAPR are effective in fields with GWL > −6.5 cm. The optimal application rate was 14.4 kg P ha−1 as WP in the field with low GWL (mean −29.2 cm), 15.2–15.9 kg P ha−1 as WP + SP in the field with middle GWL (mean −24.7 to −18.7 cm), and 11.1 kg P ha−1 as WP + SP in the field with high GWL (mean −6.5 cm). According to the results, the optimal fertilizer types and application rates differ according to the soil water conditions.
1. Introduction
Rice is the most rapidly expanding food commodity, both in production and consumption, in sub-Saharan Africa (SSA) (USDA Citation2018). However, the average rice production in SSA is only around 2.1 Mg ha−1, which is far below the potential yield (USDA Citation2018). Low phosphorus (P) content in the highly weathered soils of SSA is a major constraint for rice production (Nishigaki et al. Citation2019; CitationSaito et al. 2001). According to (Bouwman, Beusen, and Billen Citation2009), global soil P balance will increase slowly, and soil P depletion may become a major problem in agricultural land. Consequently, many studies evaluated ways to increase rice production via P fertilizer application (Sahrawat et al. Citation2001; Savini et al. Citation2016; Vandamme et al. Citation2016). However, few farmers can access and utilize imported fertilizers, mainly because of the high cost incurred from long-distance transportation (Kelly Citation2006). Thus, local farmers may increase fertilizer input only if the fertilizers are available, affordable, and profitable for rice production (Tsujimoto et al. Citation2019). Nevertheless, global phosphate rock production has steadily increased (approximately 6 MMT per year) from 139.3 MMT in 2000 to 207.5 MMT in 2012 (Chowdhury et al. Citation2017).
Geological phosphate rock (PR) deposits occur throughout SSA (FAO Citation2004). According to the Burkina Faso Government, there is 100 MMT of PR in the Kodjari region of Burkina Faso (Van Straaten Citation2002). which could be exploited as a source of P as an alternative to expensive, imported P fertilizers. However, most PR deposits in SSA have been rarely utilized because of their low P content and reactivity (FAO Citation2004). Nakamura et al. (Citation2013) summarized the potential utilization of local PR for rice production and showed that direct application of local PR could improve rice yield in lowland fields. In contrast, other studies have stated that the direct application of local PR in SSA is ineffective (Fukuda et al. Citation2013; Sale and Mokwunye Citation1993). These conflicting results indicate that various factors influence the fertilization effect of PR, such as PR solubility, climate, and environmental conditions (Chien and Menon Citation1995a; Sale and Mokwunye Citation1993).
Another approach to improve rice production using local PR is to enhance P solubility (Nakamura et al. Citation2019). Partial acidulation of PR by sulfuric acid has been promoted promoted by the International Fertilizer Development Center as a solubilization method. Acidulation of PRs with sulfuric acid produces the phosphate component monocalcium phosphate, small amounts of dicalcium phosphate, and residual apatite in the amount dependent on the degrees of acidulation (Mizane and Rehamnia Citation2012). The positive effects of partially acidulated PR (PAPR) on rice production have been reported (Chien and Menon Citation1995b; Rahman Citation2018). The degree of solubility in PAPR increases with the addition of more sulfuric acid; however, the viscosity and acidity of the product also increase because of unbound sulfuric acid (Akiyama, Tsumita, and Wada Citation1992; CitationFrederick and Roth). Therefore, to secure adequate solubility, it is necessary to minimize the amount of sulfuric acid added. In contrast, Akiyama, Tsumita, and Wada (Citation1992) proposed the calcination procedure for PR in a temperature range of >900°C with alkaline carbonates to convert fluoride apatite into α-tricalcium phosphate and rhenania phosphate. Nakamura et al. (Citation2019) applied a modified version of this method to the low-grade PR from the Kodjari region and achieved more than 90% solubility in 2% citric acid. These authors Nakamura et al. (Citation2019) also demonstrated that calcinated PR (CPR) significantly increased rice production in pot experiments. However, the effects of PAPR and CPR on rice cultivation under different soil conditions remain poorly understood, especially in West Africa.
Along with increasing the grain yield on existing lands favorable for rice production, it would be necessary to expand rice cultivation into surrounding marginal lands to attain rice self-sufficiency in many West African countries (Van Oort et al. Citation2015). The major problem in these lands is poor soil water conditions. Hömberg and Matzner (Citation2018) and King et al. (Citation2015) have stated that soil water conditions are closely related to the solubilization, transportation, and hence availability of P in soil. Despite the negative effect permanent flooding has on lowland rice cultivation (De Bauw et al. Citation2019), P fertilization is generally considered to be more effective under flooded conditions than under upland conditions on similar soils (Dobermann et al. Citation1998); consequently, optimal local fertilizer application should differ according to soil water conditions.
Thus, this study aims to evaluate the fertilization effects of PAPR and CPR under different soil water conditions. We hypothesize that P fertilization would be more effective under optimal water conditions for rice cultivation. The results could facilitate the selection of optimal fertilization methods under different soil water conditions. If PAPR and CPR improve rice yield in fields with low ground-water level, they could facilitate the expansion of rice cultivation areas into more marginal lands of the Central Plateau of Burkina Faso.
2. Materials and methods
2.1. Study site
The field experiment was conducted in 2019 in Nassoulou Village (12°21′12.0ʺ N 2°07′37.4ʺ W), Central Plateau of Burkina Faso, West Africa. The village is located in the Sudanian Savanna and characterized by mid-latitude steppe and desert climate (BSh) according to the Köppen climate classification. In this region, rice cultivation is generally conducted in lowland riverine areas (bas fond in French). Using a digital surface model constructed based on ALOS World 3D-30 m images (JAXA Citation2018), a line transect was placed along a gentle slope, starting from the river bottom, with an average gradient of 0.8% (190 m in length). On the line transect, four farmer fields were selected, which were named Middle slope, Lower slope (1), Lower slope (2), and Lowland. The Middle slope was located 165–190 m from the river bottom, and the two fields on the lower slope were located 60–135 m from the river bottom. The Lowland was located on the river bottom. The Lowland has been used as a paddy field for a long time. The two sites on the lower slope were occasionally used for rice cultivation. The field on the Middle slope was mainly used for upland crop cultivation.
A soil profile survey was conducted in October 2018 in the Lowland (). The soil was classified as Ferric Lixisol (IUSS Working Group WRB Citation2015), which is distributed on the lower slopes extending into the river bottom, and has higher productivity mainly because of the deeper effective soil depth (Ikazaki et al. Citation2018a). The topsoil was characterized by high sand content and low carbon content, resulting in a weak soil structure. Clay content gradually increased with soil depth. The texture class changed from sandy loam at the surface to heavy clay at the bottom. Available P content was determined by both Bray-1 and Bray-2 methods in the profile and ranged from 0.26 to 1.79 and 1.00 to 3.25 mg P kg−1, respectively. Similar to other areas of the Sudan Savanna, the availability of P was quite low (Ikazaki et al. Citation2018b).
Table 1. Physico-chemical properties of lowland soils
2.2. Preparation of calcinated and partially acidulated phosphate rock
Two types of fertilizers were produced by partial acidulation and calcination method using PR from the Kodjari deposit (12°1′ N; 1°55′ E) in Burkina Faso. The PR contained 113 g P kg−1, and its 2% citric acid solubility was 31.1% of the total P. Total P content and solubility were similar to those documented previously (Nakamura et al. Citation2019; Zapata Citation2004). To prepare PAPR, we followed the acidulation method described by CitationFrederick and Roth (). The addition rate of sulfuric acid was determined based on the mineral composition of PR; 326.8 mL H2SO4 was used to 1 kg BPR to produce 100% acidulated phospate rock (PAPR100). Therefore, 245.1 mL H2SO4 was added to prepare PAPR75. In the present study, we employed PAPR75 as PAPR for the experiments. The calcination procedure described by Nakamura et al. (Citation2019) was used to prepare CPR. Fine powdered PR was mixed well with K2CO3 at a rate of 166 g K per kg PR. The components were mixed with distilled water, and then pressed to form coin-shaped pellets. The pellets were calcinated at 900°C for 10 min using a muffle furnace (FP32; Yamato Scientific Co., Ltd., Japan). Commercially available single superphosphate (SSP) was used.
The chemical properties of CPR, PAPR, and SSP were analyzed following the procedure outlined by the Food and Agricultural Materials Inspection Center (FAMIC Citation2013). The water-soluble P fraction (WP) corresponded to water solubility. The alkaline ammonium citrate soluble P fraction (SP) was defined as alkaline ammonium citrate solubility subtracted by water solubility. The 2% citric acid-soluble P fraction (CP) was defined as 2% citric acid solubility subtracted by alkaline ammonium citrate solubility. The residual P fraction (RP) was the P fraction not soluble in 2% citric acid.
2.3. Experimental design
A total of 10 treatments were established, namely P unfertilized control (CT) and P fertilized at 7.6, 15.3, and 30.5 kg P ha−1 using CPR, PAPR, and SSP, respectively. The application rate was set based on the recommendation of INERA (P1: 15.3 kg P ha−1), and 7.6 (P0.5) and 30.5 (P2) kg P ha−1 corresponded to a half and twice the recommended rate, respectively. Four replicates were set up based on a complete randomized block design. The experimental subplots measured 16 m2 (4 m × 4 m) in size with 1-m spacing between neighboring plots. A bund of about 30 cm height was established around each subplot to avoid any contamination by fertilization. For all treatments, 74 kg N ha−1 and 16.6 kg K ha−1 (correspond to 40 kg K2O ha−1) were applied as urea and potassium chloride (KCl), respectively. Urea, P fertilizers, and KCl were mixed well and applied about one week before seeding by broadcasting. Rice (Oryza sativa) was directly seeded on 8 July 2019 with 20 cm × 20 cm planting space. We used ‘FKR19,’ an improved variety registered by INERA, to adapt to the lowland rice cultivation in West Africa. The plants were harvested around the first week of October 2019. Total biomass, grain yield, and harvest index were measured.
2.4. Ground-water level measurement
Pipes (150 cm) were used for ground-water level (GWL) measurements and holes drilled at 120 cm from the top of the pipe. The pipes were then installed to a depth of 120 cm from the land surface. The section of the pipe above the ground was covered with a cap to protect it from incoming rain. The GWL was manually measured inside the pipe using a measuring stick on Monday, Wednesday, and Friday mornings each week.
2.5. Soil sampling and analysis
Soil was collected at a depth of 0–20 cm in each subplot before rice cultivation to determine initial soil chemical properties. Composite samples were air-dried and passed through a 2 mm mesh sieve to remove stones, roots, and other plant residues. A mixture of soil and distilled water at a ratio of 1:2.5 was used to measure soil pH (H2O) with a LAQUA pH/ION F-72 (Horiba, Japan) and electrical conductivity (EC) with a COND meter ES-51 (Horiba, Japan). Available P was extracted by Bray-1 and Bray-2 extracting solutions (Bray and Kurtz Citation1945). The concentration of P in the filtrate was determined by a colorimetric method (Murphy and Riley Citation1962) using a UV-1800 spectrophotometer (Shimadzu, Japan).
2.6. Data processing
2.6.1. Evaluation of the P fertilization effect
The effect of P fertilization was evaluated based on yield relative to CT and relative agronomic efficiency (RAE) of local P fertilizers for SSP (hereafter RAE). RAE was calculated as:
where Ylocal P fertilizers, YCT, and YSSP indicate rice grain yields (Mg ha−1) in the corresponding treatments at P2 application level.
2.6.2. Optimal fertilization rate and required price of local P fertilizers
The optimal fertilization rate was considered as the minimum P application rate that produced grain yields comparable to saturated grain yield. Specifically, the comparable yield was defined as YSSP at the P2 level subtracted by one standard deviation (SD) of YSSP at the P2 level. For example, YSSP and SD at the P2 level in Lowland were 3.99 and 0.37, respectively, and thus the comparable yield was calculated as 3.99 − 0.37. The optimal fertilization rate was calculated for each site from the relationship between the application rate of the P fraction and grain yield.
To evaluate the availability of local P fertilizers to local farmers, the required price of local P fertilizers to achieve a cost benefit ratio (CBR) of 1 and 2 under optimal fertilization rate conditions was estimated. CBR was calculated as:
where ΔY is the expected increase in grain yield under optimal fertilization compared with the expected increase without fertilization (Mg ha–1), Price is the farm gate price of rice (€258.2 Mg–1 according to Dr. Koide [personal communication]), Curea and CKCl are the costs of urea and KCl, respectively (€ ha–1), Pfertilizer is the required price of P fertilizers (€ 100 kg–1) to achieve a certain value of CBR, ARopt is the optimal fertilization rate of three types of fertilizers (kg ha–1). Curea and CKCl were calculated by multiplying the market price of urea and KCl (€45.7 and €160.1 100 kg–1, respectively) by the application rate (74 kg N ha–1 and 16.6 kg K ha–1, respectively). Net benefit (€ ha–1) was estimated as:
where ΔY is the expected increase in grain yield under optimal fertilization compared with the expected increase without fertilization (Mg ha–1), Price is the farm gate price of rice, Curea, CKCl, and CP-fertilizer are the costs of urea, KCl and P fertilizer application, respectively (€ ha–1). CP-fertilizer was calculated using the optimal fertilization rate of three types of P fertilizers and the required price of P fertilizers to achieve a CBR = 2.
2.7. Statistical analysis
Statistical analysis was performed using R version 4.0.0 (R Core Team Citation2020). The difference in the soil chemical properties between the sites were analyzed by Tukey HSD method. The effects of the site, fertilizer type, P application rate, and their interactions were analyzed by the three-way analysis of variance (ANOVA), followed by multiple comparisons using Shaffer’s modified sequentially rejective Bonferroni procedure. The effect size of the source was evaluated by eta squared (η2). The difference in the RAE between the PAPR and CPR was analyzed by paired t-test. Factors controlling grain yield and yield relative to CT were analyzed at each site using a stepwise multiple regression analysis. The application rate of the P fractions (WP, SP, CP, and RP) and water-soluble sulfur were used as explanatory variables. Mean GWL, soil pH (H2O), EC, soil available P content, and the application rate of P fractions were used as variables to analyze yield relative to CT. Standardized partial regression coefficients were estimated. The selection of explanatory variables was based on the Akaike’s information criterion (AIC). A simple regression analysis was conducted using the explanatory variables that significantly contributed to grain yield to simplify the contribution. The alpha level was set to 0.05.
3. Results
3.1. Chemical properties of fertilizers
Chemical properties of P fertilizers are provided in . The partial acidulation and calcination methods increased the solubility compared with raw PR. The residual P fraction (RP), which is not soluble in the 2% citric acid, decreased from 68.9% in PR to 25.8% and 32.7% in CPR and PAPR, respectively. SSP included a high water-soluble P fraction (WP) and contained a small quantity of alkaline ammonium citrate-soluble P fraction (SP). PAPR mainly consisted of WP and SP, whereas CPR contained almost equal amounts of SP and 2% citric acid-soluble P fraction (CP). The pH (H2O) at the solid:liquid extraction of 1:10 for CPR, PAPR, and SSP was 12.3, 2.8, and 3.0, respectively.
Table 2. Chemical properties of phosphate rock and fertilizers used in this study
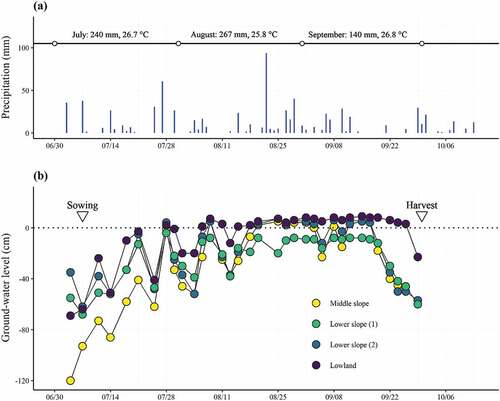
3.2. Seasonal variation in ground-water level
During the growing season, GWL ranged from +9 cm (in the Lowland on September 16) to −120 cm (in the Middle slope on July 5) (). The mean GWL in the Middle slope, Lower slope (1), Lower slope (2), and Lowland were −29.2 ± 32.8, −24.7 ± 18.5, −18.7 ± 23.2, −6.5 ± 21.1 cm (mean ± SD), respectively. GWL in the Lowland was significantly higher than that on the Middle slope and Lower slope (1) (p < 0.01, respectively).
Figure 1. Precipitation (a) and seasonal variation in ground-water level (b). Panel (a) shows the monthly precipitation and mean temperature
3.3. Soil chemical properties
The results of the soil chemical analysis are shown in . A significant difference (p < 0.01) between sites was observed for soil pH (H2O) and available P, but not for EC. Soil pH (H2O) was highest in the Middle slope (7.10), followed by Lower slope (2), Lower slope (1) (7.07 and 6.21, respectively), and Lowland (5.95). Available P ranged from 0.49 mg P kg−1 in the Lower slope (2) to 1.21 mg P kg−1 in the Middle slope.
Table 3. Soil chemical properties before the experiment
3.4. Grain yield, biomass, and harvest index
Both biomass and harvest index highly correlated with the grain yield (). shows the results of the three-way ANOVA for the grain yield, biomass, and harvest index. The main effects of site, fertilizer type, and P application rate on grain yield were strongly significant (p < 0.001). Grain yield corresponded well to the site position on the slope. Grain yield was lowest in the Middle slope (2.12 Mg ha−1) and highest in the Lowland (2.81 Mg ha−1). Among the fertilizer types, grain yield was significantly higher for SSP (2.78 Mg ha−1), followed by PAPR (2.43 Mg ha−1) and CPR (2.15 Mg ha−1). Higher P application rates significantly improved grain yield until the P2 level. However, a significant interaction between the site and P application rate was observed, which indicated diverse P fertilization effects depending on site-specific conditions. Therefore, grain yield was examined under different P application rates at each site [ (a)]. For PAPR and SSP, grain yield increased with increasing application rate. Maximum grain yield was recorded at the P2 level in all sites. In contrast, the trend for CPR differed depending on site. The maximum grain yield was obtained at P2 in the Middle slope and Lowland; however, grain yield peaked at P1 in the Lower slopes (not statistically significant).
Figure 2. Comparison of grain yield (a) and relative agronomic efficiency (RAE) (b) of local P fertilizers between treatments. Error bars in (a) and (b) indicate the standard deviation and standard error, respectively (n = 4). CPR: calcinated phosphate rock; PAPR: partially acidulated phosphate rock; SSP: single superphosphate;*: p> 0.05
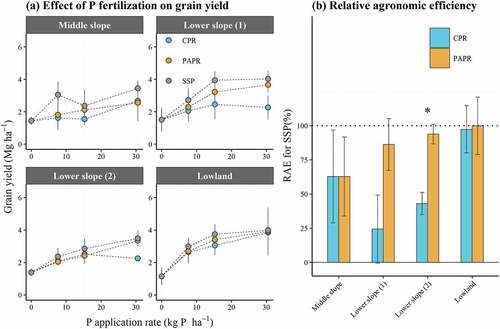
Table 4. Effects of the treatments on grain yield, biomass, and harvest index
RAE was low in the Middle slope for CPR and PAPR (62.8% and 62.8%, respectively), and markedly high in the Lowland for CPR and PAPR (97.3% and 99.8%, respectively). In the Lower slopes, PAPR had higher RAE (86.2% and 93.8% in Lower slope (1) and Lower slope (2), respectively), whereas CPR did not (24.3% and 43.1% in the Lower slope (1) and Lower slope (2), respectively).
Both biomass and harvest index were highly correlated with grain yield (; p < 0.01). Site did not affect biomass but significantly changed the harvest index (; p < 0.001). In contrast, fertilizer type significantly affected biomass (p < 0.001) but not the harvest index. The P application rate significantly affected both the biomass and harvest index (p < 0.001, respectively).
3.5. Factors controlling grain yield and fertilization effect
presents the results of multiple regression analysis. Regression equations were significant at all sites (p < 0.05 in the Middle slope and p < 0.01 for all other sites). The adjusted coefficient of determination (R2) was lowest in the Middle slope (R2 = 0.45) and highest in the Lower slope (2) (R2 = 0.81). WP persistently and strongly contributed to grain yield (p < 0.01). However, the contribution of SP was site-dependent. SP was rejected in the Middle slope, but weakly contributed to the Lower slope (1) (p < 0.1), and significantly contributed to the Lower slope (2) and Lowland (p < 0.05 and p < 0.01, respectively). Mean GWL and pH (H2O) negatively contributed, whereas, available P (AP), WP, and SP positively contributed to yield relative to CT. A regression equation with high R2 (0.85, p < 0.01) was obtained; in this equation, the variance inflation factor of variables was >1.63, suggesting no multicollinearity problem in the multiple regression analysis.
Table 5. Factors controlling grain yield and yield relative to the control
3.6. Determination of optimal fertilization rate and expected increase in grain yield
Simple regression analysis showed an evident relationship between the application rate of P fractions and grain yield (). The optimal application rate of the P fractions was 14.4 kg P ha−1 of WP in the Middle slope, and 15.9, 15.2, and 11.0 kg P ha−1 of WP + SP in the Lower slope (1), Lower slope (2), and Lowland, respectively. The optimal fertilization rate for each fertilizer, expected increase in grain yield, the required price of local P fertilizers, and net benefit at CBR = 2 are summarized in . Under optimal fertilization, grain yield was expected to increase by 1.08–2.00 Mg ha−1. The required price to achieve CBR = 1 or 2 were lowest in the Middle slope and highest in the Lowland. Net benefit was estimated to range from 59.3 in the Middle slope to 177.8 in the Lowland.
Figure 3. Relationship between the application rate of P fractions and grain yield. The Sum of effective P fractions that were significantly selected in Table 5 was employed as X-axis. The horizontal and vertical lines indicate the grain yield of SSP treatment with an application rate of 30.5 kg P ha−1 subtracted by its standard deviation and optimal fertilization rate. Error bars are standard deviation (n = 4). The gray areas represent the 95% confidence interval. CPR: calcinated phosphate rock; PAPR: partially acidulated phosphate rock; SSP: single superphosphate; WP: water-soluble P fraction; SP; alkaline ammonium citratesoluble P fraction
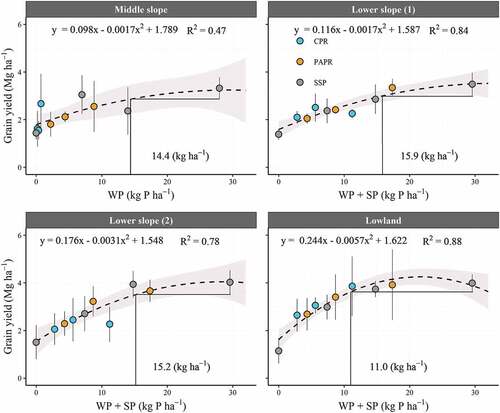
Table 6. Optimal P fertilization rate and expected increase in grain yield
4. Discussion
4.1. Effects of PAPR and CPR on grain yield under different GWL
Grain yield was significantly affected by the site, fertilizer type, and application rate (). Based on η2, P application rate explained 46% of the variance in grain yield. Grain yield increased by 168%, 204%, and 251% under P0.5, P1, and P2, respectively. Thus, the limited plant growth due to low P in soils in this region (Gebrekidan and Seyoum Citation2006) can be successfully mitigated with P fertilizer application to significantly improve rice grain yield.
However, the effects of P fertilization differed across sites (). RAE variation closely reflected the contribution of the P fractions [ (b) and ]. In the Middle slope with low GWL (), only WP contributed to grain yield; consequently, PAPR and CPR had a disadvantage over SSP with high WP. In comparison, in the Lowland with high GWL (), WP and SP had an almost equal contribution (), with both PAPR and CPR performing well (). At the other two sites with middle GWL, both WP and SP contributed to grain yield, as observed in the Lowland (). However, more WP + SP was required to reach comparable yields (15.2–15.9 kg P ha−1) than that required for the Lowland (11.0 kg P ha−1) (). Therefore, PAPR with higher total P content (9.2 g P kg−1) and WP + SP (56.9% of total P) showed an advantage over CPR (6.8 g P kg−1 and 36.8% of the total P, respectively). Thus, PAPR is useful in fields with a mean GWL > −24.7 cm, and both CPR and PAPR are effective in fields with mean GWL of – 6.5 cm.
Site and fertilizer type also significantly affected grain yield (). Site mainly reflected differences in GWL in the current study (), while fertilizer type reflected differences in P solubility (). The post-hoc test showed that GWL contributed to grain yield by increasing the harvest index. Emam et al. (Citation2014) also reported that the harvest index significantly decreased in fields subjected to water stress compared with the well-watered conditions in Egypt. In contrast, fertilizer type (i.e., only SSP) contributed to grain yield by increasing biomass. Song et al. (Citation2019) reported that application of SSP with high WP significantly enhanced root biomass and structure, thereby allowing plants to access and solubilize P sources in the soil and increase above-ground biomass. Our results demonstrate that WP is essential for enhancement of biomass compared with SP and CP. CPR showed a low performance at the P2 application level in the two sites on a lower slope. We were not able to explain this phenomenon, which requires further research.
4.2. Effect of GWL and soil pH on fertilization effect
Multiple regression equations for yield relative to CT revealed that soil water condition as well as soil chemical properties affected the fertilization effect (; ). In particular, the mean GWL and soil pH (H2O) had a large contribution. Multicollinearity was not found in the multiple regression analysis. Therefore, it could be inferred that the GWL and the soil pH independently affected the yield relative to CT. Moreover, the high R2 (0.85) indicated that the variables selected in this equation well explained the variability at the four study sites and the small effect of the other soil environmental factors.
Soil water condition is generally related to the accessibility and solubility of P fertilizer in the soil. Consistent with previous studies (Fukuda et al. Citation2013; Balasubramanian et al. Citation2007), the effect of P fertilization was more substantial at the site with high GWL, because it increased solubilization, transportation, and subsequent availability of P in the soil (Hömberg and Matzner Citation2018; King et al. Citation2015).
The mechanisms of the effects of pH on P availability are diverse (Haynes Citation1982). Robinson and Syers (Citation1990) evaluated how pH affected the solubilizing rate of PR using the incubation method, and showed that P solubility in water increased under low-pH conditions because dissolution of the apatite relies on the net supply of protons. However, lowering soil pH also increases the P fixation and Al toxicity (Margenot et al. Citation2016). Haynes (Citation1982) has shown that the availability of P in soil generally increases as pH rises from 4.0 to 7.0 because of the stimulation of mineralization of soil organic phosphorus. Carbon content and exchangeable Al were low in the current study (), while the minimum pH was relatively high (). Therefore, Al toxicity was not a problem, and the direct effect of low soil pH on P solubility would be greater than the other effects.
4.3. Optimal fertilization and expansion of rice cultivation area
The availability and profitability of fertilizers influence local farmers’ decisions to increase fertilizer inputs (Tsujimoto et al. Citation2019; Yanggen et al. Citation1998). Although local P fertilizers were inferior to SSP in terms of solubility and optimal application rate (), their availability and profitability would be superior to that of imported commercial fertilizers. The use of local PR deposits could reduce transportation costs and might significantly reduce the price of P fertilizers in SSA (Kelly Citation2006). The reduced price of local P fertilizers would increase cost benefits and profitability. Buah and Mwinkaara (Citation2009) emphasized the importance of economic analyses to calculate the net benefit to farmers.
Guèdègbé and Doukkali (Citation2018) showed that the local price of P fertilizer in the African market considerably exceeded that in the international market because of high transportation costs, which represented 43% of the local P fertilizer price. The authors estimated that, by increasing domestic fertilizer production and by reducing transportation costs, it would be possible to reduce the price of P fertilizers from €74.6 to €42.5. The required price of CPR and PAPR to achieve CBR = 1 was comparable or higher than €42.5 in fields with mean GWL > −24.7 cm (Lower slope (1), Lower slope (2), and Lowland). Therefore, the net income of farmers could be enhanced by using local P fertilizers. Moreover, the required price of PAPR to achieve CBR = 2 could be realized.
In this region of the Central Plateau of Burkina Faso, most areas of rice cultivation are distributed in lowland riverine sites. Our result indicated that PAPR could help expand rice cultivation to the lower slopes with GWL > −24.7 cm (~135 m from the river bottom in the line transect), while SSP could even facilitate rice cultivation on middle slopes with GWL > – 29.2 (~190 m from the river bottom in the line transect).
5. Conclusions
This study demonstrated the effectiveness of two types of local P fertilizers made from low-grade PR products in Burkina Faso. Only WP contributed to grain yield in fields with low GWL, but showed an equivalent contribution in fields with high GWL, WP, and SP. Therefore, PAPR with high water-solubility has an advantage over CPR in fields with low GWL. Both PAPR and CPR performed well at sites with high GWL. The optimal application rate was determined to be 14.4 kg P ha−1 as WP in the field with low GWL (mean −29.2 cm), 15.2–15.9 kg P ha−1 as WP + SP in the field with middle GWL (mean −24.7 to −18.7 cm), and 11.1 kg P ha−1 as WP + SP in the field with high GWL (mean −6.5 cm). Optimal fertilizer type and application rate differed according to the water condition. Our results provided the basic information toward expansion of the rice cultivation area into the surrounding land on the Central Plateau of Burkina Faso.
Disclosure of potential conflicts of interest
The authors declare that they have no known competing financial interests or personal relationships that could have appeared to influence the work reported in this paper.
Acknowledgments
The authors thank local farmers and technical staff members (Mr. Mohamed Ouedraogo and Mr. Kafando Serge Placide) for supporting our field trials, as well as JIRCAS’s Soil Team for soil chemical analysis. Soil sample was imported with plant phytosanitary certificate of Ministry of Agriculture, Forestry and Fisheries.
Additional information
Funding
References
- Akiyama, T., K. Tsumita, and Y. Wada. 1992. “Constituent Minerals and Solubility of Calcinated Phosphate of Na2O-CaO-MgO-P2O5-SiO2 System Made from High-silica Phosphate Ore. Jpn.” Japanese Society of Soil Science and Plant Nutrition 63: 658–663.
- Balasubramanian, V., M. Sie, R. J. Hijmans, and K. Otsuka. 2007. “Increasing Rice Production in Sub-Saharan Africa: Challenges and Opportunities.” Advances in Agronomy 97: 55–133. doi:10.1016/S0065-2113(06)94002-4.
- Bouwman, A. F., A. H. W. Beusen, and G. Billen. 2009. “Human Alteration of the Global Nitrogen and Phosphorus Soil Balances for the Period 1970–2050.” Global Biogeochemical Cycles, 23: GB0A04. doi:10.1029/2009GB003576.
- Bray, R. H., and L. T. Kurtz. 1945. “Determination of Total, Organic, and Available Forms of Phosphorus in Soils.” Soil Science 59: 39–46. doi:10.1097/00010694-194501000-00006.
- Buah, S. S. J., and S. Mwinkaara. 2009. “Response of Sorghum to Nitrogen Fertilizer and Plant Density in the Guinea Savanna Zone.” Journal of Agronomy 8: 124–130. doi:10.3923/ja.2009.124.130.
- Chien, S. H., and R. G. Menon. 1995a. “Agronomic Evaluation of Modified Phosphate Rock Products: IFDS’s Experience.” Fertilizer Research 41: 197–209. doi:10.1007/BF00748309.
- Chien, S. H., and R. G. Menon. 1995b. “Factors Affecting the Agronomic Effectiveness of Phosphate Rock for Direct Application.” Fertilizer Research 41: 227–234. doi:10.1007/BF00748312.
- Chowdhury, R. B., G. A. Moore, A. J. Weatherley, and M. Arora. 2017. “Key Sustainability Challenges for the Global Phosphorus Resource, Their Implications for Global Food Security, and Options for Mitigation.” Journal of Cleaner Production 140: 945–963. doi:10.1016/j.jclepro.2016.07.012.
- De Bauw, P., E. Vandamme, K. Senthilkumar, A. Lupembe, E. Smolders, and R. Merckx. 2019. “Combining Phosphorus Placement and Water Saving Technologies Enhances Rice Production in Phosphorus-deficient Lowlands.” Field Crops Research 236: 177–189. doi:10.1016/j.fcr.2019.03.021.
- Dobermann, A., K. G. Cassman, C. P. Mamaril, and J. E. Sheehy. 1998. “Management of Phosphorus, Potassium, and Sulfur in Intensive, Irrigated Lowland Rice.” Field Crops Research 56: 113–138. doi:10.1016/S0378-4290(97)00124-X.
- Emam, M. M., H. E. Khattab, N. M. Helal, and A. E. Deraz. 2014. “Effect of Selenium and Silicon on Yield Quality of Rice Plant Grown under Drought Stress.” Australian Journal of Crop Science 8: 596–605.
- FAMIC (Food and Agricultural Materials Inspection Center). 2013. “Testing Methods for Fertilizers 370, Incorporated Administrative Agency, Food and Agricultural Materials Inspection Center (FAMIC).” Saitama, Japan.
- FAO (Food and Agriculture Organization). 2004. “Use of Phosphate Rock for Sustainable Agriculture.” FAO Fertilizer and Plant Nutrition Bulletin 13: 148.
- Frederick, E. D., and E. N. Roth, “International Fertilizer Development Center (Eds.) 198: Sulfuric Acid-based Partially Acidulated Phosphate Rock: Its Production, Cost, and Use, Technical bulletin/IFDC.” International Fertilizer Development Center, Muscle Shoals, Ala., U.S.A.
- Fukuda, M., F. Nagumo, S. Nakamura, and S. Tobita. 2013. “Ineffectiveness of Directly Applied Burkina Faso Phosphate Rock on Rice Growth.” Soil Science and Plant Nutrition 59: 403–409. doi:10.1080/00380768.2013.783770.
- Gebrekidan, H., and M. Seyoum. 2006. “Effects of Mineral N and P Fertilizers on Yield and Yield Components of Flooded Lowland Rice on Vertisols of Fogera Plain, Ethiopia.” Journal of Agriculture and Rural Development in the Tropics and Subtropics 107: 161–176.
- Guèdègbé, T., and M. R. Doukkali. 2018. “Fertilizer Use in Africa: A Price Issue.” OCP Policy Center Policy Brief 18–27.
- Haynes, R. J. 1982. “Effects of Liming on Phosphate Availability in Acid Soils: A Critical Review.” Plant Soil 68: 289–308. doi:10.1007/BF02197935.
- Hömberg, A., and E. Matzner. 2018. “Effects of Drying and Rewetting on Soluble Phosphorus and Nitrogen in Forest Floors: An Experiment with Undisturbed Columns.” Journal of Plant Nutrition and Soil Science 181: 177–184. doi:10.1002/jpln.201700380.
- Ikazaki, K., F. Nagumo, S. Simporé, and A. Barro. 2018a. “Are All Three Components of Conservation Agriculture Necessary for Soil Conservation in the Sudan Savanna?” Soil Science and Plant Nutrition 64: 230–237. doi:10.1080/00380768.2017.1422393.
- Ikazaki, K., F. Nagumo, S. Simporé, and A. Barro. 2018b. “Soil Toposequence, Productivity, and a Simple Technique to Detect Petroplinthites Using Ground-penetrating Radar in the Sudan Savanna.” Soil Science and Plant Nutrition 64: 623–631. doi:10.1080/00380768.2018.150264.
- IUSS Working Group WRB. 2015. “World Reference Base for Soil Resources (2014), Update (2015).” World Soil Resources Reports 106. FAO, Rome.
- JAXA (Japan Aerospace Exploration Agency). 2018. “ALOS Global Digital Surface Model “ALOS World 3D - 30m (AW3D30)” Version 2.1.” Accessed 8 January 2020. https://www.eorc.jaxa.jp/ALOS/en/aw3d30/index.htm
- Kelly, V. A. 2006. “Factors Affcting Demand for Fertilizer in Sub-Saharan Africa.” Agriculture and Rural Development Discussion Paper 23: 89.
- King, K. W., M. R. Williams, M. L. Macrae, N. R. Fausey, J. Frankenberger, D. R. Smith, P. J. A. Kleinman, and L. C. Brown. 2015. “Phosphorus Transport in Agricultural Subsurface Drainage: A Review.” Journal Of. Environmental Quality 44: 467–485. doi:10.2134/jeq2014.04.0163.
- Margenot, A. J., B. R. Singh, I. M. Rao, and R. Sommer. 2016. “Phosphorus Fertilization and Management in Soils of Sub-Saharan Africa.” Soil Phosphorus 8: 152–208.
- Mizane, A., and R. Rehamnia. 2012. “Study of some parameters to obtain the p2o5 water- soluble from partially acidulated phosphate rocks (paprs) by sulfuric acid.” Phosphorus Research Bulletin 27: 18–22. doi:10.3363/prb.27.18.
- Murphy, J., and J. P. Riley. 1962. “A Modified Single Solution Method for the Determination of Phosphate in Natural Waters.” Analytica Chimica Acta 27: 31–36. doi:10.1016/S0003-2670(00)88444-5.
- Nakamura, S., M. Fukuda, F. Nagumo, and S. Tobita. 2013. “Potential Utilization of Local Phosphate Rocks to Enhance Rice Production in Sub-Saharan Africa.” Japan Agricultural Research Quarterly: JARQ 47: 353–363. doi:10.6090/jarq.47.353.
- Nakamura, S., T. Kanda, T. Imai, J. Sawadogo, and F. Nagumo. 2019. “Solubility and Application Effects of African Low-grade Phosphate Rock Calcinated with Potassium Carbonate.” Soil Science and Plant Nutrition 65: 267–273. doi:10.1080/00380768.2019.1598236.
- Nishigaki, T., Y. Tsujimoto, S. Rinasoa, T. Rakotoson, A. Andriamananjara, and T. Razafimbelo. 2019. “Phosphorus Uptake of Rice Plants Is Affected by Phosphorus Forms and Physicochemical Properties of Tropical Weathered Soils.” Plant Soil 435: 27–38. doi:10.1007/s11104-018-3869-1.
- R Core Team. 2020. A Language and Environment for Statistical Computing. Vienna, Austria: R Foundation for Statistical Computing. https://www.R-project.org/
- Rahman, M. 2018. “Effect of Acidulated Levels and Application Techniques of Rock Phosphate on Phosphorus Use Efficiency and Yield of Wheat in Calcareous Soil of Peshawar-Pakistan.” Pure and Applied Biology 7. doi:10.19045/bspab.2018.700128.
- Robinson, J. S., and J. K. Syers. 1990. “A Critical Evaluation of the Factors Influencing the Dissolution of Gafsa Phosphate Rock.” Journal of Soil Science 41: 597–605. doi:10.1111/j.1365-2389.1990.tb00229.x.
- Sahrawat, K. L., M. P. Jones, S. Diatta, and A. Adam. 2001. “Response of Upland Rice to Fertilizer Phosphorus and Its Residual Value in an Ultisol.” Communications in Soil Science and Plant Analysis 32: 2457–2468. doi:10.1081/CSS-120000384.
- Saito, K., E. Vandamme, J. M. Johnson, A. Tanaka, K. Senthilkumar, I. Dieng, C. Akakpo, et al. 201. “Yield-limiting Macronutrients for Rice in sub-Saharan Africa.” Geoderma 338: 546–554. doi:10.1016/j.geoderma.2018.11.036.
- Sale, P. W. G., and A. U. Mokwunye. 1993. “Use of Phosphate Rocks in the Tropics.” Fertilizer Research 35: 33–45. doi:10.1007/BF00750218.
- Savini, I., J. Kihara, S. Koala, J. Mukalama, B. Waswa, and A. Bationo. 2016. “Long-term Effects of TSP and Minjingu Phosphate Rock Applications on Yield Response of Maize and Soybean in a Humid Tropical Maize–legume Cropping System.” Nutrient Cycling Agroecosystems 104: 79–91. doi:10.1007/s10705-016-9760-7.
- Song, T., F. Xu, W. Yuan, M. Chen, Q. Hu, Y. Tian, J. Zhang, and W. Xu. 2019. “Combining Alternate Wetting and Drying Irrigation with Reduced Phosphorus Fertilizer Application Reduces Water Use and Promotes Phosphorus Use Efficiency without Yield Loss in Rice Plants.” Agricultural Water Management 223: 105686. doi:10.1016/j.agwat.2019.105686.
- Tsujimoto, Y., T. Rakotoson, A. Tanaka, and K. Saito. 2019. “Challenges and Opportunities for Improving N Use Efficiency for Rice Production in sub-Saharan Africa.” Plant Production Science 22: 413–427. doi:10.1080/1343943X.2019.1617638.
- USDA (United States Department of Agriculture). 2018. “Production, Supply and Distribution Online.” https://apps.fas.usda.gov/psdonline/app/index.html#/app/
- Van Oort, P. A. J., K. Saito, A. Tanaka, E. Amovin-Assagba, L. G. J. Van Bussel, J. Van Wart, H. De Groot, M. K. Van Ittersum, K. G. Cassman, and M. C. S. Wopereis. 2015. “Assessment of Rice Self-sufficiency in 2025 in Eight African Countries.” Global Food Security 5: 39–49. doi:10.1016/j.gfs.2015.01.002.
- Van Straaten, P. 2002. Rocks for Crops: Agrominerals of sub-Saharan Africa. Nairobi Kenya: Guelph, Canada: ICRAF: University of Guelph.
- Vandamme, E., M. Wissuwa, T. Rose, K. Ahouanton, and K. Saito. 2016. “Strategic Phosphorus (P) Application to the Nursery Bed Increases Seedling Growth and Yield of Transplanted Rice at Low P Supply.” Field Crops Research 186: 10–17. doi:10.1016/j.fcr.2015.11.003.
- Yanggen, D., V. Kelly, T. Reardon, and A. Naseem 1998. “Incentives for Fertilizer Use in Sub-Saharan Africa A Review of Empirical Evidence on Fertilizer Response and Profitability.” MSU International Department of Agricultural Economics Development Department of Economics Working Paper, 70: 129.
- Zapata, F. 2004. “Use of Phosphate Rocks for Sustainable Agriculture.” FAO Fertilizer and Plant Nutrition Bulletin 35: 1–148.
’
Table A1 Pearson’s correlation matrix of grain yield, biomass, harvest index, and yield components
Figure A1. Effect of ground-water level (a) and soil pH (H2O) (b) on the yield relative to the control. Error bars indicate standard deviation (n = 4). Gray shading corresponds to the points of other fertilizers. CPR: calcined phosphate rock; PAPR: partially acidulated phosphate rock; SSP: single superphosphate; P0: nonfertilized (control). P0.5: 7.6 kg P ha-1; P1: 15.3 kg P ha-1; P2: 30.5 kg P ha−1