ABSTRACT
Organic matter (OM) application is a possible solution to carbon (C) sequestration. Among the soil pedogenic factors for volcanic ash, time of exposure to weathering affects formation of short-range ordered minerals and soil organic carbon (SOC) accumulation. This study aimed to evaluate the effect of long-term OM application with the vertical infiltration of OM on different ages of Andosols in Hokkaido, Japan. Twelve fields of Vitric Andosols and 22 fields of Silandic Andosols were selected. Vitric and Silandic Andosols are characterized by newly erupted volcanic ash with weak weathering, and formation of short-range ordered minerals by weathering, respectively. The C application rate via OM was determined using questionnaires given to farmers, and soil physicochemical properties in the 0–0.15 m and 0.15–0.30 m layers were analyzed.
The average C application rate in Vitric and Silandic Andosols were 1.71 ± 1.18 and 1.31 ± 1.28 (Mg C ha−1 yr−1), respectively (mean ± sd). The sand content was significantly higher in Vitric Andosols (55.7% ± 4.0%) than in Silandic Andosol (51.2% ± 2.0%). Although there was no significant difference in micro-porosity, Silandic Andosols had significantly higher total porosity and lower bulk density than Vitric Andosols. These results indicate better soil structure development in Silandic Andosols. The SOC stock in the 0–0.30 m layer in Vitric Andosols [71.5 ± 15.3 (Mg C ha−1 0.30 m−1)] was significantly lower than in Silandic Andosols [86.4 ± 12.7 (Mg C ha−1 0.30 m−1)]. The SOC stock in Vitric and Silandic Andosols showed a different response to the OM application. An increased C application rate significantly increased the SOC stock in the 0–0.15 and 0–0.30 m layers in Vitric Andosols, but the relations were not significant in Silandic Andosols. In contrast, in Silandic Adosols, weak trends (p = 0.07) were observed in the 0.15–0.30 m layer. In Silandic Andosols, SOC stock in the 0–0.15 m layer showed a z significant positive correlation with soil micro-porosity, suggesting physical protection of OM inside the aggregate. These results suggest that there are different factors affecting SOC stock between Vitric and Silandic Andosols.
1. Introduction
The atmospheric carbon dioxide (CO2) concentration has risen from 278 ppm in the pre industrial era (circa 1750) to 405.5 ppm in 2017 at a rate of 2.24 ppm yr–1 (Lal Citation2019; WMO. Citation2018). Soil organic carbon (SOC) sequestration is a possible solution to mitigate climate change by taking atmospheric CO2 and converting it into soil carbon (C) (Minasny et al. Citation2017).
Management techniques have been proposed that facilitate the buildup of soil organic matter (SOM) (Minasny et al. Citation2017). According to Minasny et al. (Citation2017), there is a trend in the types of management and SOC accumulation rates: afforestation [0.6 (Mg C ha−1 yr−1)], conversion to pasture [0.5 (Mg C ha−1 yr−1)], organic matter (OM) application [0.5 (Mg C ha−1 yr−1)], residue incorporation [0.35 (Mg C ha−1 yr−1)], no or reduced tillage [0.3 (Mg C ha−1 yr−1)], and crop rotation [0.2 (Mg C ha−1 yr−1)].
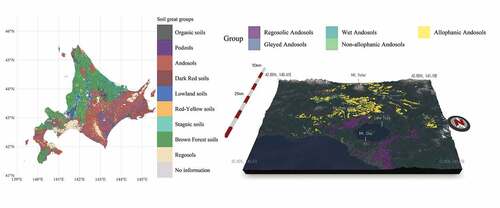
Although Andosols cover only approximately 0.84% of the world’s land surface (Soil Survey Staff Citation1999), they cover approximately 30% of the land surface in Japan (Obara et al. Citation2016). According to a recent update of the soil map of Hokkaido, Japan ()), the dominant soil great group in Hokkaido is Andosols (43% distribution) (Kanda et al. Citation2016). Therefore, changes in the SOC of Andosols significantly influence calculations of CO2 emissions from soils in Japan (Shirato, Hakamata, and Taniyama. Citation2004).
Figure 1. Soil great group distribution map of Hokkaido, Japan (a) and soil group map of the studied region (b). The soil great group and soil group were shown based on the recent update of the soil map in Hokkaido developed with the comprehensive soil classification system of Japan, (Obara et al. Citation2016; Kanda et al. Citation2016)
Andosols possess several distinctive physicochemical properties, such as high SOC content, highly developed porous structure, low bulk density, and high phosphate adsorption capacity (PAC), which are rarely found in other soils (Imaya Citation2020; Takahashi and Dahlgren Citation2016). These properties are mainly due to the dominance of short-range ordered minerals (allophane, imogolite, and ferrihydrite) and Al/Fe–humus complexes in their colloidal fractions (Takahashi and Dahlgren Citation2016). Among the soil pedogenic factors for volcanic ash, time of exposure to weathering strongly affects the formation of short-range ordered minerals and SOC accumulation (Shoji, Nanzyo, and Dahlgren Citation1993; Tsai et al. Citation2010), which is also important for soil classification (IUSS working group WRB. Citation2015).
Several studies have evaluated the effect of OM application on C sequestration in Andosols (Iwasaki, Endo, and Hatano. Citation2017; Koga Citation2017; Shirato, Hakamata, and Taniyama Citation2004). Increased input of C increases net ecosystem exchange and enhances C accumulation in soil (Koga Citation2017; Limin et al. Citation2015; Naveed et al. Citation2014). However, initial SOC stock is another key factor that affects the change in SOC stock (Bellamy et al. Citation2005; Iwasaki, Endo, and Hatano Citation2017; Minasny et al. Citation2017). Iwasaki, Endo, and Hatano (Citation2017) evaluated the effect of long-term application of OM on SOC stock and physicochemical properties of different types of Andosols of different ages in the cool temperate zone. In 2012, a soil survey was conducted in 34 fields in Toya, Hokkaido, Japan, using reference data collected from 2001 to 2003. They found a significant negative correlation between the initial SOC stock [SOC stock in 2001–2003 (Mg C ha−1 0.15 m−1)] and change in SOC stock [rate of change in SOC stock from 2001 to 2003 to 2012 (Mg C ha−1 0.15 m−1 yr−1)] with the following equation:
Change in SOC stock (Mg C ha−1 0.15 m−1 yr−1) = −0.052 Initial SOC stock (Mg C ha−1 0.15 m−1) + 2.09 … (eq. 1)
This result indicates that the application of OM increases SOC stock when initial SOC stock is lower than the threshold (intercept at the x-axis) of 36.1 (Mg C ha−1 0.15 m−1) but a decrease in fields with higher SOC stock than the threshold (Iwasaki, Endo, and Hatano Citation2017).
From these results, we hypothesized that the OM application effect on C sequestration differs according to the ages of Andosols.
SOM acts as a binding agent that stabilizes soil aggregates that in turn protect SOM and act as an important reservoir of C and other mineral nutrients (Beare et al. Citation1994; Elliott Citation1986), thereby, affecting the physicochemical properties of soil (Gruba and Mulder Citation2015; Johnson et al. Citation2011; Naveed et al. Citation2014). Thus, it is essential to evaluate the effect of long-term application of OM in Andosols, not only from the perspective of C sequestration but also from that of soil fertility improvement (Oldfield, Bradford, and Wood Citation2019).
It is generally known that SOM can be stabilized by (1) incorporation into aggregates (physical protection); (2) an intimate association with silt and clay particles (chemical protection); and (3) the formation of recalcitrant SOM compounds (biological protection) (Six et al. Citation2002). Although there is a controversy, physical protection has been considered a major SOM stabilization mechanism (Guan et al. Citation2018; Lal Citation2019).
The effect of OM application and role of soil aggregate on soil C sequestration is often studied. However, their interactions with different types of Andosols of different ages are poorly understood. Therefore, we conducted the present study in Toya, Hokkaido, Japan, where Andosols of different ages are distributed, and practices that encourage the efficient use of organic matter have been developed since the late 1990s (Iwasaki, Endo, and Hatano Citation2017).
This study aimed 1) to evaluate the effect of long-term OM application with the vertical infiltration of OM on different ages of Andosols and 2) to identify the vertical infiltration of OM and factors impacting SOC stock.
2. Materials and methods
2.1. Study sites information
The study was conducted in Toya, Central Hokkaido, Japan (42° 65ʹN, 140° 80ʹE), located on the north side of Lake Toya ()). A humid continental climate characterizes the site with cold winter and cool summer without an apparent wet or dry season. The long-term (30 y) average annual precipitation and air temperature were 1179 mm and 7.5°C, respectively (Japan Meteorological Agency: https://www.jma.go.jp/jma/indexe.html).
The parent materials of this region were derived from Toya Caldera (Acocella et al. Citation2015). Subsoils in the study area were derived from Mt. Yotei (Ya) and surface soils from Mt. Usu (Ua and Ub). Eruptive activity at Usu Volcano resumed in 1663, and since then, seven eruptions have been recorded in 1769, 1822, 1853, 1910, 1943–1945, 1977–1978, and 2000 (Miyabuchi et al. Citation2014). Ua was derived from volcanic ash produced by an eruption after 1769, and Ub originated from the volcanic ash produced by the eruption in 1663 (Iwasaki, Endo, and Hatano Citation2017).
Soils in the study sites were classified as Vitric and Silandic Andosols (IUSS Working Group WRB Citation2015), and they correspond to Regosoric Andosols and Allophanic Andosols in the soil map of Hokkaido, Japan ()), respectively, based on the comprehensive soil classification system of Japan (Kanda et al. Citation2016). Vitric Andosols are characterized by newly erupted volcanic ash with weak weathering. On the other hand, Silandic Andosols are characterized by formation of short-range ordered minerals (allophane and imogolite) through weathering and accumulation of SOM (International Union of Soil Sciences (IUSS) Working Group WRB Citation2015).
Vitric Andosols are mainly distributed in the southwest part of the region, closer to Mt. Usu, and are affected by Ua and Ub more than Silandic Andosols.
Thirty-four fields of 34 farmers were selected, and were classified into 12 fields of Vitric Andosols (K1 soil series in Iwasaki, Endo, and Hatano (Citation2017)) and 22 fields of Silandic Andosols (K2 and HO soil series in Iwasaki, Endo, and Hatano (Citation2017)) based on a soil profiling survey.
In this region, OM application was conducted in all 34 study fields because of the practice developed in late 1990s that encourages sustainable agriculture with effective use of organic matter (Iwasaki, Endo, and Hatano Citation2017). Major crops such as corn, sugar beet, potato, red bean, radish, carrot, and burdock are rotationally cultivated in this area.
2.2. Soil sampling and analysis
The depth of the Ap horizon was 0.23 ± 0.04 m on average (ranging from 0.15 to 0.32 m) (Iwasaki, Endo, and Hatano Citation2017). Three replicates of both composite and undisturbed samples (100 mL) were taken from 0 to 0.15 m in May 2012 and 0.15 to 0.30 m in October 2012. Composite samples were air-dried and passed through a 2-mm mesh sieve to remove stones and plant residues. Samples for C and nitrogen (N) content estimation were sifted further using a 0.5 mm mesh. Soil physicochemical properties presented in Iwasaki, Endo, and Hatano (Citation2017) were cited, and additional analysis was conducted in this study.
Undisturbed samples from the 0 to 0.15 m layer were used to measure the bulk density, water-filled pore space (WFPS), saturated hydraulic conductivity via constant-head and falling-head methods (Klute Citation1965), soil moisture characteristic curve using the suction plate method for 0 to −10.0 kPa, and pressure plate method for −10.0 to −50.0 kPa (Dane and Hopmans. Citation2002), and total porosity using a three-phase meter (DIK-1110; Daiki Rika, Japan). Macro-porosity (pores that drain at 0 to −6.0 kPa) and micro-porosity (water retained at −6.0 kPa) were estimated according to Gao et al. (Citation2019). Large macro-porosity was estimated as total porosity subtracted by macro-porosity and micro-porosity. Water holding capacity was estimated as water drained retained at 0 kPa. Soil available water was defined as water drained at −3.0 kPa (field water capacity) to −50.0 kPa (depletion of moisture for normal growth). Undisturbed samples from 0.15 to 0.30 m were subjected to bulk density measurements.
Soil texture (sand, silt, and clay), pH, electrical conductivity (EC), available phosphorus (P), phosphorus absorption coefficient (PAC), exchangeable cations (K+, Ca2+, and Mg2+), and cation exchange capacity (CEC) measured using composite samples taken from 0 to 0.15 m were cited from Iwasaki, Endo, and Hatano (Citation2017).
Soil organic carbon and soil total nitrogen (STN) contents, water-extractable soil organic carbon (WESOC), nitrate nitrogen (NO3–N), ammonium nitrogen (NH4+-N), and available N were measured using composite samples from both 0 to 0.15 and 0.15 to 0.30 m layers.
Soil organic carbon and STN were measured by a dry-combustion method using an NC analyzer (NC-900; Sumika Chemical Analysis Service, Japan). From the water extracts, WESOC was measured using a total organic carbon (TOC) analyzer (TOC 5000A; Shimadzu, Japan), and NO3–N concentrations were analyzed by ion chromatography (Dionex QIC Analyzer; Dionex Japan, Japan). NH4+-N in the 2 M KCl extract solution was determined using indophenol blue method (UV mini-1240; Shimadzu, Japan). Available N was measured using a simplified thermal extraction estimation method suggested by Sakaguchi, Sakurai, and Nakatuji (Citation2010).
2.3. Management practice
The application rate of C by manure, green manure, and combined organic and synthetic fertilizer (COS) were cited from Iwasaki, Endo, and Hatano (Citation2017). Briefly, they estimated an annual average C application rate (Mg C ha−1 yr−1) based on the questionnaires provided to farmers and the chemical composition of each OM source. In this region, Heiotsu (Avena sativa L.) was used as both succeeding crop green manure and fallow green manure. Plants were incorporated into the soil before the decrease of soil temperature for better decomposition (August for fallow green manure and beginning of October for succeeding green manure). On the other hand, manure application was generally conducted at the end of October after the harvest.
2.4. Statistical analysis and data visualization
Statistical analysis and drawing figures were performed using R version 4.0.0 (R Core Team Citation2020). The difference between the two soil types in the C application rate via OM and soil physicochemical properties were analyzed using a non-paired t-test. The correlation matrix was calculated using Pearson’s correlation coefficient. In this study, the alpha level was set to 0.05.
The soil great group distribution map of Hokkaido, Japan ()) was constructed by simple feature access with a shapefile provided by Institute for Agro-Environmental Sciences, NARO (https://soil-inventory.dc.affrc.go.jp/offer.html) (Obara et al. Citation2016).
A soil group map of the studied region ()) was constructed using Rayshader ver. 0.20.0. Andosols were picked up from the shapefile provided by the Institute for Agro-Environmental Sciences, NARO (https://soil-inventory.dc.affrc.go.jp/offer.html) and overlaid on the Digital Elevation Model (DEM) and satellite image (Landsat8). DEM and satellite images were obtained from Shuttle Radar Topography Mission (SRTM) data set by the National Aeronautics and Space Administration (NASA) (https://dwtkns.com/srtm30m/), and Earth Explorer provided by United States Geological Survey (USGS) (https://earthexplorer.usgs.gov/), respectively.
3. Results
3.1. Application rate of carbon via organic matter application
The CN ratios of the OM and C application rates via manure, green manure, and COS are presented in . The CN ratios of manure, green manure, and COS were 5.6–19.4, 15.0–25.0, and 3.1–15.5, respectively. The total (sum of manure, green manure, and COS) C application rate (mean ± sd) in the fields on Vitric and Silandic Andosols were 1.71 ± 1.18 and 1.31 ± 1.28 (Mg C ha−1 yr−1), respectively, with no significant difference between the soil types. Among the C sources, the highest amount of C was applied as manure (65.5% and 65.4% of total C application in Vitric and Silandic Andosols, respectively), followed by green manure (31.6 and 30.8% of total C application in Vitric and Silandic Andosols, respectively), and the lowest as COS (2.9% and 3.8% of total C application in Vitric and Silandic Andosols, respectively).
Table 1. CN ratio of organic matters and C application rate via manure, green manure, and combined organic and synthetic fertilizer
3.2. Soil physicochemical properties
shows a comparison of soil physicochemical properties at 0–0.15 m between Vitric and Silandic Andosols. The soil texture in Vitric Andosols was relatively coarse compared to Silandic Andosols with a significantly higher sand content (p < 0.01) and lower silt content (p < 0.01). Although there is no significant difference in micro-porosity and macro-porosity between the soil types, Vitric Andosols showed a significantly smaller amount of large macro-porosity and total porosity than Silandic Andosols (p < 0.01, respectively). The bulk density was significantly higher in Vitric Andosols than in Silandic Andosols (p < 0.01).
Table 2. Soil physicochemical properties
Among the soil chemical properties, pH, PAC, exchangeable Mg2+ content, and base saturation were significantly larger in Vitric Andosols than in Silandic Andosols (p < 0.05 for PAC and p < 0.01 for pH, exchangeable Mg2+ content, and base saturation, respectively). On the other hand, SOC content, STN content, EC, and CEC were significantly higher in Silandic Andosols than in Vitric Andosols (p < 0.01).
shows Pearson’s correlation matrix among all the data of physico-chemical properties of all 34 study sites. Soil texture correlated not only with physical properties but also with chemical properties. The sand content was positively correlated (p < 0.05) with bulk density, available water, pH, exchangeable Mg2+ content, and base saturation, and negatively correlated (p < 0.05) with total porosity, water holding capacity, SOC content, STN content, and CEC. For the physicochemical properties, these significant correlations are depicted in Figure A1 (Appendix). On the other hand, silt content showed an opposite trend, that is, a negative correlation (p < 0.05) with bulk density, pH, exchangeable Mg2+ content, and base saturation, and positive correlation (p < 0.05) with total porosity, water holding capacity, and CEC. Soil pore distribution also impacted the soil physicochemical properties. The micro-porosity positively correlated (p < 0.05) with WFPS, water holding capacity, filed water capacity, EC, PAC, and CEC, and negatively correlated (p < 0.05) with saturated hydraulic conductivity, available P, and base saturation. Meanwhile, macro-porosity positively correlated (p < 0.05) with saturated hydraulic conductivity, water holding capacity, and available water, and negatively correlated (p < 0.05) with WFPS and field water capacity.
Table 3. Pearson’s correlation matrix of soil physicochemical properties
3.3. Soil carbon and nitrogen
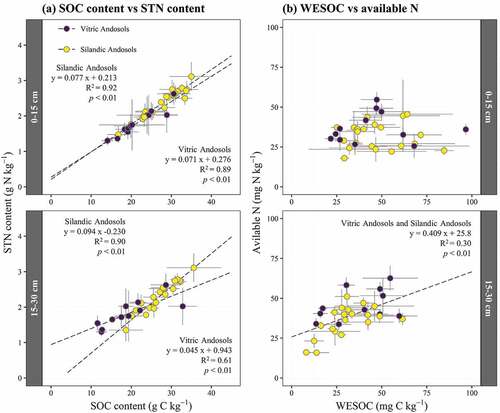
Soil properties related to C and N are presented in . Preliminary analysis showed that SOC content and STN content were highly correlated (Figure A2(a)). Therefore, SOC and STN content showed a similar trend. The SOC and STN contents were slightly higher at 0–0.15 m than 0.15–0.30 m (not significant), and were higher in Silandic Andosols than in Vitric Andosol at 0–0.15 and 0.15–0.30 m layers (p < 0.01, respectively). The two soil types had almost the same CN ratio in the 0–0.15 m layer, while in the 0.15–0.30 m layer, CN ratio was significantly higher in Silandic Andosols than Vitric Andosols (p < 0.05). There was no significant difference between the soil types in WESOC at any depth. Available N was significantly higher in Vitric Andosols than in Silandic Andosols (p < 0.01). NO3–N was higher in 0–0.15 m layer than in the 0.15–0.30 m layer, and NH4+-N showed the opposite trend. There was no significant difference in NO3–N and NH4+-N between the soil types.
Table 4. Soil carbon and nitrogen related properties
In Vitric Andosols, the SOC stock of 0–0.15, 0.15–0.30, and 0–0.30 m layers (Mg C ha−1) were 36.5 ± 9.3, 35.3 ± 10.1, and 71.5 ± 15.3, respectively. And in Silandic Andosols, these were 41.7 ± 7.8, 44.5 ± 7.4, and 86.4 ± 12.7, respectively. Values were significantly higher in Silandic Andosols than in Vitric Andosols at any depth (p < 0.01).
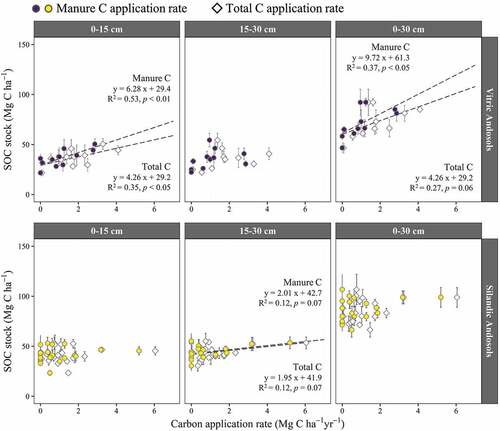
The relationship between the C application rate via OM (Mg C ha−1 yr−1) and SOC stock (Mg C ha−1) in the 0–0.15, 0.15–0.30, and 0–0.30 m layers are shown in . Significant relationships (p < 0.05) were obtained only in Vitric Andosols. Although the manure and total C applications did not affect the SOC stock in the 0.15–0.30 m layer, the SOC stocks in 0–0.15 m and 0–0.30 m layers were increased with increasing the manure and total C applications. Manure C application rate well explained the SOC stock with higher R2 values (R2 = 0.53 and 0.37 in 0–0.15 and 0–0.30 m layers, respectively) rather than the total C application rate (R2 = 0.35 and 0.27 in 0–0.15 and 0–0.30 m layers, respectively). In the Silandic Andosols, weak trends (p = 0.07) were observed in the 0.15–0.30 m layer.
Figure 2. The relationship between the C application rate via organic matter and SOC stock. Error bar represents a standard deviation
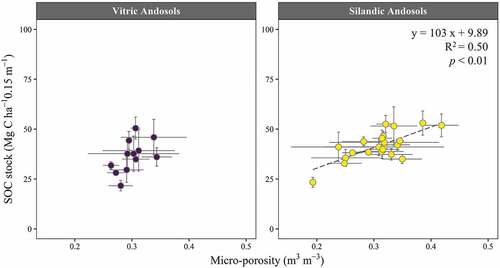
The relationship between the soil micro-porosity and SOC stock is shown in . A significant relationship was obtained in Silandic Andosols (p < 0.01). On the other hand, there was no significant correlation in Vitric Andosols. The relationship between the PAC and SOC stock was significant in the Silandic Andosols (p < 0.05). However, the R2 (0.18) was smaller than that of the regression equation obtained from the relationship between micro-pore and SOC stock (0.50).
Figure 3. The relationship between the micro-porosity and SOC stock in the 0–0.15 m layer. Error bar represents a standard deviation
4. Discussions
4.1. Different ages of andosols
A comparison of soil physical properties () showed a different pedogenic process of Vitric and Silandic Andosols. The sand content was significantly higher in Vitric Andosols. Although there was no significant difference in the micro-porosity and macro-porosity between the soil types, total porosity, and large macro-porosity were significantly higher in Silandic Andosols than in Vitric Andosols. Furthermore, bulk density in Silandic Andosols was significantly lower than in Vitric Andosols. These results indicate better soil structure development in Silandic Andosols during long-term pedogenesis (Håkansson and Lipiec Citation2000). Formation of short-range order minerals (allophane and imogolite) is reported to continuously occur for more than 100 kyr (Torn et al. Citation1997). Therefore, the amounts of these minerals and of active aluminum and iron are theoretically larger in Silandic Andosols than in Vitric Andosols, which are strongly affected by newly produced volcanic ash from recent eruptions (after 1769) of Mt. Usu. Higher PAC in Vitric Andosol than Silandic Andosol surface soils may be attributed to increased SOM due to OM application (Iwasaki, Endo, and Hatano Citation2017). Previous studies have shown that distinct features of Silandic Andosols, including high porosity, SOC, and PAC, are mostly due to short-range order minerals and aluminum/iron–humus complexes (Shoji, Nanzyo, and Dahlgren Citation1993; Takahashi and Dahlgren Citation2016). These studies support the occurrence of better soil structure development in Silandic Andosols.
4.2. Response of different types of andosols to long-term organic matter application
In this study, Vitric and Silandic Andosols responded differently to long-term OM application. An increased C application rate via OM significantly increased SOC stock in the 0–0.15 and 0–0.30 m layers in Vitric Andosols, but the same correlations were not significant in Silandic Andosols (). By contrast, weak trends (p = 0.07) were observed in the 0.15–0.30 m layer. The stored SOC distribution in 0–0.15 and 0.15–0.30 m layers displayed different patterns in Vitric and Silandic Andosols. SOC stock in the 0–0.15 m layer were elevated relative to the 0.15–0.30 m layer in Vitric Andosols, whereas in Silandic Andosols, relative SOC stock in the 0–0.15 m layer were lower than in the 0.15–0.30 m layer ().
OM application is expected to increase stored SOC through direct input of a C source. Many studies have reported a positive relationship between the amount of C incorporated into a soil and its SOC content (Hao et al. Citation2003; Koga Citation2017; Kundu et al. Citation2007; Naveed et al. Citation2014). However, some studies have indicated that increased OM application does not consistently increase SOC content in a linear fashion (Iwasaki, Endo, and Hatano Citation2017; Shahbaz, Kuzyakov, and Heitkamp Citation2017). In a previous study, Iwasaki, Endo, and Hatano (Citation2017) concluded that OM application drove SOC accumulation especially effectively in Vitric Andosols (K1 soil series) with higher sand content and lower SOC stock than Silandic Andosols (K2 and HO soil series). However, in their study, the effect of OM application was evaluated only at 0–0.15 m layer, and the mechanism of SOC accumulation was not discussed.
Because the average depth of the Ap horizon across the 34 study sites was 0.23 ± 0.04 m (Iwasaki, Endo, and Hatano Citation2017), most of the applied OM was directly incorporated into the 0–0.15 m layer. In Silandic Andosols, which possess significantly higher large macro-porosity and total porosity than Vitric Andosols (), the OM applied to the 0–0.15 m layer was subjected to accelerated decomposition due to more aerobic conditions. A positive correlation between the macro-aggregate portion and microbial respiration has been found in several studies (Andruschkewitsch et al. Citation2014; Diba, Shimizu, and Hatano Citation2011; Shahbaz, Kuzyakov, and Heitkamp Citation2017). Moreover, a decrease in SOM stabilization with increasing OM input due to macro-aggregate formation has been reported (Aoyama and Taniuchi Citation1992; Shahbaz, Kuzyakov, and Heitkamp Citation2017). By contrast, OM incorporated into the 0.15–0.30 m layer might be more stable due to relatively anaerobic conditions. Enhanced vertical infiltration of OM from surface to subsurface soil by increasing macro-porosity has also been reported (Mori, Fujihara, and Yamagishi Citation2014). The macro-pore in Mori, Fujihara, and Yamagishi (Citation2014) is around 10 mm in diameter, corresponding to the large macro-pore in this study.
In Vitric Andosols with less large macro-porosity and total porosity, OM incorporated into the 0–0.15 m layer could accumulate as SOC. Consistent with this, we observed no effect on the 0.15–0.30 m layer. The slope and R2 values presented in suggest that the C-containing manure application rate can more accurately account for SOC accumulation than the total C application rate in 0–0.15 and 0–0.30 m layers in Vitric Andosols. OM type was expected to influence the dynamics of OM incorporation into the soil, and SOC accumulation (Moreno-Cornejo et al. Citation2015). The CN ratio of OM, previously reported to influence CO2 emissions (Toma and Hatano Citation2007), did not clearly differ between manure and green manure (). Therefore, differences in environmental factors such as soil temperature and moisture after incorporation, might affect OM decomposition. These factors were not assessed in this study.
4.3. Physical protection of soil organic matter by micro-pore
In Silandic Andosols, SOC stock in the 0–0.15 m layer correlated significantly with micro-porosity (). This relationship indicates the existence of occluded SOM (Wagai, Mayer, and Kitayama Citation2009) and physical SOM stabilization by OM sequestration inside the micro-pores (Six et al. Citation2002). According to Wagai, Mayer, and Kitayama (Citation2009), the occluded low-density SOM fraction accounts for up to half of the total C in surface soils, and is inaccessible to microbes. Oxygen-depleted conditions inside the micro-pores decrease microbial activity (Smith et al. Citation2014). As discussed above, the soil structure was better developed in Silandic Andosols than in Vitric Andosols. It has been reported that the fractal dimension of pore distribution patterns is linearly correlated with the areal porosity (Lipiec, Hatano, and Słowińska-Jurkiewicz Citation1998). Therefore, the variation in micro-pore distribution in Silandic Andosols might become larger than that in Vitric Andosols. A clearer relationship between the micro-porosity and SOC stock was observable in Silandic Andosols ().
In this study, micro-porosity displayed strong positive correlation with WFPS, water holding capacity, and field water capacity (). SOM decomposition is slower in soils retaining higher moisture levels (Brady and Weil Citation2008). These results indicate that micro-pores contributed to SOM stabilization by physically protecting and maintaining soils with high WFPS.
Moreover, in this study site, Iwasaki, Endo, and Hatano (Citation2017) previously reported that the application of OM increases SOC when initial SOCstock (in 2001–2003) is lower than the threshold of 36.1 (Mg C ha−1 0.15 m−1), but a decrease in fields with higher initial SOCstock (in 2001–2003) than the threshold. In the present study, we revealed that soil structure development is another key factor in determining the OM application effect on SOC stock. In soils where SOC stock is decreasing over time, SOM decomposition proceeds from the relatively labile SOM fraction (Freixo et al. Citation2002). Therefore, the relatively stable SOM fraction becomes more important for SOC stock. These results suggest that in Vitric Andosols, where SOC stocks are significantly increased by OM application, relatively recent SOM accumulation has occurred. By contrast, in Silandic Andosols, which generally have higher SOC stock than the threshold with well-developed soil structure, SOM accumulates in the micro-pores in a more stable form.
5. Conclusions
This study aimed to evaluate the effect of long-term OM application on different ages of Andosols and to determine the factors affecting SOC stock. Twelve fields of Vitric Andosol and 22 fields of Silandic Andosols were selected in the same region. Vitric Andosols had a significantly lower SOC stock than Silandic Andosols did, which was characterized by a higher sand content. Two soil types showed different responses to the long-term OM application. An increased C application rate significantly increased the SOC stock in Vitric Andosols, but not in Silandic Andosols. On the other hand, SOC stock had a significant positive correlation with soil micro-pores in Silandic Andosols, suggesting physical protection of OM inside the micro-pore. These results suggest that there are different factors affecting SOC stock between Vitric and Silandic Andosols.
Acknowledgments
The authors are thankful to the staff of the Toya branch of the Japan Agricultural Cooperatives for their work on the field measurements and to the farmers of the Toya region for allowing us to conduct the study on their farms.
Disclosure statement
No potential conflict of interest was reported by the author(s).
References
- Acocella, V., R. D. Lorenzo, C. Newhall, and R. Scandone. 2015. “An Overview of Recent (1988 to 2014) CALDERA UNREST: Knowledge and Perspectives: CALDERA UNREST.” Reviews of Geophysics 53 (3): 896–955. doi:10.1002/2015RG000492.
- Andruschkewitsch, R., S. Daniel Geisseler, R. Dultz, G. Joergensen, and B. Ludwig. 2014. “Rate of Soil-Aggregate Formation under Different Organic Matter Amendments-a Short-Term Incubation Experiment.” Journal of Plant Nutrition and Soil Science 177 (2): 297–306. doi:10.1002/jpln.201200628.
- Aoyama, M., and Y. Taniuchi. 1992. “Organic Matter and Its Mineralization in Particle Size and Aggregate Size Fractions of Soils with Four-year Application of Farmyard Manure.” Japan Journal of Soil Science Plant Nutrition 63: 571–580. (In Japanese with English abstract).
- Beare, M. H., P. F. Hendrix, M. L. Cabrera, and D. C. Coleman. 1994. “Aggregate-Protected and Unprotected Organic Matter Pools in Conventional- and No-Tillage Soils.” Soil Science Society of America Journal 58 (3): 787–795. doi:10.2136/sssaj1994.03615995005800030021x.
- Bellamy, P. H., P. J. Loveland, R. I. Bradley, R. M. Lark, and G. J. D. Kirk. 2005. “Carbon Losses from All Soils across England and Wales 1978–2003.” Nature 437 (8): 245–248. doi:10.1038/nature04038.
- Brady, N. C., and R. R. Weil. 2008. The Nature and Properties of Soils. 14th ed. Upper Saddle River, N.J: Pearson Prentice Hall.
- Dane, J. H., and J. W. Hopmans. 2002. “Pressure Plate Extractor. In: Methods of Soil Analysis: Part 4 Physical Methods.” In Soil Science Society of America Inc., edited by J. H. Dane and G. C. Topp, 688–690. Vadose Zone Journal: Madison, Wisconsin, USA.
- Diba, F., M. Shimizu, and R. Hatano. 2011. “Effects of Soil Aggregate Size, Moisture Content and Fertilizer Management on Nitrous Oxide Production in a Volcanic Ash Soil.” Soil Science and Plant Nutrition 57 (5): 733–747. doi:10.1080/00380768.2011.604767.
- Elliott, E. T. 1986. “Aggregate Structure and Carbon, Nitrogen, and Phosphorus in Native and Cultivated Soils.” Soil Science Society of America Journal 50 (3): 627–633. doi:10.2136/sssaj1986.03615995005000030017x.
- Freixo, A. A., P. L. O. A. Machado, H. P. Santos, C. A. Silva, and F. S. Fadigas. 2002. “Soil Organic Carbon and Fractions of a Rhodic Ferralsol under the Influence of Tillage and Crop Rotation Systems in Southern Brazil.” Soil and Tillage Research 64 (3–4): 221–230. doi:10.1016/S0167-1987(01)00262-8.
- Gao, L., B. Wang, S. Li, H. Wu, X. Wu, G. Liang, D. Gong, X. Zhang, D. Cai, and A. Degré. 2019. “Soil Wet Aggregate Distribution and Pore Size Distribution under Different Tillage Systems after 16 Years in the Loess Plateau of China.” CATENA 173: 38–47. doi:10.1016/j.catena.2018.09.043.
- Gruba, P., and J. Mulder. 2015. “Tree Species Affect Cation Exchange Capacity (CEC) and Cation Binding Properties of Organic Matter in Acid Forest Soils.” Science of the Total Environment 511 (April): 655–662. doi:10.1016/j.scitotenv.2015.01.013.
- Guan, S., N. An, N. Zong, Y. He, P. Shi, J. Zhang, and N. He. 2018. “Climate Warming Impacts on Soil Organic Carbon Fractions and Aggregate Stability in a Tibetan Alpine Meadow.” Soil Biology & Biochemistry 116: 224–236. doi:10.1016/j.soilbio.2017.10.011.
- Håkansson, I., and J. Lipiec. 2000. “A Review of the Usefulness of Relative Bulk Density Values in Studies of Soil Structure and Compaction.” Soil and Tillage Research 53 (2): 71–85. doi:10.1016/S0167-1987(99)00095-1.
- Hao, X., C. Chang, G. R. Travis, and F. Zhang. 2003. “Soil Carbon and Nitrogen Response to 25 Annual Cattle Manure Applications.” Journal of Plant Nutrition and Soil Science 166 (2): 239–245. doi:10.1002/jpln.200390035.
- Imaya, A. 2020. “Classification of Volcanic Soils in the Soil Classification System of Japan and Verification Based on Forest Soils.” Soil Science and Plant Nutrition 66 (5): 673–679. doi:10.1080/00380768.2020.1782713.
- International Union of Soil Sciences (IUSS) Working Group WRB. 2015. “World Reference Base for Soil Resources 2014, Update 2015 International Soil Classification System for Naming Soils and Creating Legends for Soil Maps.” World Soil Resources Reports No. 106, Rome: FAO.
- Iwasaki, S., Y. Endo, and R. Hatano. 2017. “The Effect of Organic Matter Application on Carbon Sequestration and Soil Fertility in Upland Fields of Different Types of Andosols.” Soil Science and Plant Nutrition 63 (2): 200–220. doi:10.1080/00380768.2017.1309255.
- Johnson, K. D., J. Harden, A. D. McGuire, N. B. Bliss, J. G. Bockheim, M. Clark, T. Nettleton-Hollingsworth, et al. 2011. “Soil Carbon Distribution in Alaska in Relation to Soil-Forming Factors.” Geoderma 167–168 :71–84. doi:10.1016/j.geoderma.2011.10.006.
- Kanda, T., Y. Takata, K. Kohyama, and H. Obara. 2016. “Soil Map of Hokkaido Developed with the Comprehensive Soil Classification System of Japan, First Approximation: Change of Andosols Distribution Area in Forest.” Japan of Soil Science and Plant Nutrition 87: 184–192. (In Japanese with English abstract).
- Klute, A. 1965. “Laboratory Measurement of Hydraulic Conductivity of Saturated Soil. In: Methods of Soil Analysis: Part 1 Physical and Mineralogical Properties, Including Statistics of Measurement and Sampling, 9.1, edited by C. A. Black, D. D. Evans, J. L. White, L. E. Ensminger, and F. E. Clark, 210–221. Madison, Wisconsin, USA: American Society of Agronomy.
- Koga, N. 2017. “Tillage, Fertilizer Type, and Plant Residue Input Impacts on Soil Carbon Sequestration Rates on a Japanese Andosol.” Soil Science and Plant Nutrition 63 (4): 396–404. doi:10.1080/00380768.2017.1355725.
- Kundu, S., R. Bhattacharyya, V. P., . B. Ghosh, and H. Gupta. 2007. “Carbon Sequestration and Relationship between Carbon Addition and Storage under Rainfed Soybean–Wheat Rotation in a Sandy Loam Soil of the Indian Himalayas.” Soil and Tillage Research 92 (1–2): 87–95. doi:10.1016/j.still.2006.01.009.
- Lal, R. 2019. “Conceptual Basis of Managing Soil Carbon: Inspired by Nature and Driven by Science.” Journal of Soil and Water Conservation 74 (2): 29A–34A. doi:10.2489/jswc.74.2.29A.
- Limin, A., M. Shimizu, M. Mano, K. Ono, A. Miyata, H. Wada, H. Nozaki, and R. Hatano. 2015. “Manure Application Has an Effect on the Carbon Budget of a Managed Grassland in Southern Hokkaido, Japan.” Soil Science and Plant Nutrition 61 (5): 856–872. doi:10.1080/00380768.2015.1051930.
- Lipiec, J., R. Hatano, and A. SøowinÂska-Jurkiewicz. 1998. “The Fractal Dimension of Pore Distribution Patterns in Variously-Compacted Soil.” Soil and Tillage Research 47 (1–2): 61–66. doi:10.1016/S0167-1987(98)00073-7.
- Minasny, B., B. P. Malone, A. B. McBratney, D. A. Angers, D. Arrouays, A. Chambers, V. Chaplot, et al. 2017. “Soil Carbon 4 per Mille.” Geoderma 292 :59–86. doi:10.1016/j.geoderma.2017.01.002.
- Miyabuchi, Y., M. Okuno, M. Torii, M. Yoshimoto, and T. Kobayashi. 2014. “Tephrostratigraphy and Eruptive History of Post-Caldera Stage of Toya Volcano, Hokkaido, Northern Japan.” Journal of Volcanology and Geothermal Research 281: 34–52. doi:10.1016/j.jvolgeores.2014.05.019.
- Moreno-Cornejo, J., R. Zornoza, T. A. Doane, Á. Faz, and W. R. Horwath. 2015. “Influence of Cropping System Management and Crop Residue Addition on Soil Carbon Turnover through the Microbial Biomass.” Biology and Fertility of Soils 51 (7): 839–845. doi:10.1007/s00374-015-1030-3.
- Mori, Y., A. Fujihara, and K. Yamagishi. 2014. “Installing Artificial Macropores in Degraded Soils to Enhance Vertical Infiltration and Increase Soil Carbon Content.” Progress in Earth and Planetary Science 1 (1): 30. doi:10.1186/s40645-014-0030-5.
- Naveed, M., P. Moldrup, H. J. Vogel, M. Lamandé, D. Wildenschild, M. Tuller, and L. W. Jonge. 2014. “Impact of Long-Term Fertilization Practice on Soil Structure Evolution.” Geoderma 217–218: 181–189. doi:10.1016/j.geoderma.2013.12.001.
- Obara, H., Y. Takata, K. Kohyama, T. Ohkura, Y. Maejima, S. Wakabayashi, and T. Kanda. 2016. “A New Soil Map of Japan Based on Comprehensive Soil Classification System of Japan First Approximation.” Bulletin of National Institute for Agro-environmental Sciences 37: 133–148.
- Oldfield, E. E., M. A. Bradford, and S. A. Wood. 2019. “Global Meta-Analysis of the Relationship between Soil Organic Matter and Crop Yields.” SOIL 5 (1): 15–32. doi:10.5194/soil-5-15-2019.
- R Core Team. 2020. “R: A Language and Environment for Statistical Computing.” R Foundation for Statistical Computing, Vienna, Austria ISBN 3-900051-07-0. http://www.R-project.org/
- Sakaguchi, M., M. Sakurai, and T. Nakatuji. 2010. ““Rapid Analysis of Autoclaveextractable Nitrogen for Assessing Soil Nitrogen Fertility by UV Absorptiometry of 1-tryptophan as a Standard Substance.” Japan Journal of Soil Science and Plant Nutrition 81: 140–143. in Japanese.
- Shahbaz, M., Y. Kuzyakov, and F. Heitkamp. 2017. “Decrease of Soil Organic Matter Stabilization with Increasing Inputs: Mechanisms and Controls.” Geoderma 304: 76–82. doi:10.1016/j.geoderma.2016.05.019.
- Shirato, Y., T. Hakamata, and I. Taniyama. 2004. “Modified Rothamsted Carbon Model for Andosols and Its Validation: Changing Humus Decomposition Rate Constant with Pyrophosphate-Extractable Al.” Soil Science and Plant Nutrition 50 (1): 149–158. doi:10.1080/00380768.2004.10408463.
- Shoji, S., M. Nanzyo, and R. A. Dahlgren. 1993. “Volcanic Ash Soils.” 48 (155): 162–163, 263. Elsevier, Amsterdam.
- Six, J., R. T. Conant, E. A. Paul, and K. Paustian. 2002. “Stabilization Mechanisms of Soil Organic Matter: Implications for C-Saturation of Soils.” Plant and Soil 241 (2): 155–176. doi:10.1023/A:1016125726789.
- Smith, A. P., E. Marín-Spiotta, M. A. de Graaff, and T. C. Balser. 2014. “Microbial Community Structure Varies across Soil Organic Matter Aggregate Pools during Tropical Land Cover Change.” Soil Biology & Biochemistry 77: 292–303. doi:10.1016/j.soilbio.2014.05.030.
- Soil Survey Staff. 1999. “Soil Taxonomy-A Basic System of Soil Classification for Making and Interpreting Soil Surveys.” In 2nd Ed. USDA-NRCS Agric. Handb, 436. Washington, DC: US Government Printing Office.
- Takahashi, T., and R. A. Dahlgren. 2016. “Nature, Properties and Function of Aluminum–Humus Complexes in Volcanic Soils.” Geoderma 263: 110–121. doi:10.1016/j.geoderma.2015.08.032.
- Toma, Y., and R. Hatano. 2007. “Effect of Crop Residue C:N Ratio on N 2 O Emissions from Gray Lowland Soil in Mikasa, Hokkaido, Japan.” Soil Science and Plant Nutrition 53 (2): 198–205. doi:10.1111/j.1747-0765.2007.00125.x.
- Torn, M. S., S. E. Trumbore, O. A. Chadwick, P. M. Vitousek, and D. M. Hendricks. 1997. “Mineral Control of Soil Organic Carbon Storage and Turnover.” Nature 389 (6647): 170–173. doi:10.1038/38260.
- Tsai, C. C., Z. S. Chen, C. I. Kao, F. Ottner, S. J. Kao, and F. Zehetner. 2010. “Pedogenic Development of Volcanic Ash Soils along a Climosequence in Northern Taiwan.” Geoderma 156 (1–2): 48–59. doi:10.1016/j.geoderma.2010.01.007.
- Wagai, R., L. M. Mayer, and K. Kitayama. 2009. “Nature of the ‘Occluded’ Low-Density Fraction in Soil Organic Matter Studies: A Critical Review.” Soil Science and Plant Nutrition 55: 13–25. doi:10.1111/j.1747-0765.2008.00356.x.
- World Meteorological Organization (WMO). 2018. “The State of Greenhouse Gases in the Atmosphere Based on Global Observations through 2017.” WMO Greenhouse Gas Bulletin 8, 1-8.
Appendix
Figure A1. Relationship between sand content and soil physicochemical properties in the 0–0.15 m layer. The error bar represents the standard deviation. SOC: soil organic carbon; STN: soil total nitrogen; CEC: cation exchange capacity
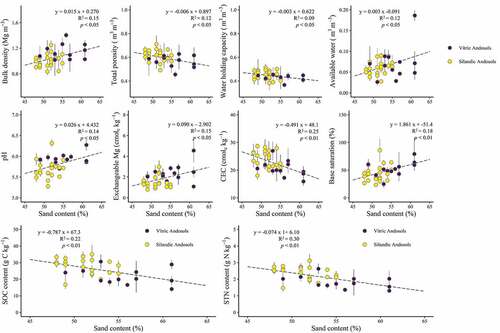
Figure A2. Relationship between (a) SOC content and STN content; (b) WESOC and available N. The error bar represents the standard deviation. SOC: soil organic carbon; STN: soil total nitrogen; WESOC: water extracted soil organic carbon; Available N: Thermal extracted nitrogen suggested by .Sakaguchi, Sakurai, and Nakatuji (Citation2010)