
ABSTRACT
Selenium (Se) is an essential element for the human body. Humans meet their basic Se requirements primarily through food consumption. The largest Se-rich contiguous area in China is located in the southeast of Guangxi. In this study, the Se accumulation and translocation in the Guangxi rice–soil system was assessed. Organically bound Se (O-Se) was found to be the main type of soil Se (72.5%), and had a good linear relationship with soil total Se (TSe) and soil organic matter (SOM); the three forms were closely related and thus, affected each other. The contents of Se in the various plant organs were highly correlated. The roots had the greatest Se concentration, followed by the stems, grains, and lastly the leaves. The distribution coefficient of grain/stem (0.74) was greater than that of grain/leaf (0.54), suggesting that the migration of Se in plants may have apical dominance and/or reproductive advantages. Ligand-exchangeable Se, water-soluble Se, and residual Se had little effect on the accumulation of Se in the soil and plants. The soil S content showed no significant correlation with the various types of soil Se and TSe, but showed a low correlation with the Se content in various plant organs. SOM played a special role in the translocation of Se between the soil and plants, which affected the absorption and accumulation of Se by plants. SOM can affect the content of O-Se and, consequently, of TSe in the soil. SOM can also directly or indirectly affect the Se content in various plant organs, especially the Se concentration in rice grains.
KEY WORDS:
1. Introduction
Numerous studies have demonstrated the importance of Se to human health. Notably, excessive Se intake can cause staggering disease (Gissel-Nielsen et al. Citation1984), and Se deficiency causes Keshan and Kashin–Beck diseases (Shao and Zheng Citation2008), although it also contributes to the prevention of cancer and cardiovascular disease and has anti-aging effects (Schrauzer and Surai Citation2009). The recommended Se daily intake is 55 μg for humans (Navarro-Alarcon and Cabrera-Vique Citation2008); however, the abundance of Se in the earth’s crust is only 0.05–0.09 mg/kg (Wang and Gao Citation2001). Therefore, there are approximately 0.5–1 billion Se-deficient people worldwide. In China, nearly two-thirds of planting soils are Se-deficient, leading to a lack of Se intake among the local population (Combs Citation2001; Zhang et al. Citation2014a). Therefore, the Se content of food crops needs to be increased through the external administration of this element, as the most effective and safe way to supplement Se to locals is through the consumption of Se-rich organic foods (Finley and Davis Citation2001).
Although Se is a beneficial element for plants, excessive Se supplementation can cause plant poisoning (Han et al. Citation2013). The consumption of plants, which take up the Se present in the soil, is the primary source of Se in the human body (Rayman Citation2008). Se absorption by plants is related to many factors, such as the content of Se in soil, the types of plants, and the physical and chemical properties of the soil (Antanaitis et al. Citation2008). As rice is the main food crop in China, several studies have focused on the Se absorption by rice plants and enrichment characteristics of Se in the soil (Qin et al. Citation2013; Zhang et al. Citation2014c). The distribution of Se in the earth’s crust is extremely uneven (Tolu et al. Citation2014); Se-enriched areas can be found in the United Kingdom (Bullock et al. Citation2018), Japan (Yanai, Mizuhara, and Yamada Citation2015; Yamada et al. Citation2009), and some areas in Saudi Arabia (Al-Farhud, Al-Sewailem, and Usman Citation2017), Poland (Patorczyk-Pytlik and Kulczycki Citation2009) have low amounts of Se. China has Se-enriched (Zhu and Zheng Citation1999) as well as low Se areas (Chen et al. Citation1991). However, the Se content in plants is determined by the proportion of Se in the soil rather than by the total amount of Se in the soil (He et al. Citation1996). Plants have different absorption mechanisms for different types of Se during the various stages of growth. The transformation of Se in the soil is affected by various factors, such as pH, S, and total organic carbon (Wang et al. Citation2017, Citation2018, Citation2019; Dinh et al. Citation2017).
According to the Guangxi Zhuang Autonomous Region government’s report, the geochemical survey of 23 cities (counties and districts) performed by the Chinese geological and mining department revealed that Guangxi currently has almost 30,000 km2 of Se-rich soil, which represents the largest contiguous Se-rich soil area in China (Tang Citation2019). This was due to the carbonate rock formations with high Se content in the Devonian, Carboniferous, and Permian (Liu, Chen, and Pan et al. Citation2018). The content of Se in the soil is not currently changing over time, but gradually decreases from the southeast (0.81 mg/kg) to the northwest (0.44 mg/kg) of Guangxi (Ban and Ding Citation1992). The Se-enriched status of Enshi in China is garnering increasing attention in the research community, although its Se-contaminated area is relatively large, and human and livestock Se poisoning incidents are frequent (Chang et al. Citation2019; Qin, Zhu, and Su Citation2012; Qin et al. Citation2013). In comparison, Guangxi, has moderate soil Se content, which avoids excessive or lack of Se in rice, and is more conducive to meet the human health demands for Se. Therefore, it is of great practical significance to study the distribution and translocation of Se in soil–rice systems in this area. To the best of our knowledge, this is the first report on the migration of Se in the soil–rice system of Guangxi, China. Currently, a unified understanding of the correlation between different types of Se in soil and Se content in plants is not yet available, as few studies have focused on the correlation between the Se content in various plant organs and the different types of Se in the soil. In particular, the Se types that are mainly absorbed by rice plants are still debated, and there are no relevant reports on the Se migration in the soil–rice plant system of Guangxi. Therefore, the primary objectives of this study are to: (i) reveal the Se migration and transformation rules between the environment and organisms, as well as their influencing factors, and (ii) clarify the influence of various types of Se in the soil on the absorption of rice plants.
Materials and Methods
2. Sample collection and preparation
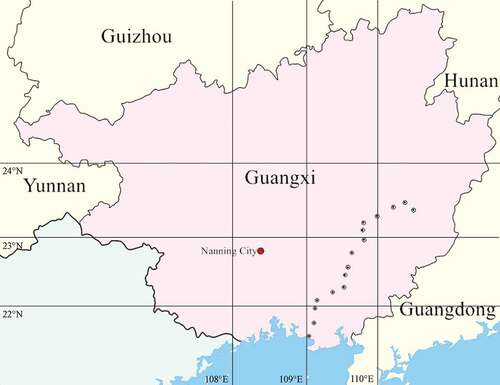
The samples were collected in July 2020, which corresponds to the mature season of early rice. The study area has a subtropical monsoon climate, where the average annual rainfall is 1,500–1,800 mm and the annual average temperature is 21–24°C. The 16 sampling sites were located in rice fields in southeast Guangxi, which corresponds to the overlap between the main area of high-quality rice production in Guangxi and the Se-rich soil area, as shown in (109.09°–110.50° E, 21.66°–23.39° N; further information on sampling sites is listed in Table S1). All sampling sites had lowland paddy soil with a deep tillage of approximately 20 cm and the rice plants had been grown for more than five years. The soil texture was clay loam or clay. During the rice maturity period, multi-point sampling was adopted and three rice plots with an area of 2–3 m2 were selected for each sampling site. The 10 rice samples were collected from each rice plot and mixed together; the same was performed on 10 soil samples of the corresponding cultivated 0–20 cm soil layer (Williams et al. Citation2009). The rice samples were separated into roots, stems, leaves, and grains, washed with distilled deionized water (dd H2O), fixed in an oven at 95°C for 30 mins, and dried at 60°C until a constant weight was reached. The dried samples were then transformed into powder with a high-speed crusher (BJ-800A, Baijie Electric Co., Ltd., Hangzhou, China), and subsequently sealed and stored in a polyethylene plastic sample bag for later use. Soil samples were air-dried, and impurities were removed. Samples were subsequently crushed with a wooden hammer, and passed through a 100-mesh (0.149 mm) nylon sieve before bagging for storage. On average, 91% (by weight) of each soil sample can be sieved smoothly, suggesting the 100-mesh sieve is suitable for the following analysis of the soil samples.
Figure 1. Overview of the study area and sampling locations. The sampling points from the southwest to the northeast are numbered 1–16
3. Chemical analysis
Se analysis was performed at the Guangxi Key Laboratory of Agricultural Resources Chemistry and Biotechnology. The national standard soil sample GBW07407 and plant sample GBW10020 were used for quality control analysis. The total Se (TSe), organically bound Se (O-Se), ligand-exchangeable Se (L-Se), water-soluble Se (W-Se), and residual Se (R-Se) in soil were measured. The recovery rate of all samples was close to 100%. The methodological procedures of Zhu et al. (Citation2008) were used to determine the Se content in soil and plant samples. Briefly, 0.50–2.00 g of plant powder or soil sample were weighted into a clean microwave digestion instrument (TANK, Sineo Microwave Chemistry Technology Co., LTD, Shanghai, China) inner tank, after which 10 mL of HNO3 and 2 mL of H2O2 were added to decompose the sample. After the digestion was complete, the solution was transferred into a 50 mL beaker with a washing bottle, where 0.5 mL of HClO4 were added; the sample was then dissolved on a hot plate until the HClO4 evaporated and diluted to 50 mL with dd H2O. A total of 5 mL of the solution were collected and the Se content was determined with a liquid chromatography-atomic fluorescence spectrometer (LC-AF 7590, EWAI, Beijing) (Zhu et al. Citation2008). The description and determination method of Se types in soil is provided in .
Table 1. The description and determination of the Se types in paddy soil
4. Soil properties
After mixing the soil with water (1:2.5), a pH meter (Leici PHS-3 C, INESA Scientific Instrument Co., Ltd, Shanghai) was used to determine the soil pH.
The K2Cr2O7 volumetric method was used for the determination of the soil organic matter (SOM) content (Wang et al. Citation2012). The total soil S content was determined using the Mg(NO3)2 oxidation-BaSO4 turbidimetric method. The neutralization titration method was used to determine soil CaCO3 content: a total of 20 mL of 0.5 M HCl solution were added to 3 g of air-dried soil samples to release the generated CO2, after which two drops of phenolphthalein indicator were added, and the remaining HCl was titrated with 0.25 M NaOH until the solution turned reddish; the soil CaCO3 content was then calculated based on the used amount of NaOH solution.
5. Statistical analysis
A one-way analysis of variance was performed using statistical software SPSS v. 17.0, and the correlation coefficient and significance probability of linear regression fitting were calculated according to Pearson correlation analysis. Origin 2018 software was used for graphic production.
Results
6. Soil characteristics
Soil pH is a comprehensive reflection of soil physical and chemical properties, and it influences the chemical types of absorbed Se. The variation of the paddy soil’s pH was relatively small (5.19–6.22), with an average of 5.53 ± 0.30, which represents a weakly acidic soil. The SOM content varied greatly, ranging from 1.21% to 3.92%, with an average of 2.44 ± 0.17% and a coefficient of variation of 0.28. The total S and CaCO3 contents in the soil were 110.03–591.54 mg/kg and 13.33–59.33 g/kg, respectively. The Se content in the surface paddy soil was 0.11–0.91 mg/kg, with an average of 0.52 ± 0.05 mg/kg. The soil characteristics of this study area and the comparison with those of different Se-rich areas are listed in .
Table 2. Comparison of soil characteristics between this study and other selenium-rich regions
7. Distribution and translocation of Se in rice plant tissues
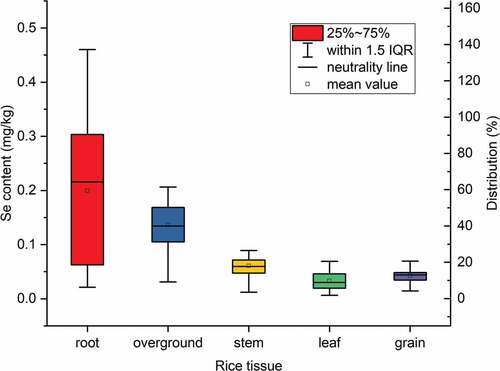
The Se content of rice roots was 0.02–0.46 mg/kg (), which was generally lower than the soil Se content, and the root-soil distribution coefficient was between 0.04–1.41, indicating that rice roots have a low accumulation ability from the soil. The amount of Se in the aboveground parts of rice plants was generally lower than that of the root system. The Se content was greater in the roots (59.4%), followed by the stems (18.1%), grains (12.6%), and leaves (9.8%) (). The Se content in the shoots only accounted for 27.5%–68.8% of the total Se content of the plant. The root/stem distribution coefficient was 0.16–0.84 (), with an average value of 0.43, which was slightly higher than the root/soil distribution coefficient (0.41). This suggests that after the different rice roots absorb Se from the soil, the ability to translocation it to the aboveground plant parts is quite different. The average grain/stem distribution coefficient was 0.74, indicating that the Se translocation capacity between grains and stems is greater than that between stems and roots.
Table 3. Relationship between the distribution of Se content in different parts of rice plant tissues and soil
Figure 2. Distribution and concentration of Se in rice plant tissues. IQR: interquartile range
8. Types and potential influencing factors of soil Se content
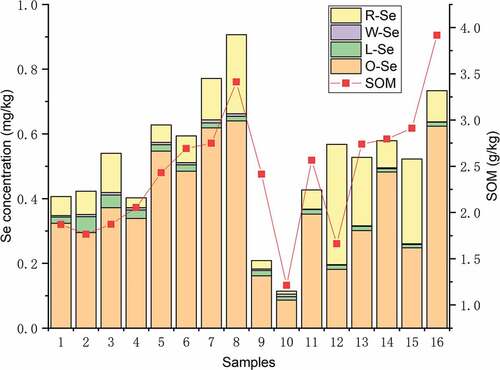
The TSe in the soil was 0.11–0.73 mg/kg, and the average proportions of the four types of Se in TSe were: 72.5% O-Se (0.39 mg/kg), 3.6% L-Se (0.19 mg/kg), 1.0% W-Se (0.005 mg/kg), and 22.9% R-Se (0.12 mg/kg) (). O-Se was the most represented type of Se in 93.8% of soil samples, accounting for more than half of the total amount, being much higher than other types. Among the four types of Se in the soil, the correlation coefficient between O-Se and TSe was high (r = 0.87, p < 0.01) (), indicating that the O-Se in the soil directly affects the TSe content and that the enrichment of Se is closely related to the activities of SOM.
Table 4. Pearson correlation matrix of soil properties, Se concentration in rice plant tissues, and soil Se type in Guangxi
Figure 3. SOM and content of each type of Se in paddy soil of the 16 sampling sites
9. Discussion
The soil Se content is generally used to classify the soil type. According to Zhang et al. (Citation2014c) and Zhang et al. (Citation2014b), who proposed that soil with a Se content of 0.4–3.0 mg/kg is considered Se-rich, 87.5% of our samples were Se-rich soil, as their Se content exceeded 0.40 mg/kg. Although this value is lower than the soil Se level (0.85–11.46 mg/kg) in the ‘Se capital’ in the Enshi region (Chang et al. Citation2019), it is higher than the average soil Se in China (0.29 mg/kg) (Chen et al. Citation1991). The Se content in the roots (59.4%) was greater than the sum of the Se content in other plant parts, indicating that Se accumulates in the roots and is not easy to translocation, which is consistent with the findings of previous studies (Chang et al. Citation2019; Huang et al. Citation2015). Sun et al. (Citation2010) reported that the Se content in grains in Enshi is between 2.2 and 8.4 mg/kg, which is much higher than the Se content of 0.01–0.07 mg/kg found in Guangxi. Since food items with a Se content exceeding 0.3 mg/kg represent a risk for poisoning (Chang et al. Citation2019), our findings demonstrate that the rice planted in the study area has good edible value.
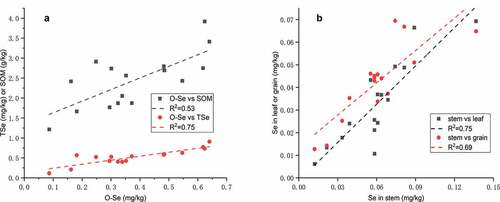
The root/stem distribution coefficient (0.43) was higher than the root/soil (0.41), but lower than the grain/stem distribution coefficient (0.74). This may have been caused by the presence of Se in the form of selenite in the roots. Se in acid (Elrashidi et al. Citation1987) and hypoxic soils (such as flooded rice fields) (Zhu et al. Citation2009) mainly exists in the form of selenite, which is often converted into selenomethionine, its oxide, selenomethylcysteine, and other derivatives; these types of substances mainly concentrate in the roots, as their translocation to the aboveground plant tissues is difficult (Li, McGrath, and Zhao Citation2008). In addition, the average and median Se content in rice grains was higher than that of leaves, but slightly lower than that of stems, resulting in a grain/stem distribution coefficient (0.74) greater than that of grain/leaf (0.54), indicating that the translocation of Se may have apical dominance or reproductive development advantages. Sun et al. (Citation2010) reported that the average grain/stem distribution coefficient of rice was 0.75 in four villages in Hubei, China, ranging between 0.28 and 1.59, which is consistent with our results. This is much lower than the average grain/stem distribution coefficient of 2 found in the Se-polluted area of Yutangba, Enshi (Zhu et al. Citation2008). Eiche et al. (Citation2015) found that the Se concentration in wheat and mustard plant tissues was 15–30 times that in the soil, which indicates that the accumulation levels of Se in plants are varied. This variation may be explained by two factors: different crops have different Se accumulation mechanisms, and soil Se pollution increases the ability of plants to accumulate Se; this requires further research. Moreover, the Se concentration in the stem tissues was significantly positively correlated with that in leaves (R2 = 0.75, p < 0.01) and grains (R2 = 0.69, p < 0.01) (), had different distribution coefficients, and the correlation between the Se concentration in stems and leaves was slightly higher than that between stems and grains.
Figure 4. (A) Relationship between TSe, SOM, and O-Se in paddy soil. (B) Relationship between Se content in leaf, grain and stem in rice tissues
The paddy soil in this study area is acidic under anaerobic conditions, and the soil pH value had a significant correlation with the content of TSe (r = 0.63, p < 0.01) and O-Se (r = 0.58, p < 0.05). Eich-Greatorex et al. (Citation2007) reported that soil pH had a negative correlation with the Se content of wheat grown in peat soil, while the Se content of wheat grown in loam soil had a positive correlation. This may be related to the increased plant resistance provided by Se. In environments that are unsuitable for plant growth, Se helps ensure the normal growth and development of plants, as well as the absorption and utilization of minerals, while enhancing their resistance to biotic and abiotic stresses (Reynolds and Pilon-Smits Citation2018). Although soils with acidic and anaerobic conditions have a stronger ability to fix Se, plants present a lower Se absorption rate (Johnson et al. Citation2000; Cao et al. Citation2001; Sharma et al. Citation2015). The translocation of Se from plant roots to aboveground parts is mainly achieved through the xylem (Zhu et al. Citation2009; Li, McGrath, and Zhao Citation2008; Wolswinkel Citation1992). However, most nutrients are imported into the seeds from the source leaves along the phloem pathway (Zhang et al. Citation2007; Patrick and Offler Citation2001). As such, like other nutrients, the accumulation of Se in rice grains may be primarily carried out through the phloem. In other words, during grain development, Se compounds are transported to the developing rice seeds through the phloem and combined with the protein or starch granules (Moore et al. Citation2010). In this study, the correlation between the Se content in leaves and grains also reached an extremely significant level (r = 0.65, p < 0.01), indicating that leaves directly or indirectly participated in the process of Se accumulation in grains.
The changes between L-Se, W-Se, and R-Se within the TSe were extremely small, and the correlation was not significant. It shows that the W-Se in most soils in Guangxi is basically in a state of dissolution equilibrium, while SOM pellets in the soil have a strong adsorption capacity for Se. The proportion of R-Se in the TSe was second only to O-Se, indicating that a considerable amount of Se is attached to the mineral lattice and cannot be absorbed by crops. Bisbjerg (Citation1972) found a strong correlation between W-Se and crop absorption in pot experiments, but not in field experiments. In this study, the W-Se content was 0.005 mg/kg, which accounts for 1% of TSe. This value is close to the average level in farmland soils in China (0.006 mg/kg) (Tan et al. Citation2002), while the proportion of W-Se is almost equal to that of Enshi (1.14%) (Chang et al. Citation2019). O-Se in soil was significantly positively correlated with TSe (R2 = 0.75, p < 0.01) and SOM (R2 = 0.53, p < 0.01) (), suggesting that the concentration of O-Se determines the content of TSe in the soil, and that SOM has a major impact on the concentration of O-Se and TSe, which is similar to the findings of previous reports (Johnsson Citation1991; Li et al. Citation2017). O-Se is the main potential source of soil Se for plants. When the balance between the original Se types in the soil is destroyed, O-Se can be partially released as a fraction from the Se complex bound by SOM (Li et al. Citation2017). SOM has a dual role in regulating the bioavailability of soil Se: it reduces it through fixation, which causes plants to reduce Se accumulation, and provides more Se sources through the decomposition of O-Se, which is in line with the dynamic balance of O-Se Se fractionation and decomposition in natural soils (Li et al. Citation2017).
SOM represents a variety of soil organic compounds containing C, and has two main effects on the soil Se content: SOM itself contains organic Se and it acts on the fixation of Se in the soil, directly affecting the Se concentration in soils with high SOM. SOM not only provides a source of Se, but also increases its fixation, thus increasing the soil Se content. In a high pH environment, the hydrolysis of SOM causes an increase in the soluble Se content (Yanai, Mizuhara, and Yamada Citation2015). In this study, the correlation between SOM, pH, TSe, and O-Se was significant (), which confirms this theory. The Se leached in acid soils is primarily of the O-Se type, and the large accumulation of SOM reduces the availability of Se to crops (Gustafsson and Johnsson Citation1992). This also explains the low Se accumulation capacity of rice plants in the study area. SOM had a very significant correlation with soil TSe (r = 0.70, p < 0.01), which is consistent with the results of previous studies (Bujdoš, Kubová, and Streško Citation2000; Eich-Greatorex et al. Citation2007) because, under natural conditions, SOM often acts as an environmental host of anions and fixes Se in the soil (Gustafsson et al. Citation1993), resulting in the adsorption of Se by the soil. SOM also had significant correlations with pH, TSe, O-Se, and grains; the correlation with O-Se was the highest (r = 0.73, p < 0.01), indicating that the soil SOM content in the study area has a positive effect on the concentration of TSe and O-Se, which corroborates the findings of previous studies (Wang et al. Citation2016; Martens and Suarez Citation1997). Although the concentration of TSe in soil is high in some areas, the large fixation due to high SOM content (6–10%) results in a low bioavailability of Se in soil, which affects the absorption of soil Se by plants (Wang and Gao Citation2001; Floor et al. Citation2011; Johnson et al. Citation2000). In this study, the increase of SOM content did not inhibit the plants absorption of Se, but displayed a weak positive correlation with the Se content in the roots (r = 0.30) (Figure S1). This is related to the low SOM content (1.21–3.92%) in the study area.
The correlation between the content of R-Se, W-Se, L-Se, and the other types of Se was not significant, as was that between the content of Se in the various plant tissues. This differs from the situation reported in the Enshi area (Chang et al. Citation2019). In addition, O-Se not only had a significant correlation with TSe, but also affected the Se content in the roots (r = 0.63, p < 0.01), stems (r = 0.55, p < 0.05), and leaves (r = 0.53, p < 0.05) of rice plants (), although the Se content in grains did not reach a significant level. Our findings indicated a significant positive correlation between the Se concentration in various plant tissues and that between the stems and leaves was extremely significant (r = 0.87, p < 0.01). In terms of crop quality, the correlation between the Se concentration in the grains and in stems was the highest (r = 0.83, p < 0.01), while the correlations with soil pH, TSe, and O-Se did not reach significant levels. Interestingly, there was a significant correlation between the Se content in the grains and SOM. The correlation between total soil S, CaCO3, and the various types of Se did not reach a significant level. There was a significant positive correlation between the W-Se and L-Se contents and the O-Se content in maize soils in Shaanxi, China, while the R-Se content had no significant correlation (Wang et al. Citation2012). In this study, L-Se, W-Se, and R-Se had no significant correlation with other types of soil Se and the Se content in plant tissues, which shows the difference in the relationship between the concentrations of various types of Se in dryland and paddy soils.
9. Conclusion
The soil in the study area was weakly acidic, with a Se content of 0.11–0.95 mg/kg, and 87.5% of the soil samples were Se-rich. The O-Se was the main type of Se, and there was a significant correlation between the soil pH, SOM, TSe, and O-Se. Our findings differ from those of previous studies, as the L-Se, W-Se, and R-Se had little effect on the accumulation of Se in the soil and plants. We also observed that the translocation of Se in plants has reproductive advantages. This study thoroughly explored the distribution characteristics and migration rules of Se in a soil–rice system and provided a scientific basis for the development and utilization of Se resources in Guangxi, as well as for the development of a Se-enriched high-quality rice industry.
Supplemental Material
Download PDF (241.3 KB)Acknowledgments
The authors thank the financial support provided by the Guangxi Science and Technology Program Project of China (GuiKe AA17202037, GuiKe AD19245169, GuiKe AD18281072), PhD. Startup Project of Yulin Normal College (G2020ZK13) and Yulin Science, and Technology Program Project (Yushikeneng 20194301, Yushike 20204038, Yushikete 202020001).
Disclosure statement
No potential conflict of interest was reported by the author(s).
Supplementary material
Supplemental data for this article can be accessed here.
Additional information
Funding
References
- Abrams, M., R. Burau, and R. Zasoski. 1990. “Organic Selenium Distribution in Selected California Soils.” Soil Science Society of America Journal 54 (4): 979–982. doi:10.2136/sssaj1990.03615995005400040007x.
- Al-Farhud, A., M. Al-Sewailem, and A. R. A. Usman. 2017. “Status of Selenium and Trace Elements in Some Arid Soils Cultivated with Forage Plants: A Case Study from Saudi Arabia.” International Journal of Agriculture & Biology 19 (1): 85–92. doi:10.17957/IJAB/15.0247.
- Antanaitis, A., J. Lubyte, S. Antanaitis, G. Staugaitis, and P. Viskelis. 2008. “Selenium Concentration Dependence on Soil Properties.” Journal of Food Agriculture and Environment 6: 163–167.
- Ban, L., and Y. F. Ding. 1992. “Distribution Characteristics of Selenium in Guangxi Soil.” Environmental Monitoring in China 8: 98–101.
- Bisbjerg, B. 1972: “Studies on Selenium in Plants and Soils. Risø Report 200.” Denmark Danish Atomic Energy Commission, Research Establishment Risø, Roskilde.
- Bujdoš, M., J. Kubová, and V. Streško. 2000. “Problems of Selenium Fractionation in Soils Rich in Organic Matter.” Analytica Chimica Acta 408 (1–2): 103–109. doi:10.1016/S0003-2670(99)00845-4.
- Bullock, L. A., J. Parnell, M. Perez, J. G. Armstrong, J. Feldmann, and A. J. Boyce. 2018. “High Selenium in the Carboniferous Coal Measures of Northumberland, North East England.” International Journal of Coal Geology 195: 61–74. doi:10.1016/j.coal.2018.05.007.
- Cao, Z. H., X. C. Wang, D. H. Yao, X. L. Zhang, and M. H. Wong. 2001. “Selenium Geochemistry of Paddy Soils in Yangtze River Delta.” Environment International 26 (5–6): 335–339. doi:10.1016/S0160-4120(01)00009-5.
- Chang, C., R. Yin, X. Wang, S. Shao, C. Chen, and H. Zhang. 2019. “Selenium Translocation in the Soil-rice System in the Enshi Seleniferous Area, Central China.” Science of the Total Environment 669: 83–90. doi:10.1016/j.scitotenv.2019.02.451.
- Chen, J., F. Wei, C. Zheng, Y. Wu, and D. C. Adriano. 1991. “Background Concentrations of Elements in Soils of China.” Water, Air, and Soil Pollution 57-58 (1): 699–712. doi:10.1007/BF00282934.
- Chilimba, A. D., S. D. Young, C. R. Black, M. C. Meacham, J. Lammel, and M. R. Broadley. 2012. “Agronomic Biofortification of Maize with Selenium (Se) in Malawi.” Field Crops Research 125: 118–128. doi:10.1016/j.fcr.2011.08.014.
- Combs, G. 2001. “Selenium in Global Food Systems.” British Journal of Nutrition 85 (5): 517–547. doi:10.1079/BJN2000280.
- Dhillon, K. S., and S. K. Dhillon. 2000. “Selenium Accumulation by Sequentially Grown Wheat and Rice as Influenced by Gypsum Application in a Seleniferous Soil.” Plant and Soil 227 (1/2): 243–248. doi:10.1023/A:1026579116794.
- Dinh, Q. T., Z. Li, T. A. T. Tran, D. Wang, and D. Liang. 2017. “Role of Organic Acids on the Bioavailability of Selenium in Soil: A Review.” Chemosphere 184: 618–635.
- Eiche, E., F. Bardelli, A. K. Nothstein, L. Charlet, J. Göttlicher, R. Steininger, K. S. Dhillon, et al. 2015. “Selenium Distribution and Speciation in Plant Parts of Wheat (Triticum Aestivum) and Indian Mustard (Brassica Juncea) from a Seleniferous Area of Punjab, India”. Science of the Total Environment 505: 952–961. 10.1016/j.scitotenv.2014.10.080.
- Eich-Greatorex, S., T. A. Sogn, A. F. Øgaard, and I. Aasen. 2007. “Plant Availability of Inorganic and Organic Selenium Fertiliser as Influenced by Soil Organic Matter Content and pH.” Nutrient Cycling in Agroecosystems 79 (3): 221–231. doi:10.1007/s10705-007-9109-3.
- Elrashidi, M. A., D. C. Adriano, S. M. Workman, and W. L. Lindsay. 1987. “Chemical Equilibria of Selenium in Soils: A Theoretical Development1.” Soil Science 144 (2): 141–152. doi:10.1097/00010694-198708000-00008.
- Finley, J. W., and C. D. Davis. 2001. “Selenium (Se) from High-selenium Broccoli Is Utilized Differently than Selenite, Selenate and Selenomethionine, but Is More Effective in Inhibiting Colon Carcinogenesis.” BioFactors 14 (1–4): 191–196. doi:10.1002/biof.5520140124.
- Floor, G. H., S. Calabrese, G. Román-Ross, W. D´Alessandro, and A. Aiuppa. 2011. “Selenium Mobilization in Soils Due to Volcanic Derived Acid Rain: An Example from Mt Etna Volcano, Sicily.” Chemical Geology 289 (3–4): 235–244. doi:10.1016/j.chemgeo.2011.08.004.
- Ge, X., J. Li, G. Wan, G. Zhang, and Z. Zhang. 2000. “Study on Characteristics of Selenium Geochemical Speciation in Soil in Zhangjiakou Keshan Disease Area.” Rock Miner Anal 19: 254–258.
- Gissel-Nielsen, G., U. C. Gupta, M. Lamand, and T. Westermarck. 1984. “Selenium in Soils and Plants and Its Importance in Livestock and Human Nutrition.” Advances in Agronomy 37: 397–460.
- Gustafsson, J. P., G. Jacks, B. Stegmann, and H. B. Ross. 1993. “Soil Acidity and Adsorbed Anions in Swedish Forest Soils—long-term Changes.” Agriculture, Ecosystems & Environment 47 (2): 103–115. doi:10.1016/0167-8809(93)90105-X.
- Gustafsson, J. P., and L. Johnsson. 1992. “Selenium Retention in the Organic Matter of Swedish Forest Soils.” Journal of Soil Science 43 (3): 461–472. doi:10.1111/j.1365-2389.1992.tb00152.x.
- Han, D., X. Li, S. Xiong, S. Tu, Z. Chen, J. Li, Z. Xie, et al. 2013. “Selenium Uptake, Speciation and Stressed Response of Nicotiana Tabacum L.” Environmental and Experimental Botany 95: 6–14. 10.1016/j.envexpbot.2013.07.001.
- He, Z. L., X. E. Yang, Z. X. Zhu, W. P. Xia, J. M. Pan, and X. Y. Liu. 1996. “Fractionation of Soil Selenium with Relation to Se Availability to Plants.” Pedosphere 6: 209–216.
- Huang, Q., Y. Yu, Q. Wang, Z. Luo, R. Jiang, and H. Li. 2015. “Uptake Kinetics and Translocation of Selenite and Selenate as Affected by Iron Plaque on Root Surfaces of Rice Seedlings.” Planta 241 (4): 907–916. doi:10.1007/s00425-014-2227-7.
- Johnson, C. C., X. Ge, K. A. Green, and X. Liu. 2000. “Selenium Distribution in the Local Environment of Selected Villages of the Keshan Disease Belt, Zhangjiakou District, Hebei Province, People’s Republic of China.” Applied Geochemistry 15 (3): 385–401. doi:10.1016/S0883-2927(99)00051-7.
- Johnsson, L. 1991. “Selenium Uptake by Plants as a Function of Soil Type, Organic Matter Content and pH.” Plant and Soil 133 (1): 57–64. doi:10.1007/BF00011899.
- Li, H. F., S. P. McGrath, and F. J. Zhao. 2008. “Selenium Uptake, Translocation and Speciation in Wheat Supplied with Selenate or Selenite.” New Phytologist 178 (1): 92–102. doi:10.1111/j.1469-8137.2007.02343.x.
- Li, Z., D. Liang, Q. Peng, Z. Cui, J. Huang, and Z. Lin. 2017. “Interaction between Selenium and Soil Organic Matter and Its Impact on Soil Selenium Bioavailability: A Review.” Geoderma 295: 69–79. doi:10.1016/j.geoderma.2017.02.019.
- Liu, Y. X., J. P. Chen, L. P. Pan, T. S. Wu, B. Yang, Y. Xing, Q. Liao, et al. 2018. “Studies on Causes and Influential Factors of Selenium-rich Soil in Xunyu Plain.” Soils 50:1139–1144.
- Martens, D. A., and D. L. Suarez. 1997. “Selenium Speciation of Marine Shales, Alluvial Soils, and Evaporation Basin Soils of California.” Journal of Environmental Quality 26 (2): 424–432. doi:10.2134/jeq1997.00472425002600020013x.
- Moore, K. L., M. Schröder, E. Lombi, F.-J. Zhao, S. P. McGrath, M. J. Hawkesford, P. R. Shewry, et al. 2010. “NanoSIMS Analysis of Arsenic and Selenium in Cereal Grain.” New Phytologist 185 (2): 434–445. DOI:10.1111/j.1469-8137.2009.03071.x.
- Navarro-Alarcon, M., and C. Cabrera-Vique. 2008. “Selenium in Food and the Human Body: A Review.” Science of the Total Environment 400 (1–3): 115–141. doi:10.1016/j.scitotenv.2008.06.024.
- Nazemi, L., S. Nazmara, M. R. Eshraghyan, S. Nasseri, K. Djafarian, M. Yunesian, H. Sereshti, et al. 2012. “Selenium Status in Soil, Water and Essential Crops of Iran.” Iranian Journal of Environmental Health Science & Engineering 9 (1): 11. DOI:10.1186/1735-2746-9-11.
- Patorczyk-Pytlik, B., and G. Kulczycki. 2009. “Content of Selenium in Arable Soils near Wroclaw.” Journal of Elementology 14: 755–762.
- Patrick, J. W., and C. E. Offler. 2001. “Compartmentation of Transport and Transfer Events in Developing Seeds.” Journal of Experimental Botany 52 (356): 551–564. doi:10.1093/jexbot/52.356.551.
- Qin, H.-B., J.-M. Zhu, and H. Su. 2012. “Selenium Fractions in Organic Matter from Se-rich Soils and Weathered Stone Coal in Selenosis Areas of China.” Chemosphere 86 (6): 626–633. doi:10.1016/j.chemosphere.2011.10.055.
- Qin, H.-B., J.-M. Zhu, L. Liang, M.-S. Wang, and H. Su. 2013. “The Bioavailability of Selenium and Risk Assessment for Human Selenium Poisoning in high-Se Areas, China.” Environment International 52: 66–74. doi:10.1016/j.envint.2012.12.003.
- Rayman, M. P. 2008. “Food-chain Selenium and Human Health: Emphasis on Intake.” British Journal of Nutrition 100 (2): 254–268. doi:10.1017/S0007114508939830.
- Reynolds, R. J. B., and E. A. H. Pilon-Smits. 2018. “Plant Selenium hyperaccumulation-Ecological Effects and Potential Implications for Selenium Cycling and Community Structure.” Biochimica Et Biophysica Acta (BBA) - General Subjects 1862 (11): 2372–2382. doi:10.1016/j.bbagen.2018.04.018.
- Schrauzer, G. N., and P. F. Surai. 2009. “Selenium in Human and Animal Nutrition: Resolved and Unresolved Issues. A Partly Historical Treatise in Commemoration of the Fiftieth Anniversary of the Discovery of the Biological Essentiality of Selenium, Dedicated to the Memory of Klaus Schwarz (1914–1978) on the Occasion of the Thirtieth Anniversary of His Death.” Critical Reviews in Biotechnology 29: 2–9.
- Shao, S., and B. Zheng. 2008. “The Biogeochemistry of Selenium in Sunan Grassland, Gansu, Northwest China, Casts Doubt on the Belief that Marco Polo Reported Selenosis for the First Time in History.” Environmental Geochemistry and Health 30 (4): 307–314. doi:10.1007/s10653-008-9166-9.
- Sharma, V. K., T. J. McDonald, M. Sohn, G. A. K. Anquandah, M. Pettine, and R. Zboril. 2015. “Biogeochemistry of Selenium. A Review.” Environmental Chemistry Letters 13 (1): 49–58. doi:10.1007/s10311-014-0487-x.
- Sun, G. X., X. Liu, P. N. Williams, and Y. G. Zhu. 2010. “Distribution and Translocation of Selenium from Soil to Grain and Its Speciation in Paddy Rice (Oryza Sativa L.).” Environmental Science & Technology 44 (17): 6706–6711. doi:10.1021/es101843x.
- Tan, J., W. Zhu, W. Wang, R. Li, S. Hou, D. Wang, L. Yang, et al. 2002. “Selenium in Soil and Endemic Diseases in China.” Science of the Total Environment 284 (1–3): 227–235. DOI:10.1016/S0048-9697(01)00889-0.
- Tang, G. 2019. Guangxi Builds “China’s Selenium-rich Agricultural Capital.” China: Portal of the People’s Government of Guangxi Zhuang Autonomous Region.
- Tolu, J., P. Di Tullo, I. Le Hécho, Y. Thiry, F. Pannier, M. Potin-Gautier, M. Bueno, et al. 2014. “A New Methodology Involving Stable Isotope Tracer to Compare Simultaneously Short- and Long-term Selenium Mobility in Soils.” Analytical and Bioanalytical Chemistry 406 (4): 1221–1231. DOI:10.1007/s00216-013-7323-1.
- Wang, D., F. Zhou, W. Yang, Q. Peng, N. Man, and D. Liang. 2017. “Selenate Redistribution during Aging in Different Chinese Soils and the Dominant Influential Factors.” Chemosphere 182: 284–292. doi:10.1016/j.chemosphere.2017.05.014.
- Wang, D., M.-Y. Xue, Y.-K. Wang, D.-Z. Zhou, L. Tang, S.-Y. Cao, Y.-H. Wei, et al. 2019. “Effects of Straw Amendment on Selenium Aging in Soils: Mechanism and Influential Factors”. Science of the Total Environment 657: 871–881. 10.1016/j.scitotenv.2018.12.021.
- Wang, D., Q. T. Dinh, T. T. A. Thu, F. Zhou, W. Yang, M. Wang, W. Song, et al. 2018. “Effect of Selenium-enriched Organic Material Amendment on Selenium Fraction Transformation and Bioavailability in Soil”. Chemosphere 199: 417–426. 10.1016/j.chemosphere.2018.02.007.
- Wang, Q., J. Zhang, B. Zhao, X. Xin, X. Deng, and H. Zhang. 2016. “Influence of Long-term Fertilization on Selenium Accumulation in Soil and Uptake by Crops.” Pedosphere 26 (1): 120–129. doi:10.1016/S1002-0160(15)60028-5.
- Wang, S., D. Liang, D. Wang, W. Wei, D. Fu, and Z. Lin. 2012. “Selenium Fractionation and Speciation in Agriculture Soils and Accumulation in Corn (Zea Mays L.) Under Field Conditions in Shaanxi Province, China.” Science of the Total Environment 427-428: 159–164. doi:10.1016/j.scitotenv.2012.03.091.
- Wang, Z., and Y. Gao. 2001. “Biogeochemical Cycling of Selenium in Chinese Environments.” Applied Geochemistry 16 (11–12): 1345–1351. doi:10.1016/S0883-2927(01)00046-4.
- Williams, P. N., M. Lei, G. Sun, Q. Huang, Y. Lu, C. Deacon, A. A. Meharg, et al. 2009. “Occurrence and Partitioning of Cadmium, Arsenic and Lead in Mine Impacted Paddy Rice: Hunan, China.” Environmental Science & Technology 43 (3): 637–642. DOI:10.1021/es802412r.
- Wolswinkel, P. 1992. “Transport of Nutrients into Developing Seeds: A Review of Physiological Mechanisms.” Seed Science Research 2 (2): 59–73. doi:10.1017/S096025850000115X.
- Yamada, H., A. Kamada, M. Usuki, and J. Yanai. 2009. “Total Selenium Content of Agricultural Soils in Japan.” Soil Science and Plant Nutrition 55 (5): 616–622. doi:10.1111/j.1747-0765.2009.00397.x.
- Yanai, J., S. Mizuhara, and H. Yamada. 2015. “Soluble Selenium Content of Agricultural Soils in Japan and Its Determining Factors with Reference to Soil Type, Land Use and Region.” Soil Science and Plant Nutrition 61 (2): 312–318. doi:10.1080/00380768.2014.997147.
- Zhang, H., X. Feng, C. Jiang, Q. Li, Y. Liu, C. Gu, L. Shang, et al. 2014b. “Understanding the Paradox of Selenium Contamination in Mercury Mining Areas: High Soil Content and Low Accumulation in Rice”. Environmental Pollution 188: 27–36. 10.1016/j.envpol.2014.01.012.
- Zhang, H., X. Feng, H. M. Chan, and T. Larssen. 2014a. “New Insights into Traditional Health Risk Assessments of Mercury Exposure: Implications of Selenium.” Environmental Science & Technology 48 (2): 1206–1212. doi:10.1021/es4051082.
- Zhang, H., Z. Wu, C. Yang, B. Xia, D. Xu, and H. Yuan. 2008. “Spatial Distributions and Potential Risk Analysis of Total Soil Selenium in Guangdong Province, China.” Journal of Environmental Quality 37 (3): 780–787. doi:10.2134/jeq2007.0154.
- Zhang, M., S. Tang, X. Huang, F. Zhang, Y. Pang, Q. Huang, Q. Yi, et al. 2014c. “Selenium Uptake, Dynamic Changes in Selenium Content and Its Influence on Photosynthesis and Chlorophyll Fluorescence in Rice (Oryza Sativa L.)”. Environmental and Experimental Botany 107: 39–45. 10.1016/j.envexpbot.2014.05.005.
- Zhang, W.-H., Y. Zhou, K. E. Dibley, S. D. Tyerman, R. T. Furbank, and J. W. Patrick. 2007. “Review: Nutrient Loading of Developing Seeds.” Functional Plant Biology 34 (4): 314–331. doi:10.1071/FP06271.
- Zhu, J., and B. Zheng. 1999. “Distribution and Affecting Factors of Selenium in Soil in the high-Se Environment of Yutangba Mini-landscape.” Chinese Science Bulletin 44: 46–48.
- Zhu, J., N. Wang, S. Li, L. Li, H. Su, and C. Liu. 2008. “Distribution and Transport of Selenium in Yutangba, China: Impact of Human Activities.” Science of the Total Environment 392 (2–3): 252–261. doi:10.1016/j.scitotenv.2007.12.019.
- Zhu, Y.-G., E. A. H. Pilon-Smits, F.-J. Zhao, P. N. Williams, and A. A. Meharg. 2009. “Selenium in Higher Plants: Understanding Mechanisms for Biofortification and Phytoremediation.” Trends in Plant Science 14 (8): 436–442. doi:10.1016/j.tplants.2009.06.006.