
ABSTRACT
To examine the hypothesis that the soil microbial community in a nitrogen (N) limited forest responds to moderately elevated N deposition (< 10 kg ha−1 yr−1), correlations between N deposition and soil microbial properties were analyzed in a cool temperate forest surrounded by normally fertilized pasture grasslands in northern Japan. Three experimental plots were established in forest edges adjacent to the grasslands, and the other three plots were in forest interiors at least 700 m away from the grasslands. N deposition in each plot was measured from May to November 2018. In August 2018, we collected litter and surface soil samples from all plots to measure net N mineralization and nitrification rates as indicators of microbial activity, and microbial biomass and various gene abundances (i.e., bacterial 16S rRNA gene, fungal ITS region, and bacterial and archaeal amoA genes) as indicators of microbial abundance. N deposition in forest edges was 1.4-fold greater than that in forest interiors, whereas maximum N deposition was 3.7 kg ha−1. N deposition was significantly correlated with net N mineralization and nitrification rates and 16S rRNA and bacterial amoA gene abundances. Microbial community structures analyzed for bacterial 16S rRNA gene and fungal ITS region amplicons were different between litter and soil samples but were similar between the forest edge and interior, although this analysis was made only for single pair of the two plots in the forest edge and interior. N deposition was also correlated with the soil C/N ratio and nitrate and ammonium contents. Thus, it was suggested that some soil microbial activities and abundances in an N limited forest likely responded to moderately elevated N deposition. These findings provide primary information on soil microbial response to moderately elevated N deposition.
1. Introduction
Nitrogen (N) deposition (deposition of nitrate (NO3−) and ammonium (NH4+) ions) increased by anthropogenic usage of excess N fertilizers and fossil fuels (Galloway et al. Citation2004) is still a major environmental concern on a global scale (Decina, Hutyra, and Templer Citation2019; Dentener, Drevet, and Lamarque et al. Citation2006; Kanakidou et al. Citation2016; Reay et al. Citation2008) while reducing trends in N deposition are also observed in some areas of Europe and North America as a result of efforts to mitigate anthropogenic nitrogen oxide emissions (Gilliam et al. Citation2019; Schwede et al. Citation2018; Waldner et al. Citation2014). Increased N deposition variously affects forest ecosystems by altering biodiversity, productivity, biogeochemical cycles, energy dynamics, and so on (Chiwa et al. Citation2018; Groffman et al. Citation2018; Janssens et al. Citation2010; Jia et al. Citation2020; Reay et al. Citation2008; Zhang, Chen, and Ruan Citation2018). These effects of N deposition on forest ecosystems have been investigated mostly by N manipulation experiments with more than 20 kg ha−1 yr−1 of N addition (Janssens et al. Citation2010; Jia et al. Citation2020; Zhang, Chen, and Ruan Citation2018). A substantial extent of forest ecosystems over the world is, however, still receiving less than 10 kg ha−1 yr−1 of N deposition due to limited and heterogeneous distributions of urbanized areas that are receiving extensively elevated N deposition (> 20 kg ha−1 yr−1) (Reay et al. Citation2008; Schwede et al. Citation2018). Moreover, N limitations in these forests are expected to occur continuously and broadly because of increased N demand of forest vegetations under increasing atmospheric CO2 concentrations (Groffman et al. Citation2018; McLauchlan et al. Citation2017). Therefore, to capture reliable responses of forest ecosystems against changing N status, we need to know more about the effects of moderately elevated N deposition (< 10 kg ha−1 yr−1) on N limited forest ecosystems.
Soil microbial community is an ecosystem component sensitive to changes in N deposition (Janssens et al. Citation2010; Niu et al. Citation2016; Tian et al. Citation2017; Zhang, Chen, and Ruan Citation2018; Waldrop, Zak, and Sinsabaugh Citation2004). In soils amended with extensively elevated N deposition, CO2 release resulting from microbial decomposition of soil organic matter has generally been reduced (Janssens et al. Citation2010; Jia et al. Citation2020; Zhang, Chen, and Ruan Citation2018). Microbial transformations of inorganic N compounds, such as nitrification and denitrification, are generally enhanced by N addition (Niu et al. Citation2016), increasing the risks of N leaching into the surrounding water body and emission of nitrous oxide (a greenhouse gas 300-fold more effective than CO2 (IPCC Citation2013)) to the atmosphere (Butterbach-Bahl, Willibald, and Papem Citation2002; Niu et al. Citation2016). In contrast to the microbial responses to extensively elevated N deposition, Allison et al. (Citation2009) found that fungal species isolated from boreal forest soils responded parabolically to N addition from 0 to 200 μg. These amounts of added N were equivalent to only 0.1% or less of amounts of organic N substrates in the soils (Allison et al. Citation2009). Thus, soil microbial community responses to moderately elevated N deposition may differ from the responses against extensively elevated N deposition. However, varied microbial responses depending on the N deposition levels have been less focused in recent meta-analyses examining the effects of N deposition on soil microbial community (Janssens et al. Citation2010; Jia et al. Citation2020; Zhang, Chen, and Ruan Citation2018).
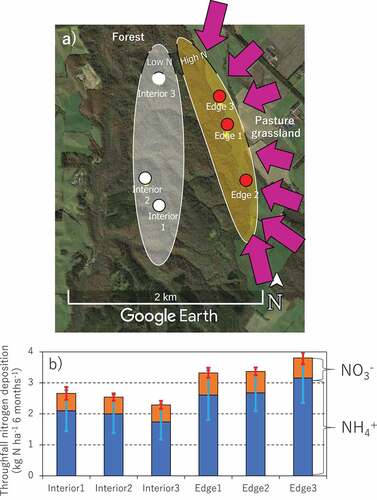
In the present study, we focused on the relationship between spatially varied N deposition and soil microbial properties within a cool temperate forest in the eastern area of Hokkaido, Japan. Eastern Hokkaido, including the investigated forest, receives relatively low N deposition from the atmosphere (2–5 kg ha−1 yr−1 as a typical value) (Chiwa et al. Citation2015; Network Center for EANET Citation2021), while N deposition in the boundary area of the forest (i.e., forest edge) is possibly more than that in the interior area of the forest (forest interior) owing to advection of N fertilizer, which farmers supplied to surrounding pasture grasslands () (Reinmann and Hutyra Citation2017; Remy et al. Citation2016, Citation2017, Citation2018a, Citation2018b). The grasslands surrounding our forest have received normal agricultural management practices, but not extensive fertilization, since after the land reclamation from forest to grassland in the 1950s. Therefore, investigating the relationship between N deposition and soil microbial properties in the two contrasting areas (i.e., forest interior and edge) of this forest would provide primary information on soil microbial responses to moderately elevated N deposition. In particular, this study was conducted to examine the hypothesis that soil microbial community in an N limited forest responds to moderately elevated N deposition. If the hypothesis is true, soil microbial activities and abundances in an N limited forest will change along the spatially varied amount of N deposition.
Figure 1. Locations of six experimental plots in a Japanese cool temperate forest (a), and N deposition via throughfall for 6 months (May 9th to November 20th, 2018) in each experimental plot (b). Purple arrows in the top panel represent major wind flows which transport fertilizer from pasture grasslands to our forest. Error bars in bottom panel represent standard deviations (n = 7). The credit of original map data from Google Earth is attributed to Google (CA, USA)
2. Materials and methods
2.1. Site description
This study was conducted in a natural, deciduous, broad-leaved forest in the Shibecha branch of the Hokkaido Forest Research Station, Field Science Education and Research Center, Kyoto University (N43° 24.2ʹ, E144° 38.5ʹ, 115 m above sea level) in eastern Hokkaido, northern Japan. The station is registered as an associate site of JaLTER (Shibecha/Shiranuka forest, http://www.jalter.org/en/researchsites/) and is used in a diverse range of ecological research (Christopher et al. Citation2008; Hosokawa et al. Citation2017; Isobe et al. Citation2018; Nakayama et al. Citation2019; Nakayama and Tateno Citation2018; Tateno et al. Citation2019; Urakawa et al. Citation2014, Citation2016). Briefly, mean annual air temperature and precipitation for 1981–2010 were 6.2°C and 1169.7 mm, respectively. The growing season is usually from June to October. Season with a persistent snowpack is generally from December to April. The annual maximum snow depth was 64 cm, as an average for 1981–2010. More detailed features of this forest are given in Christopher et al. (Citation2008).
Pasture grassland surrounding the forest is fertilized with ammonium-rich materials derived from livestock manure and slurry. The fertilization was usually conducted in May. Several farmers also conducted the fertilization in September. The major direction of wind flow in both months was from north to south clockwise (). The normal amount of fertilization for pasture grassland in this region was 6 and 4.5 × 10³ kg ha−1 yr−1 as livestock manure and slurry, respectively (Hokkaido Government, http://www.kushiro.pref.hokkaido.lg.jp/ss/nkc/gijyutu/H29/JA04hon.htm, access on May 2021). These amounts of normal fertilization were equivalent to 60 and 90 kg N ha−1 yr−1 for livestock manure and slurry, respectively.
2.2. Establishment of experimental plots
In May 2018, we established six experimental plots in the forest ()), expecting those plots to have different levels of N deposition. Three of those plots were located at the forest edge (i.e., Edge 1 to 3), a boundary between the forest and adjacent pasture grasslands, while the other three were located in the forest interior (i.e., Interior 1 to 3) at least 700 m away from the grasslands ()). All experimental plots were 10 m × 40 m in size. Soils in this forested area have been classified as Andosols, using the classification of the Food and Agriculture Organization (IUSS Working Group WRB Citation2015). Dominant vegetations of the plots were natural, deciduous broadleaved trees (mainly Quercus crispula know as Japanese oak) with dense understory vegetations of Sasa nipponica. There was no remarkable difference in vegetation status (i.e., species composition, standing tree density, and canopy structure) between the forest edge and interior. Briefly, the mean diameter at breast height of standing trees was 17.3 cm throughout the plots. The mean stand density was 829 trees ha−1. The maximum height of Sasa vegetation during the growing season was 80–100 cm.
2.3. N deposition observation
The amounts of N deposition in the six experimental plots were measured from May 9th to November 20th, 2018, by continuously collecting throughfall water from the atmosphere to the ground through the canopy vegetation. Seven shaded plastic buckets equipped with collecting tubes and funnels (21 cm in diameter) were randomly put on each experimental plot. Throughfall water was collected by the buckets at an almost bi-weekly interval and then filtered using a 0.45 μm pore-sized membrane filter (ADVANTEC 25CS045AN, Toyo Roshi Kaisya LTD., Tokyo, Japan). Then, concentrations of NO3− and NH4+ were measured using ion chromatography (Dionex-Integrion, Thermo Fisher Scientific, MA, USA). The amount of N deposition for the individual collection interval was quantified by multiplying the ion concentration in the collected water sample to the amount of throughfall. Then, the total amount of N deposition during the six-month observation period was quantified by summing up the N deposition for all collection intervals.
2.4. Litter and soil sampling
Litter and surface mineral soil (0–5 cm depth) samples were collected on August 10th, 2018. Three sets of litter and soil samples were collected from each of the experimental plots to obtain the representative mean and the interspatial variation of soil microbial properties within a plot. Here, we determined the litter and soil sampling locations, avoiding areas directly below trees to reduce the possibility of specific effects from roots and rhizospheres on collected samples. Litter samples were collected by gloved hands from an area of 30 cm × 30 cm, which were randomly selected within the plot. Soil samples were collected using a shovel. Collected litter and soil samples were cooled and transferred to the laboratory within a day. Soil samples were gently passed through a 4-mm sieve to remove gravel and plant tissues. Litter samples were pieced into a smaller size (ca. less than 2 mm × 2 mm) to obtain a homogenized sample. The prepared litter and soil samples were immediately applied to soil microbial analysis. Portions of these samples were air-dried and analyzed for total carbon (C) and N contents (Koarashi et al. Citation2018) and pH (H2O), as presented in . Contents of NH4+ and NO3− in fresh litter and soil samples () were measured by the colorimetric method coupling with the 2 M KCl extraction of NH4+ and NO3− (Urakawa et al. Citation2014, Citation2016). All data of soil properties in this study are presented with the unit per area after the conversion with measured bulk density in Table S1.
Table 1. Chemical properties of litter and soil (0–5 cm) samples a) and significance of their correlations to N deposition b).
2.5. Analysis of soil microbial property
2.5.1. Activity and abundance
Litter and soil samples were also applied to measurements of net N mineralization and nitrification rates, microbial biomass C and N, and various gene abundances, such as bacterial 16S rRNA gene, fungal ITS region, and bacterial and archaeal amoA genes. Mineralization and nitrification rates were measured as indicators of microbial activity, and microbial biomass and gene abundance were indicators of microbial abundance. The net N mineralization and nitrification rates were determined, respectively, as the changes in the concentrations of total inorganic N (NO3− + NH4+) and NO3− alone between initial and after aerobic incubation of soils at 25°C for 4 weeks (Urakawa et al. Citation2014, Citation2016). In the investigated forest, these net mineralization and nitrification rates can indicate gross mineralization and nitrification rates, respectively (Urakawa et al. Citation2016). Moreover, the well-known correlation between N mineralization rate and microbial CO2 production rate (Haney, Brinton, and Evans Citation2008; Rustad et al. Citation2001; Zak et al. Citation1999) enables us to infer behaviors of organic matter decomposition and consequent CO2 release. Microbial biomass C and N were measured using the chloroform fumigation extraction method (Vance, Brookes, and Jenkinson Citation1987). Total DNA was extracted from 0.1–0.5 g of fresh litter and soil samples using a DNeasy Power Soil Kit (Qiagen, Hilden, Germany). Abundances of microbial genes were then quantified with an Illumina’s Eco Real-Time PCR System (Illumina, CA, USA) and commercial reagent kits or primer sets targeting specific gene regions. Femto bacterial and fungal DNA quantification kits (Zymo Research, CA, USA) were used for bacterial 16S rRNA gene and fungal ITS region. The primer sets for bacterial 16S rRNA gene and fungal ITS region were 8 F/357 R (Turner et al. Citation1999) and ITS1-F/ITS-2-R (White et al. Citation1990), respectively. For bacterial and archaeal amoA genes, the primer sets of amoA1f/amoA2r (Rotthauwe, Witzel, and Liesack Citation1997) and CrenamoA23f/Cremamo616r (Tourna et al. Citation2008) were used, respectively, with FastStart Essential DNA Green Master (Roche, Basel, Switzerland) as a PCR reaction mixture. The PCR conditions are shown in Table S2.
2.5.2. Community structure
Microbial community structures in litter and soil samples were also analyzed for bacterial 16S rRNA gene and fungal ITS region amplicons using a high-throughput DNA sequencer (MiSeq, Illumina). Due to the limitation of funding ability, DNA samples extracted from Edge 2 and Interior 1 plots were used for this evaluation to briefly capture the difference in the microbial community structure between these two contrasting plots. Interior 1 was located farthest from the surrounding grasslands, while N deposition at Edge 2 was middle of the three edge plots (). The amplicon libraries of bacterial 16S rRNA gene and fungal ITS region were prepared using the 16S (V3–V4) Metagenomic Library Construction Kit for NGS (TaKaRa Bio) with the primer set of 341 f /806 R (Caporaso et al. Citation2011; Muzer, Waal, Uitterlinden, Citation1993) and the 2× Kapa HiFi HotStart ReadyMix (Roche, Swiss) with the primer set of ITS3-F/ITS4-R (Waud et al. Citation2014), respectively, in the coupling with the Nextera XT Index Kit (Illumina). A total of 0.16 million of 2 × 250 bp paired-end reads and a total of 1.26 million of 2 × 150 bp paired-end reads were obtained for bacterial 16S rRNA gene and fungal ITS region, respectively, from 12 total genomic DNA samples (2 depths × 2 sites × 3 replications). These sequences were then binned into operational taxonomic units (OTUs) of 1,592 for bacterial 16S rRNA gene and 2,626 for fungal ITS region using CD-HIT-OTU (Li et al. Citation2012), which were configured with a clustering threshold value of 0.97 and a per-base PCR error value of 0.01. Taxonomies of the OTUs were determined with Quantitative Insights Into Microbial Ecology (QIIME, an open-source software pipeline for analysis of microbial community sequence data) (Caporaso et al. Citation2010). In the QIIME analysis, OTU sequences for 16S rRNA gene were classified using the RDP classifier (Wang et al. Citation2007) at 80% confidence threshold with the GreenGenes database (gg_13_18 ver.; DeSantis et al. Citation2006). The OTU sequences for fungal ITS region were classified using the UCLUST program at 90% confidence threshold with the UNITE database (7.2 2017–12-01 ver.; Abarenkov et al. Citation2010). Finally, 164,714 reads in 1,591 OTUs of bacterial 16S rRNA gene (10,870–16,620 reads/sample) and 1,188,300 reads in 1,946 OTUs of fungal ITS region (66,942–115,420 reads/sample) were applied to the analysis comparing the microbial community structures among samples, after excluding non-bacterial and non-fungal OTU reads that were 3 reads in 1 OTU for bacterial 16S rRNA gene and 79,093 reads in 680 OTUs for fungal ITS region.
2.6. Statistical analysis
Statistical analysis in the present study was performed using R software ver. 3.6 (R Core Team Citation2017). The probability level suggesting statistical significance was defined as less than 0.05 in the present study (i.e., p < 0.05). The two-way ANCOVA using glm function in base package (R Core Team Citation2017) was applied to examine the significant correlation between N deposition and soil microbial properties and also to examine the significant interactive effect of different soil layers (i.e., litter vs. 0–5 cm soil) on these correlations. The ANCOVA was applied to a total of 36 data points (6 plots × 2 soil layers × 3 replications). The correlation between N deposition and possibly confounding environmental factors, i.e., mean soil water content and temperature for the observation period, was also examined. Soil water content and temperature can vary between forest interior and edge locations due to differences in ecological and meteorological features between forest interiors and edges (Reinmann and Hutyra Citation2017; Remy et al. Citation2016, Citation2017, 2018a, 2018b). The correlations between N deposition and soil chemical properties, i.e., C and N contents, pH (H2O), and NO3− and NH4+ contents, were also examined to capture their possible changes associated with moderately elevated N deposition and microbial properties. The correlation between N deposition and soil chemical property was examined individually for litter and surface soil layers using simple linear regression with glm function in R.
The bacterial and fungal community structures were compared among different soil layers and sites with the permutational multivariate analysis of variance (perMANOVA, 9999 random permutations) by adonis function in vegan package (Oksanen, Guillaume Blanchet, and Friendly et al. Citation2018). Here, the number of sequences per sample was rarefied to 10,870 for bacterial 16S rRNA gene and 66,942 for fungal ITS region by random sampling of rrarefy function in vegan package (Okansen et al., Citation2018).
3. Results
3.1. Summary of N deposition
Cumulative N deposition via throughfall for the 6 months (from May to November) ranged from 2.2 to 3.7 kg ha−1 in the six experimental plots (). The maximum and minimum amounts of N deposition were observed in the most northern plot of the forest edge (Edge 3) and the most northern plot of the forest interior (Interior 3), respectively. In summary, the mean N deposition for three plots of the forest edge was 3.5 ± 0.9 kg ha−1, which was 1.4-fold higher than that of the forest interior (2.5 ± 0.7 kg ha−1). This difference in N deposition between the forest interiors and edges was considered statistically significant by the t-test. A large proportion (> 76%) of the N deposition was in the form of NH4+.
3.2. Soil microbial properties vs. N deposition
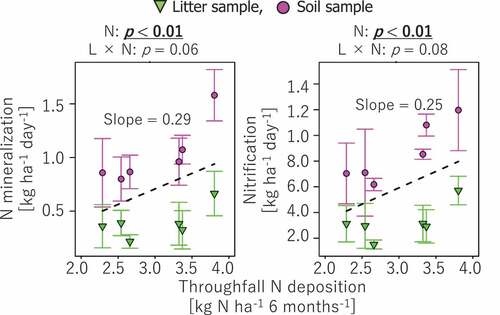
Net N mineralization and nitrification rates showed significantly positive correlations to N deposition (). The interactive effect between soil layer and N deposition was not significant (p > 0.05).
Figure 2. Correlations of net N mineralization and nitrification rates to N deposition. The probability level (p value) for statistical significance examined by two-way ANCOVA was presented above panels. Regression lines (dashed line) and slope values are presented for correlations with p < 0.05
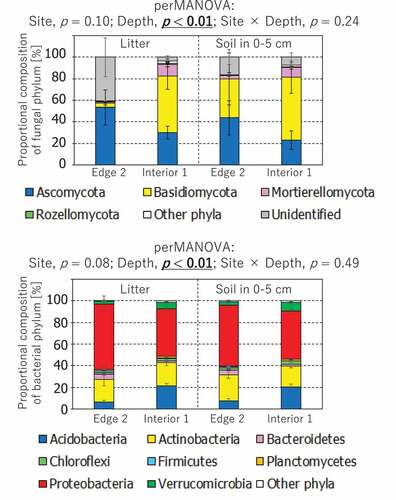
Abundances of 16S rRNA gene showed significantly positive correlations to N deposition (), however the interactive effect between soil layer and N deposition was not significant (p > 0.05). The positive correlation between bacterial amoA gene abundance and N deposition was also statistically significant, showing a significant interactive effect from the soil layer and N deposition combinations. The slope value for the relationship between N deposition and bacterial amoA gene abundance in the surface mineral soils was 3.5-fold greater than that in the litter layer. There was no significant correlation between other microbial properties and N deposition (p > 0.05). There was no significant difference in microbial community structure between Edge 2 and Interior 1, while microbial community structure was significantly different between the litter and soil layers ().
Figure 3. Correlations of microbial biomass C and N and various gene contents, such as bacterial 16S rRNA gene, fungal ITS region, and bacterial and archaeal amoA genes, to N deposition. Statistical analysis of correlation was conducted in the same manner as (see text for details). Regression lines (dashed line) and slope values are presented for correlations with p < 0.05
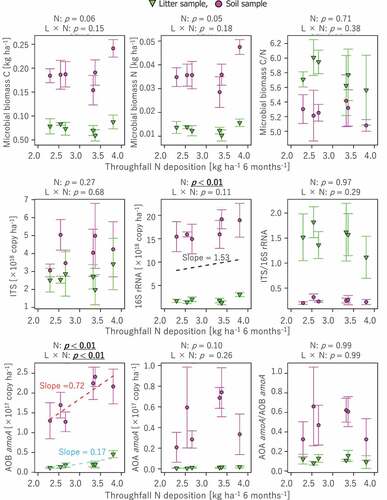
Figure 4. Comparison of fungal and bacterial community structures between Edge 2 and Interior 1 plots and between litter and soil layers. The probability level (p value) for statistical significance examined by perMANOVA was presented above panels. The phyla which individually had less than 1% of proportional composition was binned into other phyla
3.3. Environmental factors vs. N deposition
There was no apparent correlation between N deposition and environmental factors (i.e., temperature and soil water content) (). The differences in mean values of these environmental factors between the forest edge and interior were only 0.2°C in temperature and 1% in soil water content, without any significant differences by t-test (p > 0.05).
Figure 5. Correlations of soil water content and temperature to N deposition. The presented soil water content and temperature are seasonal means for the observation period from May to November 2018. No significant correlation was observed between N deposition and the environmental factors without any significant difference by t-test (p > 0.05)
3.4. Soil chemical properties vs. N deposition
In contrast to environmental factors, some soil chemical properties were found to be significantly correlated with N deposition (). C/N ratios of litter and soil samples were negatively correlated with N deposition. In soil samples, NO3− content showed a positive correlation to N deposition, while NH4+ content showed a negative correlation to N deposition.
4. Discussion
4.1. Soil microbial activity vs. N deposition
N disposition was significantly greater in the forest edge than in the forest interior (). Given that NH4+ consisted of more than 76% of the deposited N and the fertilization in surrounding pasture grasslands were conducted with ammonium-rich materials derived from cattle manure and slurry, N fertilizer likely had significant contributions to the forest N deposition through the ammonia volatilization (Hayashi and Yan Citation2010). However, these amounts of N deposition in this forest were less than half of the threshold N amount, which causes adverse effects on temperate and boreal forest ecosystems (i.e., 10–15 kg ha−1 yr−1) (Bobbink et al. Citation2010; Nordin et al. Citation2005). Thus, the bioavailability of N in the investigated soils was likely limited even in the edge plots.
Soil microbial activity at the forest edge was likely enhanced by moderately elevated N deposition because significant correlations were found between N deposition and net mineralization and nitrification rates (). This microbial response is different from observations of the reduction in soil microbial CO2 release in forests under extensively elevated N deposition (Janssens et al. Citation2010; Jia et al. Citation2020; Zhang, Chen, and Ruan Citation2018). The enhancements of microbial activity and presumably soil organic matter decomposition at our forest edges are partially supported by the observations of the negative correlations between N deposition and soil C/N ratio (). The relative abundance of C to N in soil organic matter generally decreases with the progress of microbial decomposition, where organic C is mineralized to and released as CO2, whereas N is retained and reutilized by the soil microbial community (Koarashi et al. Citation2014; Kramer, Lajtha, and Aufdenkampe Citation2017). Correlations between N deposition and individual content of soil inorganic N species () probably resulted from the enhanced NH4+ consumption and NO3− production through the nitrification under moderately elevated N deposition (). This postulation is supported by a consistent result that correlations between soil inorganic N availability and microbial property (such as net N mineralization and nitrification rate, and 16S rRNA and bacterial amoA gene contents) in surface mineral soils were sufficiently strong (Pearson’s r values were −0.46 to −0.86 for soil NH4+ pool and 0.68 to 0.90 for soil NO3− pool).
Such an enhancement of soil microbial activity under moderately elevated N deposition () can contribute to increased CO2 production through the decomposition of soil organic matter, thus increasing atmospheric CO2 concentration. Moreover, considering the previously known sensitive responses of microbial processes to N addition (Allison et al. Citation2009; Butterbach-Bahl, Willibald, and Papen Citation2002; Jassal et al. Citation2011; Niu et al. Citation2016; Smith et al. Citation2000), not only the extensive elevation but also the moderate elevation of N deposition may significantly alter the soil nutrition dynamics, particularly at forest boundary edge areas.
4.2. Soil microbial abundances vs. N deposition
There was a remarkable difference between bacterial (16S rRNA) and fungal (ITS) abundances in terms of their correlations to N deposition (). This difference between bacteria and fungi is considered to be the reflection of different N demands between these two different microbial groups (Strickland and Rousk Citation2010). In general, bacterial biomass is relatively enriched with N rather than fungal biomass does, suggesting a higher N demand for the bacterial body (Strickland and Rousk Citation2010). Therefore, the observed linkage between bacterial abundance and N deposition is reliable under the assumption of the high sensitivity of bacteria to N availability. These different responses to N deposition between bacteria and fungi were also inferred from a lower ratio of microbial biomass C to N and a lower ratio of fungal to bacterial gene abundance at forest edges than at forest interiors (), whereas differences in these ratios between the forest edges and interiors were not statistically significant (p > 0.05).
In forest soils with higher levels of N deposition (e.g., >20 kg ha−1 yr−1), both community structures of bacteria and fungi would respond to increased N deposition (Isobe et al. Citation2019; Kjoller et al. Citation2012). Isobe et al. (Citation2019) showed phylogenetically conserved responses of soil bacterial taxa to N addition, performing a meta-analysis of 13 field experiments for soil bacterial communities across 5 continents. Additionally, in a Norway spruce forest in Denmark, Kjoller et al. (Citation2012) found that fungal community structure and its function significantly responded against N deposition gradient from 27 to 43 kg ha−1 yr−1. Thus, relatively lower levels of N deposition in our forests ()) likely enabled us to detect microbial responses differing between bacteria and fungi (). Note that our results for the microbial DNA amplicon analysis using MiSeq () may still be insufficient to achieve a consistent insight into the soil microbial community under moderately elevated N deposition because there was only a result from single pair of two plots in forest interior and edge.
The bacterial amoA gene abundance appeared to respond to N deposition, but the archaeal amoA gene abundance was not (). In the investigated forest, Isobe et al. (Citation2018) also found gross nitrification rate synchronously changing with bacterial amoA gene abundances during winter. These microbial features at our forest site are somewhat different from a previous study finding that archaeal ammonia oxidizers play an important role in the soil nitrification process in temperate forests and agricultural upland soils in Europe (Leininger et al. Citation2006). One of the possible interpretations for this discrepancy between European and Japanese forest soils is that soil conditions of our forest are preferable for bacterial ammonia oxidizers, which have larger cell bodies and higher cell-specific-unit activity compared with archaeal ones (Jia and Conrad Citation2009). Then, the specific dependence of bacterial ammonia oxidizers on autotrophic growth and contrasting dependence of archaeal oxidizers on heterotrophic growth (Jia and Conrad Citation2009) might result in the dominant contribution of bacterial community to nitrification in our forest soils.
Moreover, this specific sensitivity of bacterial ammonia oxidizers might be associated with changes in the species composition of these bacteria (Isobe et al. Citation2020). While the overall compositions of bacterial and fungal communities in our forest soils were less sensitive to moderately elevated N deposition (), Isobe et al. (Citation2020) found significant changes in the species composition of bacterial ammonia oxidizers along with forest slope gradients. Accordingly, Isobe et al. (Citation2020) pointed out the importance of specific microbial community compositions in elucidating soil N dynamics under changing environmental conditions.
4.3. Environmental factors vs. N deposition
In our forest, there was little evidence indicating that environmental factors other than N deposition had caused the pseudo-correlation between N deposition and soil microbial properties. This was based on our findings that environmental factors such as soil water content and temperature were similar between the forest edge and interior (). Additionally, soil pH was less correlated with the amount of N deposition (), while Urakawa et al. (Citation2016) suggested that soil acidity would be a significant factor affecting N mineralization activity in Japanese Andosols. Thus, the moderately elevated N deposition in our forest might be insufficient to create a significant gradient of those environmental and soil physicochemical factors that can directly affect microbial properties. The situation indicating similar environmental and soil physicochemical factors between the forest interiors and edges was strictly different from the situations in previous studies in forests in Europe (Remy et al. Citation2016, Citation2017, 2018a, 2018b) and USA (Reinmann and Hutyra Citation2017), where not only N deposition but also other environmental and soil physicochemical factors have changed gradually from edge to interior.
5. Conclusions
In a Japanese cool-temperate forest surrounded by pasture grasslands, we found that soil microbial activities and their abundances increased along with spatial gradients of N deposition from forest interior to boundary edge area. Still, elevated levels of N deposition in the forest edges were moderate (<10 kg ha−1 yr−1) rather than extreme (>20 kg ha−1 yr−1). Our finding was different from most previous studies, which mainly focused on the effects of >20 kg ha−1 of annual N deposition and showed a reduction in soil organic matter decomposition and microbial CO2 release (Janssens et al. Citation2010; Jia et al. Citation2020; Zhang, Chen, and Ruan Citation2018). Because of the significant coverage of N limited forest ecosystems (Groffman et al. Citation2018; McLauchlan et al. Citation2017; Reay et al. Citation2008) and the significant increase in fragmented forest ecosystems over the world (Haddad et al. Citation2015; Smith et al. Citation2018), understanding the responses of soil microbial communities to moderately elevated N deposition is essential, to capture reliable changes in C and nutrient cycles under changing environments. Through this study, we provided primary information on soil microbial response to moderately elevated N deposition.
Authors’ contributions
HN, GK, KF, TY, MW, and JK conceived and designed the study. HN, MN, GK, KF, TY, MW, JK, RT carried out all of the field works. KF, GK, and TK analyzed the throughfall water samples. HN, JK, and MA analyzed soil physicochemical properties. MN and KF measure the net nitrification and N mineralization rate of the soil sample. HN, MN, and TK analyzed soil microbial abundance and community structure. HN conducted the statistical analysis of the data and wrote the first version of the manuscript. All authors advised on the content and revised the manuscript. All authors have read and approved the final manuscript.
Authors’ information
HN presently belongs to Graduate School of Science and Technology, Niigata University, Niigata 950-2181, Japan.
Acknowledgments
This work was supported by the Japan Society for the Promotion of Science (JSPS) KAKENHI (grant numbers 17H01868, 17K15286). The authors thank Dr. Kazuya Kobayashi and technical staffs Mr. Yasuyuki Shibata, Mr. Tomoyuki Nakagawa, Mr. Jun Yanagimoto, Mr. Ken-ichi Ohta, Mr. Yuhei Nishioka, Mr. Yasunori Kishimoto, Mr. Yuta Miyagi, and Mr. Shuichi Sato, in the Shibecha branch of the Hokkaido Forest Research Station, Field Science Education and Research Center, Kyoto University, and Dr. Yuki Kamidaira of the Japan Atomic Energy Agency (JAEA) for support with the fieldwork; Ms. Misuzu Kaminaga, Ms. Kikuko Yoshigaki, and Mr. Taro Ishii of JAEA for support with the laboratory work; Ms. Chikako Okabe of the Ibaraki University for support with the chemical analyses of throughfall samples; Dr. Akinari Yokoya and Ms. Eri Hirose of the National Institutes for Quantum and Radiological Science and Technology for usage of the Real-Time PCR System; and Dr. Hirochika Naganawa and Dr. Hiroyuki Okamura of JAEA for usage of the DNA analyzing instruments.
Availability of data and material
The Illumina datasets obtained in this study are available at NCBI (National Center for Biotechnology Information) Sequence Read Archive (SRA) under accession number PRJNA612411 (from SRX7906297 to SRX7906320 as the SRA experiment accession numbers). Other data that support the findings of this study are available from the corresponding author upon reasonable request. The codes that process the data of this study are also available from the corresponding author upon reasonable request.
Disclosure statement
The authors declare that they have no competing interest.
Additional information
Funding
References
- Abarenkov, K., R. H. Nilsson, K. H. Larsson, I. J. Alexander, U. Eberhardt, S. Erland, K. Høiland, et al. 2010. “The UNITE Database for Molecular Identification of Fungi - Recent Updates and Future Perspectives.” New Phytologist 186: 281–285. doi:10.1111/j.1469-8137.2009.03160.x.
- Allison, S. D., D. S. LeBauer, M. R. Ofrecio, R. Reyes, A. M. Ta, and T. M. Tran. 2009. “Low Levels of Nitrogen Addition Stimulate Decomposition by Boreal Forest Fungi.” Soil Biology and Biochemistry 41: 293–302. doi:10.1016/j.soilbio.2008.10.032.
- Bobbink, R., K. Hicks, J. Galloway, T. Spranger, R. Alkemade, M. Ashmore, M. Bustamante, et al. 2010. “Global Assessment of Nitrogen Deposition Effects on Terrestrial Plant Diversity: A Synthesis. (Special Issue: Perspectives on the Modern Nitrogen Cycle.).” . Ecological Applications 20: 30–59. doi:10.1890/08-1140.1.
- Butterbach-Bahl, K., G. Willibald, and H. Papen. 2002. “Soil Core Method for Direct Simultaneous Determination of N2 and N2O Emissions from Forest Soils.” Plant and Soil 240 (1): 105–116. doi:10.1023/A:1015870518723.
- Caporaso, J. G., C. L. Lauber, W. A. Walters, D. Berg-Lyons, C. A. Lozupone, P. J. Turnbaugh, N. Fierer, and R. Knight. 2011. “Global Patterns of 16S rRNA Diversity at a Depth of Millions of Sequences per Sample.” Proceedings of the National Academy of Sciences 108 (Supplement_1): 4516–4522. doi:10.1073/pnas.1000080107.
- Caporaso, J. G., J. Kuczynski, J. Stombaugh, K. Bittinger, F. D. Bushman, E. K. Costello, N. Fierer, et al. 2010. “QIIME Allows Analysis of High-throughput Community Sequencing Data.” Nature Methods 7: 335–336. doi:10.1038/nmeth.f.303.
- Chiwa, M., R. Tateno, T. Hishi, and H. Shibata. 2018. “Nitrate Leaching from Japanese Temperate Forest Ecosystems in Response to Elevated Atmospheric N Deposition.” The Journal of Forestry Research 1–15.
- Chiwa, M., S. Inoue, N. Tashiro, D. Ohgi, Y. Uehara, H. Shibata, and A. Kume. 2015. “Assessing the Role of Forests in Mitigating Eutrophication Downstream of Pasture during Spring Snowmelt.” Hydrological Processes 29 (4): 615–623. doi:10.1002/hyp.10189.
- Christopher, S. F., H. Shibata, M. Ozawa, Y. Nakagawa, and M. J. Mitchell. 2008. “The Effect of Soil Freezing on N Cycling: Comparison of Two Headwater Subcatchments with Different Vegetation and Snowpack Conditions in the Northern Hokkaido Island of Japan.” Biogeochemistry 88 (1): 15–30. doi:10.1007/s10533-008-9189-4.
- Decina, S. M., L. R. Hutyra, and P. H. Templer. 2019. “Hotspots of Nitrogen Deposition in the World’s Urban Areas: A Global Data Synthesis.” Frontiers in Ecology and the Environment 2143. fee
- Dentener, F., J. Drevet, J. F. Lamarque, I. Bey, B. Eickhout, A. M. Fiore, D. Hauglustaine, et al. 2006. “Nitrogen and Sulfur Deposition on Regional and Global Scales: A Multimodel Evaluation.” Global Biogeochemical Cycles 20 (4): GB4003. https://doi.org/10.1029/2005GB002672.
- DeSantis, T. Z., P. Hugenholtz, K. Keller, E. L. Brodie, N. Larsen, Y. M. Piceno, R. Phan, and G. L. Andersen. 2006. “NAST: A Multiple Sequence Alignment Server for Comparative Analysis of 16S rRNA Genes.” Nucleic Acids Research 34. doi:10.1093/nar/gkl244.
- Galloway, J. N., F. J. Dentener, D. G. Capone, E. W. Boyer, R. W. Howarth, S. P. Seitzinger, G. P. Asner et al. 2004. “Nitrogen Cycles: Past, Present, and Future.” Biogeochemistry 70 (2): 153–226. DOI:10.1007/s10533-004-0370-0.
- Gilliam, F. S., D. A. Burns, C. T. Driscoll, S. D. Frey, G. M. Lovett, and S. A. Watmough. 2019. “Decreased Atmospheric Nitrogen Deposition in Eastern North America: Predicted Responses of Forest Ecosystems.” Environmental Pollution 244: 560–574. doi:10.1016/j.envpol.2018.09.135.
- Groffman, P. M., C. T. Driscoll, J. Durán, J. L. Campbell, L. M. Christenson, T. J. Fahey, M. C. Fisk et al. 2018. “Nitrogen Oligotrophication in Northern Hardwood Forests.” Biogeochemistry 141 (3): 523–539. DOI:10.1007/s10533-018-0445-y.
- Haddad, N. M., L. A. Brudvig, J. Clobert, K. F. Davies, A. Gonzalez, R. D. Holt, T. E. Lovejoy, et al. 2015. “Habitat Fragmentation and Its Lasting Impact on Earth’s Ecosystems.” . Science Advances 1 (2): e1500052. .
- Haney, R. L., W. H. Brinton, and E. Evans. 2008. “Estimating Soil Carbon, Nitrogen, and Phosphorus Mineralization from Short-term Carbon Dioxide Respiration. Commun.” Communications in Soil Science and Plant Analysis 39: 2706–2720. doi:10.1080/00103620802358862.
- Hayashi, K., and X. Yan. 2010. “Airborne Nitrogen Load in Japanese and Chinese Agroecosystems.” Soil Science and Plant Nutrition 56 (1): 2–18. doi:10.1111/j.1747-0765.2009.00423.x.
- Hosokawa, N., K. Isobe, R. Urakawa, R. Tateno, K. Fukuzawa, T. Watanabe, and H. Shibata. 2017. “Soil Freeze–thaw with Root Litter Alters N Transformations during the Dormant Season in Soils under Two Temperate Forests in Northern Japan.” Soil Biology and Biochemistry 114: 270–278. doi:10.1016/j.soilbio.2017.07.025.
- IPCC (Intergovernmental Panel on Climate Change) 2013: Climate Change 2013: The Physical Science Basis. Contribution of Working Group I to the Fifth Assessment Report of the Intergovernmental Panel on Climate Change. Climate Change 2013: The Physical Science Basis. Contribution of Working Group I to the Fifth Assessment Report of the Intergovernmental Panel on Climate Change (TF Stocker, D Qin, G-K Plattner, et al., Eds.). Cambridge University Press: Cambridge, United Kingdom and New York, NY, USA. http://www.climatechange2013.org/images/report/WG1AR5_ALL_FINAL.pdf.
- Isobe, K., H. Oka, T. Watanabe, R. Tateno, R. Urakawa, C. Liang, K. Senoo, and H. Shibata. 2018. “High Soil Microbial Activity in the Winter Season Enhances Nitrogen Cycling in a Cool-temperate Deciduous Forest.” Soil Biology and Biochemistry 124: 90–100. doi:10.1016/j.soilbio.2018.05.028.
- Isobe, K., S. D. Allison, B. Khalili, A. C. Martiny, and J. B. H. Martiny. 2019. “Phylogenetic Conservation of Bacterial Responses to Soil Nitrogen Addition across Continents.” Nature Communications 10: 2499. doi:10.1038/s41467-019-10390-y.
- Isobe, K., Y. Ise, H. Kato, T. Oda, C. E. Vincenot, K. Koba, R. Tateno, K. Senoo, and N. Ohte. 2020. “Consequences of Microbial Diversity in Forest Nitrogen Cycling: Diverse Ammonifiers and Specialized Ammonia Oxidizers.” The ISME Journal 14 (1): 12–25. doi:10.1038/s41396-019-0500-2.
- IUSS Working Group WRB 2015: World Reference Base for Soil Resources 2014, Update 2015 International Soil Classification System for Naming Soils and Creating Legends for Soil Maps. World Reference Base for Soil Resources 2014, Update 2015 International Soil Classification System for Naming Soils and Creating Legends for Soil Maps. World Soil. FAO, Rome.
- Janssens, I. A., W. Dieleman, S. Luyssaert, J.-A. Subke, M. Reichstein, R. Ceulemans, P. Ciais, et al. 2010. “Reduction of Forest Soil Respiration in Response to Nitrogen Deposition.” Nature Geoscience 3 (5): 315–322. doi:10.1038/ngeo844.
- Jassal, R. S., T. A. Black, R. Roy, and G. Ethier. 2011. “Effect of Nitrogen Fertilization on Soil CH4 and N2O Fluxes, and Soil and Bole Respiration.” Geoderma 162 (1–2): 182–186. doi:10.1016/j.geoderma.2011.02.002.
- Jia, X., Y. Zhong, J. Liu, G. Zhu, Z. Shangguan, and W. Yan. 2020. “Effects of Nitrogen Enrichment on Soil Microbial Characteristics: From Biomass to Enzyme Activities.” Geoderma 366: 114256.
- Jia, Z., and R. Conrad. 2009. “Bacteria Rather than Archaea Dominate Microbial Ammonia Oxidation in an Agricultural Soil.” Environmental Microbiology 11 (7): 1658–1671. doi:10.1111/j.1462-2920.2009.01891.x.
- Kanakidou, M., S. Myriokefalitakis, N. Daskalakis, G. Fanourgakis, A. Nenes, A. R. Baker, K. Tsigaridis, and N. Mihalopoulos. 2016. “Past, Present, and Future Atmospheric Nitrogen Deposition.” Journal of the Atmospheric Sciences 73 (5): 2039–2047. doi:10.1175/JAS-D-15-0278.1.
- Kjøller, R., L. Nilsson, K. Hansen, I. K. Schmidt, L. Vesterdal, and P. Gundersen. 2012. “Dramatic Changes in Ectomycorrhizal Community Composition, Root Tip Abundance and Mycelial Production along a Stand-scale Nitrogen Deposition Gradient.” New Phytologist 194 (1): 278–286. doi:10.1111/j.1469-8137.2011.04041.x.
- Koarashi, J., M. Atarashi-Andoh, E. Takeuchi, and S. Nishimura. 2014. “Topographic Heterogeneity Effect on the Accumulation of Fukushima-derived Radiocesium on Forest Floor Driven by Biologically Mediated Processes.” Scientific Reports 4 (1): 6853. doi:10.1038/srep06853.
- Koarashi, J., S. Nishimura, M. Atarashi-Andoh, T. Matsunaga, T. Sato, and S. Nagao. 2018. “Radiocesium Distribution in Aggregate-size Fractions of Cropland and Forest Soils Affected by the Fukushima Nuclear Accident.” Chemosphere 205: 147–155. doi:10.1016/j.chemosphere.2018.04.092.
- Kramer, M. G., K. Lajtha, and A. K. Aufdenkampe. 2017. “Depth Trends of Soil Organic Matter C:N and 15N Natural Abundance Controlled by Association with Minerals.” Biogeochemistry 136: 237–248. .
- Leininger, S., T. Urich, M. Schloter, L. Schwark, J. Qi, G. W. Nicol, J. I. Prosser, S. C. Schuster, and C. Schleper. 2006. “Archaea Predominate among Ammonia-oxidizing Prokaryotes in Soils.” Nature 442: 806–809. doi:10.1038/nature04983.
- Li, W., L. Fu, B. Niu, S. Wu, and J. Wooley. 2012. “Ultrafast Clustering Algorithms for Metagenomic Sequence Analysis.” Briefings in Bioinformatics 13 (6): 656–668. doi:10.1093/bib/bbs035.
- McLauchlan, K. K., L. M. Gerhart, J. J. Battles, J. M. Craine, A. J. Elmore, P. E. Higuera, M. C. Mack, et al. 2017. “Centennial-scale Reductions in Nitrogen Availability in Temperate Forests of the United States.” Scientific Reports 7 (1): 1–7. doi:10.1038/s41598-017-08170-z.
- Muyzer, G., E. C. De Waal, and A. G. Uitterlinden. 1993. “Profiling of Complex Microbial Populations by Denaturing Gradient Gel Electrophoresis Analysis of Polymerase Chain Reaction-amplified Genes Coding for 16S rRNA.” Applied and Environmental Microbiology 59 (3): 695–700. doi:10.1128/aem.59.3.695-700.1993.
- Nakayama, M., and R. Tateno. 2018. “Solar Radiation Strongly Influences the Quantity of Forest Tree Root Exudates.” Trees - Structure and Function 32 (3): 871–879. doi:10.1007/s00468-018-1685-0.
- Nakayama, M., S. Imamura, T. Taniguchi, and R. Tateno. 2019. “Does Conversion from Natural Forest to Plantation Affect Fungal and Bacterial Biodiversity, Community Structure, and Co-occurrence Networks in the Organic Horizon and Mineral Soil?” Forest Ecology and Management 446: 238–250. doi:10.1016/j.foreco.2019.05.042.
- Network Center for EANET 2021: EANET Data on the Acid Deposition in the East Asian Region. https://monitoring.eanet.asia/document/public/index
- Niu, S., A. T. Classen, J. S. Dukes, P. Kardol, L. Liu, Y. Luo, L. Rustad et al. 2016. “Global Patterns and Substrate-based Mechanisms of the terrestrial Nitrogen Cycle.” Ecology Letters 19 (6): 697–709. DOI:10.1111/ele.12591.
- Nordin, A., J. Strengbom, J. Witzell, T. Nasholm, and L. Ericson. 2005. “Nitrogen Deposition and the Biodiversity of Boreal Forests: Implications for the Nitrogen Critical Load.” AMBIO: A Journal of the Human Environment 34 (1): 20–24. doi:10.1579/0044-7447-34.1.20.
- Oksanen, J., F. G. Blanchet, M. Friendly, R. Kindt, P. R. Legendre, D. McGlinn, P. R. Minchin, et al. 2018. “Vegan: Community Ecology Package.” https://cran.r-project.org/package=vegan
- R Core Team 2017: R: A Language and Environment for Statistical Computing. https://www.r-project.org/.
- Reay, D. S., F. Dentener, P. Smith, J. Grace, and R. A. Feely. 2008. “Global Nitrogen Deposition and Carbon Sinks.” Nature Geoscience 1 (7): 430–437. doi:10.1038/ngeo230.
- Reinmann, A. B., and L. R. Hutyra. 2017. “Edge Effects Enhance Carbon Uptake and Its Vulnerability to Climate Change in Temperate Broadleaf Forests.” Proceedings of the National Academy of Sciences 114 (1): 107–112. doi:10.1073/pnas.1612369114.
- Remy, E., K. Wuyts, K. Verheyen, P. Gundersen, and P. Boeckx. 2018b. “Altered Microbial Communities and Nitrogen Availability in Temperate Forest Edges.” Soil Biology and Biochemistry 116: 179–188. doi:10.1016/j.soilbio.2017.10.016.
- Remy, E., K. Wuyts, L. Van Nevel, P. De Smedt, P. Boeckx, and K. Verheyen. 2018a. “Driving Factors behind Litter Decomposition and Nutrient Release at Temperate Forest Edges.” Ecosystems 21: 755–771. .
- Remy, E., K. Wuyts, P. Boeckx, S. Ginzburg, P. Gundersen, A. Demey, J. Van Den Bulcke, et al. 2016. “Strong Gradients in Nitrogen and Carbon Stocks at Temperate Forest Edges.” . Forest Ecology and Management 376: 45–58. doi:10.1016/j.foreco.2016.05.040.
- Remy, E., R. Gasche, R. Kiese, K. Wuyts, K. Verheyen, and P. Boeckx. 2017. “Edge Effects on N2O, NO and CH4 Fluxes in Two Temperate Forests.” Science of the Total Environment 575: 1150–1155. doi:10.1016/j.scitotenv.2016.09.196.
- Rotthauwe, J. H., K. P. Witzel, and W. Liesack. 1997. “The Ammonia Monooxygenase Structural Gene amoA as a Functional Marker: Molecular Fine-scale Analysis of Natural Ammonia-oxidizing Populations.” Applied and Environmental Microbiology 63 (12): 4704–4712. doi:10.1128/aem.63.12.4704-4712.1997.
- Rustad, L., J. Campbell, G. Marion, R. Norby, M. Mitchell, A. Hartley, J. Cornelissen, and J. Gurevitch. 2001. “A Meta-analysis of the Response of Soil Respiration, Net Nitrogen Mineralization, and Aboveground Plant Growth to Experimental Ecosystem Warming.” Oecologia 126 (4): 543–562. doi:10.1007/s004420000544.
- Schwede, D. B., D. Simpson, J. Tan, J. S. Fu, F. Dentener, E. Du, and W. deVries. 2018. “Spatial Variation of Modelled Total, Dry and Wet Nitrogen Deposition to Forests at Global Scale.” Environmental Pollution 243: 1287–1301. doi:10.1016/j.envpol.2018.09.084.
- Smith, I. A., L. R. Hutyra, A. B. Reinmann, J. K. Marrs, and J. R. Thompson. 2018. “Piecing Together the Fragments: Elucidating Edge Effects on Forest Carbon Dynamics.” Frontiers in Ecology and the Environment 16 (4): 213–221. doi:10.1002/fee.1793.
- Smith, K. A., K. E. Dobbie, B. C. Ball, L. R. Bakken, B. K. Sitaula, S. Hansen, R. Brumme et al. 2000. “Oxidation of Atmospheric Methane in Northern European Soils, Comparison with Other Ecosystems, and Uncertainties in the Global Terrestrial Sink.” Global Change Biology 6 (7): 791–803. DOI:10.1046/j.1365-2486.2000.00356.x.
- Strickland, M. S., and J. Rousk. 2010. “Considering Fungal: Bacterial Dominance in Soils - Methods, Controls, and Ecosystem Implications.” Soil Biology and Biochemistry 42: 1385–1395. doi:10.1016/j.soilbio.2010.05.007.
- Tateno, R., S. Imada, T. Watanabe, K. Fukuzawa, and H. Shibata. 2019. “Reduced Snow Cover Changes Nitrogen Use in Canopy and Understory Vegetation during the Subsequent Growing Season.” Plant and Soil 438 (1–2): 157–172. doi:10.1007/s11104-019-04011-2.
- Tian, D., L. Jiang, S. Ma, W. Fang, B. Schmid, L. Xu, J. Zhu, et al. 2017. “Effects of Nitrogen Deposition on Soil Microbial Communities in Temperate and Subtropical Forests in China.” . Science of the Total Environment 607-608 :1367–1375. doi:10.1016/j.scitotenv.2017.06.057.
- Tourna, M., T. E. Freitag, G. W. Nicol, and J. I. Prosser. 2008. “Growth, Activity and Temperature Responses of Ammonia-oxidizing Archaea and Bacteria in Soil Microcosms.” Environmental Microbiology 10: 1357–1364. doi:10.1111/j.1462-2920.2007.01563.x.
- Turner, S., K. M. Pryer, V. P. W. Miao, and J. D. Palmer. 1999. “Investigating Deep Phylogenetic Relationships among Cyanobacteria and Plastids by Small Subunit rRNA Sequence Analysis.” The Journal of Eukaryotic Microbiology 46: 327–338. doi:10.1111/j.1550-7408.1999.tb04612.x.
- Urakawa, R., N. Ohte, H. Shibata, K. Isobe, R. Tateno, T. Oda, T. Hishi, et al. 2016. “Factors Contributing to Soil Nitrogen Mineralization and Nitrification Rates of Forest Soils in the Japanese Archipelago.” Forest Ecology and Management 361 :382–396. doi:10.1016/j.foreco.2015.11.033.
- Urakawa, R., N. Ohte, H. Shibata, R. Tateno, T. Hishi, K. Fukushima, Y. Inagaki, et al. 2014. “Biogeochemical Nitrogen Properties of Forest Soils in the Japanese Archipelago”. Ecological Research 30: 1–2. 10.1007/s11284-014-1212-8.
- Vance, E. D., P. C. Brookes, and D. S. Jenkinson. 1987. “An Extraction Method for Measuring Soil Microbial Biomass C.” Soil Biology and Biochemistry 19 (6): 703–707. doi:10.1016/0038-0717(87)90052-6.
- Waldner, P., A. Marchetto, A. Thimonier, M. Schmitt, M. Rogora, O. Granke, V. Mues, et al. 2014. “Detection of Temporal Trends in Atmospheric Deposition of Inorganic Nitrogen and Sulphate to Forests in Europe.” Atmospheric Environment 95: 363–374. doi:10.1016/j.atmosenv.2014.06.054.
- Waldrop, M. P., D. R. Zak, and R. L. Sinsabaugh. 2004. “Microbial Community Response to Nitrogen Deposition in Northern Forest Ecosystems.” Soil Biology and Biochemistry 36 (9): 1443–1451. doi:10.1016/j.soilbio.2004.04.023.
- Wang, Q., G. M. Garrity, J. M. Tiedje, and J. R. Cole. 2007. “Naïve Bayesian Classifier for Rapid Assignment of rRNA Sequences into the New Bacterial Taxonomy.” Applied and Environmental Microbiology 73 (16): 5261–5267. doi:10.1128/AEM.00062-07.
- Waud, M., P. Busschaert, S. Ruyters, H. Jacquemyn, and B. Lievens. 2014. “Impact of Primer Choice on Characterization of Orchid Mycorrhizal Communities Using 454 Pyrosequencing.” Molecular Ecology Resources 14: 679–699. doi:10.1111/1755-0998.12229.
- White, T.J., T. Bruns, S. Lee, and J. Taylor. 1990. “Amplification and Direct Sequencing of Fungal Ribosomal RNA Genes for Phylogenetics.” In PCR Protocols: A Guide to Methods and Applications, edited by M.A. Innis, D.H. Gelfand, J.J. Sninsky, and T.J. White, 315–22. New York, US: Academic Press, Inc.https://doi.org/10.1016/b978-0-12-372180-8.50042-1.
- Zak, D. R., W. E. Holmes, N. W. MacDonald, and K. S. Pregitzer. 1999. “Soil Temperature, Matric Potential, and the Kinetics of Microbial Respiration and Nitrogen Mineralization.” Soil Science Society of America Journal 63: 575–584. doi:10.2136/sssaj1999.03615995006300030021x.
- Zhang, T., H. Y. H. Chen, and H. Ruan. 2018. “Global Negative Effects of Nitrogen Deposition on Soil Microbes.” The ISME Journal 12: 1817–1825. doi:10.1038/s41396-018-0096-y.