
ABSTRACT
Vertisols of India are calcareous and have a heavy texture with high clay content but low to medium content of Olsen estimated phosphorus (P). The on-farm and on-station trials revealed that Vertisols with various levels of P2O5 responded negligibly to fertilizer application on soybean crops. In Vertisols, the inorganic P is primarily associated with Ca (Ca-P), which gradually solubilizes under acidic conditions surrounding rhizosphere. Hence, in order to correlate both the findings, the current study investigated the rhizosphere/rhizoplane pH. The study used agar plate technique to observe that the pH of the rhizosphere and rhizoplane soils, which was observed to be acidic although the soil pH was 7.6. The correlation between P uptake and soil-available P measured using the four test methods (Bray 2, Olsen, Truog, and Mehlich 3) revealed that Bray 2 had high correlation with the amount of P absorbed by soybean. Bray 2 method extracts approximately 10 times more P from Vertisols than does the Olsen extractant. This could be a plausible reason for insignificant difference in crop post fertilizer application due to sufficient P fertility of the Vertisols. Hence, Bray 2 method was established as a suitable method for the extraction of P from Vertisols, in which the pH of the extraction solution was the most acidic, among the selected four extraction methods and had high correlation with the amount of P absorbed by soybeans. Hence, this method is recommended for P estimation for Vertisols present in Central India. Essentially, this study provided information that an accurate measurement of P availability is required to explain the non-responsive nature of soybean to P fertilizers in Vertisols. Additionally, the current study emphasized the need for optimum recommendations of P from the view point of rhizosphere; it may facilitate the reduction of the application rates of P to the crops, without reducing the crop yields.
1. Introduction
In India, there has been accelerated increase in fertilizer use to improve the crop productivity. The excessive usage of NPK fertilizer is highly un-desirable from the view of sustainable agriculture angle also represented by (FAI Citation2016). This condition is further aggravated when regional disparity of use of these fertilizers are observed. The state wise consumption of P2O5 in the year 2016–17 for Maharashtra, Madhya Pradesh (two large states of India) is 34.1 kg ha-1 and 25.9 kg ha-1, respectively. These two states have more than 50% of total black Vertisol soil of the country. The recommended and preferred fertilizers utilized in these areas include ‘P’ and the GIS based fertility mapping showed that 94% of Indian soils were classified under low to medium soil P fertility (Muralidharudu et al. Citation2011). However, in spite of the use of such high dosage of P, low agricultural productivity is usually observed in these regions and unreliability of rainfall is often considered the root cause. Additionally to this observed practice, whenever irrigation is sufficient the problems of salinity and sodicity is observed. This leads to a state of confusion which further points out to the method of estimation of the components of the fertilizer used, particularly to the method for estimation of P in this soil.
The Olsen method has long been used for the estimation of phosphorus (P) in the soil available to plants and is being used in soil testing services (Muhr et al. Citation1965). This method of extracting P from soil samples in an alkaline 0.5 M NaHCO3 solution, at the pH 8.5 (Olsen et al. Citation1954), is used because a majority of soils in India are neutral to alkaline. This method is considered suitable for neutral and alkaline soils (Dari et al. Citation2018). Based on the Olsen method, soils are typically categorized into low, medium, and high P availability (<4.4, 4.4–11.1, and >11.1 mg kg−1, respectively) to determine the level of P-fertilizer application (Singh et al. Citation2018; Pathak Citation2010). Further, the recommended amount of P application is based on this categorization. If the available P in the soil falls in the medium category, the application of 60 kg P2O5 ha−1 is recommended for soybean cultivation (Jain et al. Citation2005; Billore and Srivastava Citation2015). In low available-P soils, this dose of P application is increased by 25–50%, and if the soils are high in available-P, the dose can be reduced by 25–50% (Yawalkar, Agrawal, and Bokde Citation1992; Subba Rao Citation2010). This is the commonly used practice in all regions of the country.
However, the benefit of P-fertilizer in low-P Vertisols compared to medium P Alfisols was observed to be less as reported by Sahrawat (Citation1988) for sorghum. The reasons for deficient productivity in spite of recommended amount of P application was therefore thoroughly evaluated. If the 0.5 M NaHCO3 extractable P is <4.4 mg kg−1 soil, a response to applied P is likely (Ghosh and Hasan Citation1979). Further, if there is no observed benefit of P-fertilizer then the plausible reason suggested may be the roots inability to uptake P or possible shortcoming in available P estimation used for P-fertilizer usage recommendation. The widely adopted estimation process provided information about P availability but either the estimation was incorrect or the plant were unable to utilize this available P. The direct relationship with P-availability as measured by Olsen method and the plant response is yet to be clearly established. Therefore, (Ae, Arihara, and Okada Citation1991) questioned the suitability of Olsen method particularly for soils in Central India. Ae suggested that the soil in Central India was mostly Vertisol and therefore the commonly used method of P estimation was providing erroneous results.
Absorption of P is a complicated process and is generally diffused with a diffusion coefficient of 0.13 mm day−1 (Jungk Citation1991) from the P pool trapped in the soil particles to the root surface. Surface area of the roots of a crop species and P uptake are directly proportional (Itoh and Barber Citation1983). Rhizosphere that consists of soil that surrounds root at a thickness of 1.0–2.0 mm approximately is the site of P absorption which is supplied to the plants via the root surface attached to this soil (Youssef and Chino Citation1990). Hence, rhizosphere, rhizoplane, and the exposed root surface affect P-supply and availability to the plants.
Root exudates and several organic acids are usually released by the roots and hence the pH levels of rhizosphere are generally 1–2 units lower than the bulk soil (Riley and Barber Citation1971; Gahoonia, Claassen, and Jungk Citation1992). This suggests that the pH level of Vertisol will be in neutral or acidic range (which is 1–2 units less than 7.5 and 8.5 pH of bulk soil) (Andersson et. al., Citation2010) in rhizosphere particularly on the rhizoplane and root surface. (Neumann et al. Citation1999) reported decrease in pH of the soil leads to the release of P from calcium bound-P (Ca–P) in soil, which may be available to the roots for utilization. The effects of acidification of rhizosphere have been investigated in various crop species grown on Vertisols (Bravo et al. Citation2006; Haque, Lupwayi, and Ssali Citation1999).
Soybean is a major crop with large produce coming from Central part of India. Soil type present in Central India is mostly Vertisols. The estimation of P determines the amount of fertilizers rich in P to be used during annual soybean cropping. Studies have reported minimal changes in crop yield in spite of large scale P-rich fertilizer application in this region. As per the studies reported mentioned above, this minimal change in crop yield could be due to the erroneous P estimation. Additionally, the slow rate of diffusion of P and acidic nature of the rhizospheric soil due to the exudates from the roots suggests that there is certainly need to establish an alternative and most suitable method of estimation of P.
Further, improved accuracy methods for the estimation of available P in Vertisol need to be devised and evaluated. This is important particularly for judicious use of fertilizers in this type of soil and thereby decreasing input cost for production.
Thus, the current investigation was aimed to determine the availability of P to the rhizosphere and rhizoplane of soybean crop in Vertisols by other methods and to find out a suitable P-estimation method for particularly for Vertisols. Further, it was also hypothesized that this could enable better understanding of the relationship between P-availability and root uptake. Additionally, this study aims to conduct on-farm trials to correlate soybean yield and estimated soil P availability based on appropriate and validated testing method.
2. Materials and methods
2.1. Rhizosphere pH
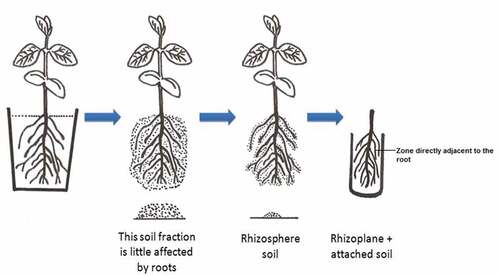
To determine the pH of the rhizosphere, 11 crops species were tested. These included chickpea (Cicer aietenumcv. JG-218), pea (Pisum sativum cv. Arkel), maize (Zea mays cv. JM-13), soybean (Glycine max cv. JS95-60), sorghum (Sorghum vulgare cv. JJ-714), moong (Phaseolus aureus cv. JM-721), wheat (Triticum aestivum cv. JW-7), barley (Hordeum vulgare cv. Karan-201), mustard (Brassica nigra cv. JM-1), berseem (Trifolium alexandrinum cv. Pusa giant), and sesame (Sesamum indicum cv. JS-7). A pot was filled with 1.0 kg of Vertisol collected from the research farm of the College of Agriculture, which is located at Jabalpur in Madhya Pradesh, India. The pH of this soil was 7.6. After sowing the seeds of different crops, a nutrient solution (Hoagland and Arnon Citation1950) was applied. The pots were placed in a net house. Pots without plants were also included as ‘bulk soil’ in this experiment. After a cultivation period of 20 days, plants were uprooted from the pots and shaken gently. The procedure reported by (Barillot et al. Citation2013) was followed. When shaken gently, the loosely held soil particles that separated easily and were not attached to the roots were considered as non-rhizosphere soil. When the roots were vigorously shaken, the released soil that was more tightly attached to the root system was collected by brushing (to measure pH) and was called ‘rhizosphere soil.’ The soil remaining on the roots was immersed (along with the roots) in a test tube containing water and its pH was measured. This soil was called ‘rhizoplane-attached soil.’ These entire fractions, including the bulk soil, were placed in water at a soil to water ratio of approximately 1:2.5, and the pH was measured using a Horiba Laqua Twin pH meter (the HORIBA, Japan; ).
Figure 1. Method of collecting ‘rhizosphere’ and ‘rhizoplane + attached soil.’ rhizospheric soil and region is investigated. Bulk soil is from unplanted pots; these are treated same as planted pot.
2.2. Estimation of rhizoplane pH
For determining the pH of the root surface, we grew soybean and sorghum in small pots (500 cm3) filled with sand; then, 12-day-old seedlings of crops were carefully removed without damaging the roots. The roots were placed on an agar plate (adjusted to pH 7.0) containing four pH indicators, bromothymol blue, bromcresol purple, methyl red, and bromcresol green. We then observed changes in the color of the agar plate as described by (Weisenseel, Dorn, and Jaffe Citation1979; Haussling et al. Citation1985).
2.3. Collection of 29 soil samples of three P level categories by the Olsen method
To verify the categorization of P availability in soils using the Olsen method in India, 29 soil samples were collected from eastern Madhya Pradesh and classified into low, medium, and high categories of available P, as per the criteria of the (Ghosh and Hasan Citation1979). The pH of these soil samples was measured using a glass electrode. The soil to water ratio used for measurement was 1:2.5. The electrical conductivity (EC) was measured using the method described by Piper (Citation1950). Organic carbon was determined using the method of Walkley and Black (Citation1934). Available P in soils was extracted by four methods that involve different pH levels of extraction, the Olsen method (Extractant: O.5 M NaHC03) at pH 8.5, Bray 2 method (Extractant: 0.03 N NH4F + O.lN HCI) at pH 1.5 (Bray and Kurtz Citation1945), Truog method (Extractant: 0.002 N H2SO4) at the pH 3.0 (Truog Citation1930), and Mehlich 3 method (Extractant: 0.2 M CH3COOH + 0.25 M NH4NO3 + 0.015 M NH4F+0.013 M HNO3 + 0.001 M EDTA) at pH 2.5 (Mehlich Citation2008). The three methods (other than the Olsen method) involved acidic extraction, whereas the Olsen method involved alkaline extraction. The amount of P in the four extracts was estimated using the ascorbic acid method (Murphy and Riley Citation1962) and fractionation of soil inorganic P was determined by the method of Chang and Jackson (Citation1957).
2.4. Pot experiments
Pot experiments were carried out in July, 2015, to compare the relationships between plant P uptake and soil-available P, estimated using different soil testing methods. Of the 29 soil samples previously mentioned, 5 soil samples were selected to fill polythene lined earthen pots at 5 kg pot−1 for each soil samples. Popular soybean (cv. JS-9560) was sown in the pots. All the pots received nitrogen at 20 mg-N kg−1 as urea, and potassium at 20 mg-K2O kg−1 as potassium chloride. For each plot, three levels of P fertilizer at 0, 50, and 100 mg-P2O5 kg−1 were applied as single super phosphate (SSP). Thus, for each soil, a total of 9 pots (3 P levels × 3 replicates) were prepared and used evaluation of plant P uptake. The soybean plants were harvested at the flowering stage (approximately 45 days after sowing, DAS) to determine the dry matter weight after drying at 60°C. Dry soybean plants were crushed, ground, and digested in a di-acid mixture containing (HNO3 and HClO4) to determine the plant P concentration using the vanado-molybdate method (Koenig and Jhonson Citation1942).
2.5. Effects of pH using wide-range GTA buffer on P solubilization from Vertisols
The effects of pH on the solubility of P from Vertisols were tested. Hence, solutions of 0.1 M wide-range GTA buffer (mixture of 0.1 M 3, 3-dimethyl-glutaric acid, 0.1 M Tris-hydroxymethyl-aminomethane, and 0.1 M 2-amino-2- methyl-1, 3-propanediol) at pH 4.5, 5.5, 6.5, 7.5, and 8.5, respectively were prepared. To test the effects of pH on soil P solubilization, we selected three soils with different P levels from the previously selected five soils used for pot experiment, two soil samples were Vertisols and one was an Alfisol. To 1 g of soil, 40 mL of GTA buffer solution was added. The soil and buffer mixture was shaken for 30 min. Thereafter, the solubilities of P from calcium phosphate (Ca-P) in the soils were measured, as described by Tsujimoto et al. (Citation2007)
2.6. Field experiments for evaluating soybean growth response to P fertilizer application
An experiment was conducted at a field (Vertisol) of the College of Agriculture [22.7056139,75.8983153], Indore, Madhya Pradesh, during the rainy season of 2015. For evaluating the response of P fertilizer application to soybean, the soybean cultivar JS-9305 was sown on 25 June 2015. The experiment consisted of the following six treatments: 1) no P fertilizer (P0), 2) no P fertilizer but elemental sulfur (S) applied (P0 + S), because sulfur deficiencies have been reported in India and the applied SSP contains S as calcium sulfate; therefore, S was applied in all five treatments, except in P0, to maintain the level of S applied in the highest doses of P fertilizer plot (P180), which received P at 180-kg P2O5 ha−1 as SSP (P0 + S), 3) 30 kg-P2O5 ha−1 applied (P30), 4) 60 kg-P2O5 ha−1 applied (P60), 5) 120 kg-P2O5 ha−1 applied (P120), and 6) 180 kg-P2O5 ha−1 applied (P180). The three plots, P30, P60, and P120, received lower amounts of S than did the P180 plot because sulfur in the experimental plot originated from applied SSP only. The plots P30, P60, P120 were provided with elemental S and the S levels of the three plots were maintained at the S level in the P180 plot. Therefore, all the plots except P0 plot received identical amounts of S, 135 kg ha−1.
All the plots received a uniform application of N (20 kg-N ha−1 as urea) and K2O (20 kg- K2O ha−1 as potassium chloride). The plot size was 25 m2 (5.0 m × 5.0 m), and 18 plots were arranged in three blocks and with three replicates. An herbicide (Imazathyper) was applied for weed control, and pest control was also carried out using insecticides (Trizophos and Quinalphos). The soybean plants were harvested after 95 DAS at physiological maturity, and the plants were allowed to air dry for 2 to 3 days. Then, the dry matter and grain yield were recorded. During the crop growing season 924.7 mm of rainfall was received.
Furthermore, we evaluated soybean yield response to P fertilizer on two farmer’s fields during the rainy season in 2015. The trials were conducted in two districts of Madhya Pradesh, Indore (22.760422 N, 76.012298E) and Ujjain (23.110000 N, 75.4118000E). The sowing date of soybean crop was 20 June 2015 at Indore and 22 June 2015 at Ujjain. The soils of the trial farms were Vertisols and P availability was low (3.0 mg-P kg−1 by using the Olsen method) at Ujjain and ‘medium’ (5.5 mg-P kg−1) at Indore. The area of each plot was 60 m × 60 m and three replicates were used. The three plots were 1) No-fertilizer (nitrogen, phosphorus, and potassium fertilizers were not applied, considered as a control; N0-P0-K0), 2) nitrogen was applied at 20 kg-N ha−1 as urea, P at 60 kg-P2O5 ha−1 as SSP, and at 20 kg-K2O ha−1 as potassium chloride (N20-P60-K20), and 3) no P fertilizer, but the rates of N and K2O were identical to the second plot (N20-P0-K20).
All of nitrogen, P, and potassium fertilizers were applied as basal applications. The soybean variety cv. JS-9305 was used as a test crop. Operations of weeding and pest control were performed at both the sites similar to the experiments conducted in the College of Agriculture research farm Indore. Soybean plants were harvested from both the places at physiological maturity (95 DAS), and the grain yields were measured after drying the harvested crop. During the growing period, the amounts of rainfall received were 924 mm and 1907 mm at Indore and Ujjain, respectively.
3. Results and discussion
3.1. pH of rhizosphere soil and roots surface of a soybean plant
The pH of the rhizosphere soil and ‘rhizoplane + attached soil’ of 11 crop species is listed in . The pH of the bulk soil, which was unplanted was 7.6. There was no difference in the treatment of planted and unplanted soil with regard to the supply of nutrients and water. Decrease in pH of rhizosphere soil to pH 7.4 and rhizoplane+attached soil to pH 6.0 was observed in pots with soybean plants. The pH of rhizosphere soil of all test crops, including graminaceous and leguminous crops, reduced had pH values between 7.4 and 7.2 compared with the pH of non-rhizosphere soil (pH 7.6).
Table 1. The pH of bulk, rhizosphere and rhizoplane-attached soil of crop species grown in pots filled with a Vertisol
Among the 11 crop species tested, the lowest pH in the rhizosphere and ‘rhizoplane + attached soil’ was noticed in the case of chickpea. Roots of chickpea crop have been reported to exude higher amount of organic acid, that is, citric acid than the roots of other crops (Hoffland, Findenegg, and Nelemans Citation1989; Ohwaki and Hirata Citation1992). The pH of ‘rhizoplane + attached soil’ was 6.0 to 6.4 in case of four graminaceous plants compared to that of leguminous plant () (5.8 to 6.2). Youssef and Chino (Citation1989) reported that soybean (leguminous) and barley (Poaceae) grown in clay loam soil on pH 7.0 reduced the rhizosphere pH by as much as 2 units.
Furthermore, the P deficiency can increase rhizosphere acidification in many crop species, maize (Zea mays L.), soybean (Glycine max L.), sorghum (Sorghum bicolor L.), sordan [sorghum (S. bicolor L.), sudangrass (Sorghum sudanese L.) hybrid], wheat (Triticum aestivum L.), oats (Avena sativa L.), and barley (Hordeum vulgare L.) (Gollany and Schumacher Citation1993). Hence, the release of organic acid and protons (H+), affecting the pH on root surface, is influenced by the nutritional and the physiological state of the plant (Rengel Citation2002; Dakora and Phillips Citation2002). Furthermore, the pH of the rhizosphere soil was strongly affected by the growth and density of the root systems. Organic acid exudates change rhizosphere pH is common root processes that contribute to increasing P availability and its uptake (Hinsinger Citation2001; Oburger, Jones, and Wenzel Citation2011).
Zhou et al. (Citation2009) reported rhizosphere acidification by faba bean, soybean, and maize in pH indicator (Bromocresol purple). We measured the pH of plant root surfaces using agar plates containing pH indicator, and the pH of the plates was adjusted to 7.0 before placing the plant root samples on the agar. presents the state of color changes induced the roots. The reduced pH of soybean root changes the color of the two indicators (methyl red and bromocresol green). Thus, the rhizoplane pH appeared to be as low as 6.0–5.2 (). This decrease in pH may possibly be to enhance the solubility of P from the fixed Ca–P form in calcareous Vertisols.
Table 2. Color changing in agar-plate by roots of soybean and sorghum seedlings
Phosphorus movement toward the root surface occurs by diffusion, and the diffusion rate is extremely low, <0.13 mm day−1 (Jungk Citation1991). Itoh and Barber (Citation1983) reported that P uptake by crop species largely depends on the root surface area, including the root hairs. This implies that a plant can absorb only P that is present in a very thin soil layer surrounding the root surface of the crops. Therefore, P absorption is highly affected by root surface environment.
3.2. Comparison of methods used for the estimation of soil P availability
From the eastern Madhya Pradesh region, 29 soils (including one Alfisol) were collected (a majority of soils are Vertisols in this area) and available P was estimated using four methods, namely the Olsen, Bray 2, Truog, and Mehlich 3 methods. presents ranges (minimum, maximum, and mean values) of P extracted by these four methods.
Table 3. Variability of various P availability of categorized 29 soil samples by Olsen method
The Bray 2, Truog, and Mehlich 3 methods, which involve acid extraction, released considerably more P than did the Olsen method. The range of available-P by the Olsen method is 0.7–29.1 mg-P kg−1, by the Mehlich 3 method is 1.0–86 mg-P kg−1, by the Truog method is 2.9–127 mg-P kg−1, and by the Bray 2 method is 9.1–264 mg-P kg−1, respectively, in the 29 soil samples. The Bray 2 method enabled the extraction of 10 times more available P than did the Olsen method.
If we carefully observe , some of the soils that have been evaluated as ‘low’ using the Olsen method, will possibly be evaluated as ‘high’ in the Mehlich 3, Truog, and Bray 2 methods. The reverse also is true.
3.3. P fertilizer effect in soybean growth
29 soil samples collected from different villages of eastern Madhya Pradesh, India. Five soil samples were used for conducting pot experiments to evaluate the response of applied P to soybean (cv. JS-9560). The 29 collected soils were analyzed for available P status using four methods namely, Olsen, Bray 2, Truog, and Mehlich 3 methods and data are presented in . Evidently, the soil belongs to low, medium, and high P status on the basis of the Olsen method. The other three methods yielded higher available P than the Olsen method did. The available P status and P fertility of the five soils selected for the pot experiment are listed in .
Table 4. Phosphorus status of 5 soils used for pot experiment, selected from 29 soil samples shown in previous table
Of the five selected soil samples, four were Vertisols (Kukrikheda, Rampura, Kendrakheda, and Suhagi), and one soil, from Dumna, was an Alfisol. From the table, the soils were medium in pH (7.1–7.5) except the Dumna soil, which was acidic in reaction (pH 6.3). The electrical conductivity ranged from 0.09–0.33 dSm−1. The organic carbon varied considerably; it was low in the soils from Kukrikheda and Dumna, medium in the soils from Rampura and Suhagi, and high in the soil from Kendrakheda. The fractions of soil P were also estimated, which revealed that the major inorganic P fractions of Vertisols was Ca–P, ranging from 103 to 280 mg-P kg−1, the Fe-P was in the range 12–71 mg-P kg−1, and Al-P was in the range 11–25 mg-P kg−1. The available P estimated by four methods revealed that the soils were in the low to higher category in terms of Olsen P. The range of Olsen P was 1.9 to 38.5 mg-P kg−1, Bray 2 P ranged from 11.8 to 234 mg-P kg−1, showing a high range of Bray 2 available P than Olsen-P.
In the case of the Truog and Mehlich 3 methods the ranges of available P were 6.8–42.8 and 1.1–69.1 mg-P kg−1, respectively.
3.4. Solubility of P from calcium phosphate (Ca-P)
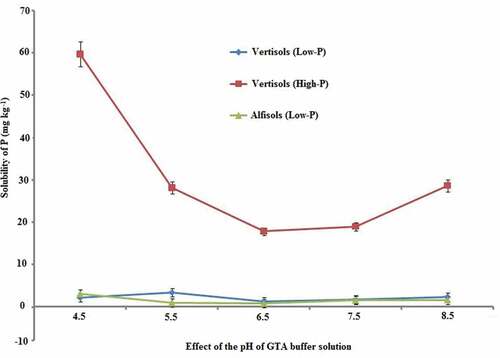
To confirm P solubilization from low and high P status soils, the Vertisols experiment was conducted using a wide-range GTA buffer. The effect of pH on the P solubilization is depicted in . Evidently the Kendrakheda soil could release more P in acidic range. As the pH increased, the P solubilization also decreased up to pH 7.5, whereas in other two soils, from Dumna and Kukrikheda, this trend was not observed. Though the three Vertisols (Kukrikheda, Rampura, and Suhagi) contained similar amounts of Ca–P (103–116 mg-P kg−1), and belonged to the ‘low’ category in P fertility, on the basis of the Olsen method, P availability by Bray 2 yielded considerably different results (12–91 mg-P kg−1). This study demonstrated that in Vertisols with high P content the solubility of P was very high at low pH. Furthermore, in Vertisols and Alfisols with low P the solubility of P insignificantly changed at different pH levels. This phenomenon implied that the solubilizing characteristics of the Ca–P fraction in Vertisols depend on the degree of crystallization during the development process of Vertisols. This might lead to variation in available-P because of the solubility of P. Further research on the crystalline structure of Ca–P is required.
Figure 2. Effect of pH on P solubilized from a ‘Low’ vertisol and a ‘High’ vertisol, and an Alfisol. The bars represent SE.
Additionally, the pot experiment was conducted with the same five soils to evaluate the effect of P on soybean grown in three P levels (0, 50, and 100 mg-P kg−1 as SSP; ). Scatter diagrams depicting the relationship between soil P availability estimated by four methods and P uptake are presented in .
Figure 3. Relationship between P uptake by soybean and Olsen (3a), Truog (3b), Bray 2 (3c) P, and Mehlich (3d). These four methods are used for P-extraction and were investigated to observed maximum P-extraction by Bray 2 method for Vertisols.
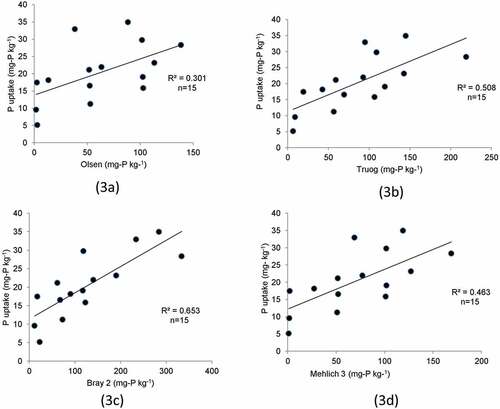
The highest determination coefficient was obtained in case of the Bray 2 (r2 = 0.653), followed by the Truog (r2 = 0.508), and Mehlich 3 (r2 = 0.464) methods, and it is the lowest in the Olsen (r2 = 0.301) method. The Olsen method was inferior to the other three methods for predicting soil P fertility among the four analytical methods.
As discussed in , presuming the value of Bray 2 P based on the Olsen method is difficult. Even if soils have high values of available P estimated by the Olsen method, relatively high soils fertility, estimated by the Bray 2 method, is not implied. The reverse is also true. Although the Bray 2 method can estimate P fertility more dependably than the Truog, Mehlich 3, and Olsen methods can, the correlation coefficient between P uptake (or dry matter production) and soil P fertility is not sufficiently high. A further development for extraction method is needed.
Although P fertilizer produces a negligible effect on soybean growth, this may be an underestimation of available soil P by the Olsen method. Indian Vertisols may be considerably more fertile (10 times more) than evaluated by the Olsen method. We need to measure P fertility using the Bray 2 method and some other methods that involve the use of acid extractants.
3.5. Field experiments
To demonstrate that Vertisols have a higher P availability than that evaluated using the Olsen method, a field experiment was carried out on a Vertisol of College of Agriculture, Indore. The soils of experimental area are deep Vertisols (fine montmorrillonitic family of typichaplusterts) and the clay content of approximately 56% to 60% throughout the first meter of the profile. The treatments consisted of the following five P levels: given 0, 0 + S, 30, 60, 120, 180 kg-P2O5 ha−1. All the plots, except P0, received identical amounts of S.
The effects of P fertilizer on soybean yield are presented in and soil characterization of the College field and farmer’s fields are presented in . Because the soils were not deficient in S, no significant differences were observed in the soybean seed yield between P0 and P0 + S treatments. Furthermore, we did not observe any significant difference or increase in soybean yield and P uptake with the application of various levels of P in Vertisols. The Olsen value of college soil indicated medium fertility (7.5 mg-P kg−1) but this soil indicated the highest P fertility of 132 mg P kg−1 available P estimated by the Bray 2 method.
Table 5. Physicochemical characteristics of 3 field soils where soybean plants were cultivated
Figure 4. Effect of P fertilizer to soybean yield in three locations of India: (4a) Indore; (4b) Ujjain; (4c) Farmer’s field at Indore.
Field experiments of soybean on farmer’s field (Indore and Ujjain) were also conducted to evaluate the response of P application on soybean yield. The effect of P fertilizer could not be observed as a significant difference in yield between the (N20-P60-K20) and (N20-P0-K20) plots in the two farmer’s fields (). Available P at Ujjain (3.0 mg-P kg−1 by the Olsen method) and Indore (5.5 mg-P kg−1 by the Olsen method) increased to 80 (mg-P kg−1) and 75 (mg-P kg−1), respectively by the Bray 2 method. This implies that two farmer’s fields are much more fertile, in terms of soil P availability, than estimated by the Olsen method. These two soils are relatively ‘high’ fertility soils that are approximately 10 times more fertile than estimated. Furthermore, significant differences in the soybean yields were observed between the (N0-P0-K0) and (N20-P0-K20) plots, suggesting that nitrogen fertilization may be beneficial because exchangeable potassium is extremely high (see ) and additional potassium fertilizer will not be required for soybean yield in these fields.
With regard to P fertilization, P application did not affect the productivity of soybean grown in calcareous Vertisols. This finding is also consistent with previous studies, which have indicated that chickpea did not respond to P fertilizer application in Vertisols (Mamo et al. Citation1993).
4. Conclusions
In conclusion, root exudates change the chemical conditions of the rhizosphere because they reduce the pH of the rhizosphere and rhizoplane. The pH of soybean soil was lower than that of bulk soil i.e., the acidifying action of rhizosphere soil by soybean roots is high. The acidification could be due to excessive cations over anions, causing the release of H+ by the roots. Acid secretions from the roots of crops aid to increase the solubility of P from Ca-P, abundant in Vertisols. The most of the leguminous crops show acidic pH of the rhizosphere, which plays a major role in enhancing the availability of P to crops. All these studies directly emphasize the poor response of Vertisols to P application. Acid extraction of P can more accurately predict the effect of P in Vertisols compared with alkaline extraction. Olsen method is not suitable for assessing soil fertility in calcareous soils with high phosphorus content and further this study emphasized the use of rhizospheric soil and pH conditions of rhizosphere should be considered for optimum selection of methods of P estimation. This investigations established that Bray 2 method was the most suitable P estimation method among the four commonly used methods for P extraction for Vertisols of Central India and a correlation was also made with the response of soybean crop. Additionally, the current study emphasized the need for optimum recommendations of P from the view point of rhizosphere; it may facilitate the reduction of the application rates of P to the crops, without reducing the crop yields. Acidification of the rhizosphere soil was observed in not only soybean, but also in some other crop species. The outcome of this research will have wide implications in Indian context with regard to mapping of soil fertility and selection of estimation methods thereby emphasizing on the judicious use of fertilizers.
Acknowledgments
This study was conducted under the Project for Maximization of Soybean Production in Madhya Pradesh supported by Government of Madhya Pradesh and Japan International Co-operation Agency (JICA). We also thank Dr. Ken Taniwaki and Ms. Mariko Ohata for providing suggestion and facilities for conducting the experiments. We sincerely express our gratitude for both of them.
Author contributions
S.K.S. supervised the experiments. B.S.D designed the experiments and experiments were performed by N.C. and N.A. Analysis was performed by N.C. and N.A. N.C. and D.K.S prepared, edited and reviewed the draft.
Supplemental Material
Download MS Word (11.9 KB)Disclosure statement
No potential conflict of interest was reported by the author(s).
Supplementary material
Supplemental data for this article can be accessed here.
Additional information
Funding
References
- Ae, N., J. Arihara, and K. Okada. 1991. “Phosphorus Response of Chickpea and Evaluation of Phosphorus Availability in Indian Alfisols and Vertisols.” In Phosphorus Nutrition of Grain Legumes in the Semi-arid Tropics, edited by C. Johansen, K. K. Lee, and K. L. Sahrawat. India, CP 671, 33–41. Patancheru: ICRISAT.
- Andersson, K. O., M. K. Tighe, C. N. Guppy, P. J. Milham, and T. I. McLaren. 2010. “The Release of Phosphorus in Alkaline Vertic Soils as Influenced by pH and by Anion and Cation Sinks.” Geoderma 264: 17–27. doi:10.1016/j.geoderma.2015.10.001.
- Barillot, C. D. C., C. O. Sarde, V. Bert, E. Eric Tarnaud, and N. Cochet. 2013. “A Standardized Method for the Sampling of Rhizosphere and Rhizoplan Soil Bacteria Associated to A Herbaceous Root System.” Annals of Microbiology 63 (2): 471–476. doi:10.1007/s13213-012-0491-y.
- Billore, S. D., and S. K. Srivastava. 2015. “Integrated Nutrient Management in Soybean Varieties Grown under Different Agro-climatic Conditions of India.” Soybean Research 13: 26–42.
- Bravo, C., J. Torrent, J. V. Giraldez, P. Gonzalez, and R. Ordonez. 2006. “Long-term Effect of Tillage on Phosphorus Forms and Sorption in a Vertisol of Southern Spain.” European Journal of Agronomy 25 (3): 264–269. doi:10.1016/j.eja.2006.06.003.
- Bray, H. R., and L. T. Kurtz. 1945. “Determination of Total and Available Form of Phosphorus in Soils.” Soil Science 9 (1): 39–46. doi:10.1097/00010694-194501000-00006.
- Chang, S. C., and M. L. Jackson. 1957. “Fractionation of Soil Phosphorus.” Soil Science 84 (2): 133–144. doi:10.1097/00010694-195708000-00005.
- Dakora, F. D., and D. A. Phillips. 2002. “Root Exudates as Mediators of Mineral Acquisition in Low-nutrient Environments.” Plant and Soil 245 (1): 35–47. doi:10.1023/A:1020809400075.
- Dari, B., C. W. Rogers, A. Leytem, and K. Schroeder. 2018. “Evaluation of Soil Test Phosphorus Extractants in Idaho Soils.” Soil Science Society of America Journal 83 (3): 817–824. doi:10.2136/sssaj2018.08.0314.
- FAI. 2016. “Fertilizer Statistics 2015-16.” In 61st Edition, New Delhi: Fertilizer Association of India.
- Gahoonia, T. S., N. Claassen, and A. Jungk. 1992. “Mobilization of Phosphate in Different Soils by Ryegrass Supplied with Ammonium or Nitrate.” Plant and Soil 140 (2): 241–248. doi:10.1007/BF00010600.
- Ghosh, A. B., and R. Hasan. 1979. “Phosphorus in Soils, Crops and Fertilizers.” In Indian Society of Soil Science, 611. New Delhi. (12)
- Gollany, H. T., and T. E. Schumacher. 1993. “Combined Use of Colorimetric and Microelectrode Methods for Evaluating Rhizosphere pH.” Plant and Soil 9 (2): 151–159. doi:10.1007/BF00012520.
- Haque, I., N. Z. Lupwayi, and H. Ssali. 1999. “Agronomic Evaluation of Unacidulated and Partially Acidulated Minjingu and Chilembwe Phosphate Rocks for Clover Production in Ethiopia.” European Journal of Agronomy 10 (1): 37–47. doi:10.1016/S1161-0301(98)00048-3.
- Haussling, M., E. Leisen, H. Marschner, and V. Romheld. 1985. “An Improved Method for Non Descriptive Measurement of the pH at the Root–soil Interface (Rhizosphere).” Journal of Plant Physiology 117 (4): 371–375. doi:10.1016/S0176-1617(85)80073-0.
- Hinsinger, P. 2001. “Bioavailability of Soil Inorganic P in the Rhizosphere as Affected by Root-induced Chemical Changes: A Review.” Plant and Soil 237 (2): 173–195. doi:10.1023/A:1013351617532.
- Hoagland, D. R., and D. I. Arnon. 1950. “The Water-culture Method of Growing Plants without Soil.” California Agricultural Experiment Station 347: 1–32.
- Hoffland, E., G. R. Findenegg, and J. A. Nelemans. 1989. “Solubilization of Rock Phosphate by Rape.” Plant and Soil 113 (2): 161–165. doi:10.1007/BF02280176.
- Itoh, S., and S. A. Barber. 1983. “Phosphorus Uptake by Six Plant Species as Related to Root Hairs 1.” Journal of Agronomy 75 (3): 457–461. doi:10.2134/agronj1983.00021962007500030010x.
- Jain, V., V. Jain, S. K. Vishwakarma, and R. S. Sharma. 2005. “Maximization of Productivity of Soybean (Glycine Max)–wheat (Triticum Aestivum) System in Kymore Plateau and Satpura Hill Zone of Madhya Pradesh.” Indian Journal of Agronomy 50: 19–21.
- Jungk, A. O. 1991. “Dynamics of Nutrients Movement at the Soil-root Interface.” In Plant Roots- The Hidden Half, edited by Waisel, Y. and Eshel, S., 455-481. New York: Marcel Dekker.
- Koenig, R. A., and C. R. Jhonson. 1942. “Colorimetric Determination of Phosphorus in Biological Material.” Industrial and Engineering Chemistry Analytical Edition 14 (2): 155. doi:10.1021/i560102a026.
- Mamo, T., A. Astatke, K. L. Srivastava, and A. Dibabe. 1993. “Improved Management of Vertisols for Sustainable Crop-livestock Production in the Ethiopian Highlands.” Synthesis Report 1986-1992, Technical committee of the joint Vertisol management project, Addis Ababa, Ethiopia.
- Mehlich, A. 2008. “Mehlich 3 Soil Test Extractant: A Modification of Mehlich 2 Extractant.” Communications in Soil Science and Plant Analysis 15 (12): 1409–1416. doi:10.1080/00103628409367568.
- Muhr, G., N. P. Datta, H. Subramoney, V. K. Leley, and R. L. Donhaue.1965. “Soil Testing in India.” USDIA, New Delhi.
- Muralidharudu, Y., K. Sammi Reddy, B. N. Mandal, A. Subba Rao, K. Singh, and S. Sonekar. 2011. “GIS Based Soil Fertility Maps of Different States of India. All India Coordinated Project on Soil Test Crop Response Correlation.” In 12–24. Bhopal: Indian Institute of Soil Science.
- Murphy, J., and J. P. Riley. 1962. “A Modified Single Solution Method for the Determination of Phosphate in Natural Waters.” Analytica chimica acta 27: 31–36. doi:10.1016/S0003-2670(00)88444-5.
- Neumann, G., A. Massonneau, E. Mertinoia, and V. Romheld. 1999. “Physiological Adaptation to Phosphorus Deficient during Proteoid Root Development in White Lupin.” Planta 208 (3): 373–382. doi:10.1007/s004250050572.
- Oburger, E., D. L. Jones, and W. W. Wenzel. 2011. “Phosphorus Saturation and pH Differentially Regulate the Efficiency of Organic Acid Anion-mediated P Solubilization Mechanisms in Soil.” Plant and Soil 341 (1–2): 363–382. doi:10.1007/s11104-010-0650-5.
- Ohwaki, Y., and H. Hirata. 1992. “Differences in Carboxylic Acid Exudation among P Starved Leguminous Crops in Relation to Carboxylic Acid Contents in Plant Tissues and Phospholipid Level in Roots.” Soil Science and Plant Nutrition 38 (2): 235–243. doi:10.1080/00380768.1992.10416486.
- Olsen, S. R., C. V. Cole, F. S. Watanabe, and L. A. Dean. 1954. “Estimation of Available Phosphorus in Soil by Extraction with Sodium Bicarbonate.” USDA circular 939. Washington, DC: U.S. Govt. Printing Office.
- Pathak, H. 2010. “Trend of Fertility Status of Indian Soils.” Current Advances in Agricultural Sciences 2: 10–12.
- Piper, C. S. 1950. Soil and Plant Analysis. New York: Inter Science Publisher, .
- Rengel, Z. 2002. “Genetic Control of Root Exudation.” Plant and Soil 245 (1): 59–70. doi:10.1023/A:1020646011229.
- Riley, D., and S. A. Barber. 1971. “Effect of Ammonium and Nitrate Fertilization on Phosphorus Uptake as Related to Root Induced pH Changes at the Root-soil Interface.” Soil Science Society of America Journal 35 (2): 301–306. doi:10.2136/sssaj1971.03615995003500020035x.
- Sahrawat, K. L. 1988. “Overview of Research on Phosphorus in Vertisols.” In: Phosphorus in Indian Vertisols. Summary Proceedings of a Workshop. 23-26 Aug 1988, International Crops Research Institute for the Semi-Arid Tropics (ICRISAT), Patancheru, India: 4–8.
- Singh, G., and B. Kumar; Shashikant. 2018. “Soil Fertility Mapping Using Remote Sensing and GIS in NSP Farms of ND University of Agriculture and Technology, Kumarganj, Faizabad, Uttar Pradesh, India.” International Journal of Current Microbiology and Applied Science 7: 1394–1402.
- Subba Rao, A. 2010. “Soil Testing for Fertility Improvement.” Bulletin No. 12, Indian Society of Soil Science. Bhopal.
- Truog, E. 1930. “The Determination of the Readily Available Phosphorus of Soils 1.” American Society of Agronomy 22 (10): 874–882. doi:10.2134/agronj1930.00021962002200100008x.
- Tsujimoto, R., Y. Noami, Y. Ikumi, T. Suzuki, and N. Ae. 2007. “Phosphorus Availability of Recycled Calcium Phosphorus Produced from Sewage Sludge.” Japanese Journal of Soil Science and Plant Nutrition 78: 245–252.
- Walkley, A., and I. A. Black. 1934. “Estimation of Soil Organic Carbon by the Chromic Acid Titration Method.” Soil Science 47 (1): 29–38. doi:10.1097/00010694-193401000-00003.
- Weisenseel, M. H., A. Dorn, and F. J. Jaffe. 1979. “Natural H+ Currents Traverse Growing Roots and Root Hairs of Barley (Hordeum Vulgare L.).” Journal of Plant Physiology 64 (3): 512–518. doi:10.1104/pp.64.3.512.
- Yawalkar, K. S., J. P. Agrawal, and S. Bokde. 1992. “Balanced and Profitable Use of Fertilizers.” In Manures and Fertilizers, 273–296. Nagpur: Agricultural Horticultural Publishing House.
- Youssef, R. A., and M. Chino. 1990. “Effects of Rhizosphere Processes on the Solubilization of Manganese as Revealed with Radioisotope Techniques.” In Plant Nutrition Physiology and Applications, edited by M. L. Van Beusichem, 229–233. Dordrecht: Academic Publish.
- Youssef, R. A., and M. Chino. 1989. “Root-Induced Change in the Rhizosphere of Plants.” Soil Science and Plant Nutrition 35 (3): 461–468. doi:10.1080/00380768.1989.10434779.
- Zhou, L. L., J. Cao, F. S. Zhang, and L. Li. 2009. “Rhizosphere Acidification of Faba Bean, Soybean and Maize.” Science of the Total Environment 407 (14): 4356–4362. doi:10.1016/j.scitotenv.2009.02.006.