
 ?Mathematical formulae have been encoded as MathML and are displayed in this HTML version using MathJax in order to improve their display. Uncheck the box to turn MathJax off. This feature requires Javascript. Click on a formula to zoom.
ABSTRACT
Soil salinity is a global problem, which is predicted to worsen in arid and semi-arid regions due to climate change. The aim of this study was to understand the remediation potential of biochar in alleviating salt stress by studying its effects on the growth and physiological parameters of the tomato (Solanum lycopersicum). A completely randomized design (CRD) was used where three different biochar doses (0%, 5% (v/v), and 10% (v/v)) were applied to the soil under saline (100 M) and non-saline conditions. Our results showed that while salt stress affected the plant growth negatively at all biochar doses, 5% and 10% biochar applications improved the overall plant performance under saline conditions. For the samples with salt stress, plant height and leaf area were increased by 43.1% and 45.3%, respectively, and physiological parameters, such as leaf relative water content and chlorophyll-a content, increased when 5% biochar was used. On the other hand, the highest increase rates in shoot fresh weight (113.7%), shoot dry weight (74.8%), the number of leaves (24.9%), root fresh weight (115.5%), root dry weight (62.5%) were obtained from 10% biochar amendment under saline conditions. Moreover, biochar amendment at both doses significantly decreased the superoxide dismutase (SOD), catalase (CAT) and peroxidase (POD) activities, as well as malondialdehyde (MDA) and proline contents, which resulted in an improved plant growth due to the reduction of the oxidative and osmotic stresses. In conclusion, biochar amendment might be a promising approach to mitigate the adverse effects of salinity stress on tomato seedlings
1. Introduction
Among all the abiotic stresses limiting crop plant production worldwide, salinity stress is considered one of the most injurious environmental factors (Machado and Serralheiro Citation2017). Salt toxicity can cause severe damages to plants such as tissue burning, root and shoot death, leaf abscission, reduction of stomata conductance, disrupted cellular metabolism and decreased photosynthetic activity (Hussain et al. Citation2019). Besides decreasing the agricultural production of most crops, salinity also disturbs soil physicochemical properties and the ecological balance of the region (Shrivastava and Kumar Citation2015).
There are studies conducted on several methods to lessen the damaging effects of salt stress on plants, such as scraping, flushing, and leaching to drain the extra salt from the plant’s root zone (Inoue Citation2012); utilization of various irrigation techniques (Belkheiri and Mulas Citation2013); and improvement of salt tolerance in plants (Hichri et al. Citation2017; Shams et al. Citation2019). However, due to their high cost and labor requirements, these approaches can be inefficient in overcoming salinization problem. In recent years, the use of organic soil regulators has received attention as a more promising and sustainable approach for enhancing the fertility of salt-affected soils, which ultimately would improve the crop yield.
Biochar is produced by pyrolysis (thermal degradation) of biomass in the absence or limited presence of oxygen (Parkash and Singh Citation2020). The physical and chemical properties of biochar depend on the process conditions of pyrolysis and the type of the raw biomass materials (Qayyum et al. Citation2015). Biomass is commonly derived from different potential sources such as agricultural waste, bioenergy crops, forest residues, kitchen waste, sewage sludge, and animal refuse (Mazac Citation2016). When the biomass is heated to high temperatures, varying between 300°C and 1000°C, it is converted into a predominantly stable and recalcitrant organic carbon (C) compound. When applied to salt-affected soils, biochar improves the physical, chemical and biological properties of soil (Akhtar, Andersen, and Liu Citation2015a; Lu et al. Citation2015). It has been reported that biochar addition to saline soils improves the water holding capacity and reduces the oxidative and osmotic stresses (Laird et al. Citation2010). Additionally, biochar amendment promotes plant growth by increasing organic carbon and nutrient levels (Lu et al. Citation2015), cation exchange capacity (MSK), and hydraulic conductivity (Chintala et al. Citation2014; Akhtar, Andersen, and Liu Citation2015a). Akhtar et al. (Citation2014) found that biochar significantly elevated the chlorophyll contents, stomatal conductance (Gs), photosynthetic rate (Pn), water use efficiency (WUE), and relative water contents (RWC), and stomatal density of drought-stressed tomato leaves. Biochar has a high adsorption capacity, which helps mitigate the detrimental impact of salinity by minimizing the uptake of Na+ (Akhtar, Andersen, and Liu Citation2015a). As a result of this function, less salt accumulates in plant tissues, resulting in a lower electrolyte leakage in treatments amended with biochar in comparison with the control (non-biochar), even under high salinity levels (Lashari et al. Citation2015).
Since Na+ accumulation and K+ nutrition impairments are significant features of salt-stressed plants (Liu and Zhu Citation1997; Shams et al. Citation2020), improving K+ availability is considered an effective approach to optimize K: Na ratio to enhance plant development and yield under salt-stressed conditions (Cakmak Citation2005; Chakraborty, Sairam, and Bhaduri Citation2016). Biochar amendment increases K+ concentration in salt-affected soils, which counters the adverse effects of Na+, thus limits the Na+ absorption of crops and reduces the salinity stress (Drake et al. Citation2016; Usman et al. Citation2016).
Tomato is a crop with high economic value in the world. However, salinity stress due to climate change is negatively affecting tomato production both quantitatively and qualitatively.
The aim of this study was to understand the effects of biochar produced from urban waste on alleviating the damaging effects of salt stress on tomato crops.
2. Materials and methods
The research was established as a pot experiment in a greenhouse at Horticulture Department of Atatürk University, Turkey. Tomato variety ‘H2274’ (Lycopersicon esculentum Mill. Cv. H2274) was used as the plant material. Biochar produced by using the Thermal Conversion Process (TCP™) was obtained from SYNPET Technologies (Istanbul, Turkey).
2.1. Chemical properties of the soil, biochar, and irrigation water
Soil samples were air-dried, crushed, and passed through a 2-mm sieve before chemical analyses. Cation exchange capacity (CEC) was determined by using sodium acetate (buffered at pH 8.2)–ammonium acetate (buffered at pH 7.0) according to Sumner and Miller (Citation1996). The Kjeldahl method (Bremner Citation1996) was used to determine total N, while plant-available phosphorus was determined by using the sodium bicarbonate method of Olsen et al. (Citation1954). Electrical conductivity was measured in saturation extracts according to Rhoades (Citation1996). Soil pH was determined in 1:2 extracts, and calcium carbonate concentrations were determined according to McLean (Citation1982). Soil organic matter was determined using the Smith–Weldon method according to Nelson and Sommers (Citation1982). Ammonium acetate (buffered at pH 7) (Thomas Citation1982) was used to determine exchangeable cations. Microelements in the soils were determined by diethylene triamine pentaacetic acid (DTPA) extraction methods (Lindsay and Norwell Citation1969). The physical and chemical properties of soil are given in .
Table 1. Physical and chemical properties of the starting soil
The biochar production process was composed of three steps that took place in three different reactors: (1) Depolymerization step: The feed composed of 60% sewage sludge and 40% domestic wastes were kept at 150°C under 5–8 bar pressure to separate inorganic and organic polymers. (2) Hydrolysis step: Solid and liquid phases were separated using the reactive feature of water at high temperature (250°C) and pressure (50 bar). The solid phase removed by filtration was concentrated in the evaporator. (3) Cracking step: The concentrated solid intermediate transported to the cracking reactor was broken down into short hydrocarbon chains at high temperature (550°C), from which energy products (renewable natural gas and renewable crude oil) and biochar were obtained.
Biochar samples were oven-dried at 68°C for 48 h prior to analyses. A Rapid Kjeldahl Distillation Unit (Vapodest 10, Gerhardt, Konigswinter, Germany) was used to determine the total nitrogen with the Kjeldahl method (Bremner Citation1996). Macroelements (P, K, Na, Ca, and Mg), and microelements (Fe, Mn, Zn, Cu, Pb, Ni, and Cd) were determined after wet digestion of dried and ground sub-samples in a H2SO4–Se – salicylic acid mixture. In the diluted digests, P was measured spectrophotometrically by the indophenol-blue method after its reaction with ascorbic acid. Potassium, Na, Ca, Mg, Fe, Mn, Zn, Cu, Pb, Ni and Cd analysis were determined by atomic absorption spectrometry (PerkinElmer 3690) (AOAC Citation1990). Properties of biochar are given in .
Table 2. Chemical characteristics of biochar produced from urban wastes
The chemical properties of irrigation water were determined by the methods described by Greenberg et al. (Citation1999), and the results are reported in .
Table 3. Chemical characteristics of the irrigation water
2.2. Treatments
A completely randomized design (CRD) was used. All treatments were performed in triplicate, and 5 pots were used per replicate. Three biochar doses (B-0: sandy loam soil in 3.5-L pots, B-1: 5% (v/v) biochar mixed thoroughly with the sandy loam soil prior to filling into 3.5-L pots, B-2: 10% (v/v) biochar mixed thoroughly with the sandy loam soil prior to filling into 3.5-L pots) were applied under non-saline (S0: control) and saline conditions (S1: 100 mM NaCl (Sodium chloride 99.99 Suprapur®. CAS No. 7647–14-5, EC Number 231–598-3)
2.3. Sowing and salt applications
Tomato seedlings were grown in multi-cell seedling trays (radius and height as 5 cm) under greenhouse conditions. The greenhouse temperature and humidity measured with digital temperature and humidity indicator were about 29.8 ± 3.5°C and 66 ± 5.9%, respectively. Then, seedlings were transferred to the pots when the three-leaf period was reached. Before transplanting seedlings, soil moisture was fixed to 90% of the field capacity, and pots were irrigated twice a week during the study. Salt treatments were applied one week after the seedlings were planted in the pots. The first two irrigations were made with 25 mM and 50 mM NaCl solutions. A 100 mM NaCl solution was used for the rest of the irrigation.
The electrical conductivities (EC) of soils were determined using a portable EC meter (HH2 Moisture Meter, WET Sensor, Delta-T Devices, Cambridge, England). Electrical conductivities of non-saline and saline soils were measured as 1.15 dS m−1 and 5.88 dS m−1, respectively. With biochar application electrical conductivities of saline/non-saline soils were measured as 1.28/4.26 dS m−1 for 5% amendment and as 1.30/3.81 dS m−1 for 10% amendment.
2.4. Analyses of plant samples
2.4.1. Growth parameters
Sixty days after sowing, fifteen plants were harvested from each replication to determine the plant growth parameters including root and shoot fresh weights, root and shoot dry weights, root and shoot lengths and number of leaves per plant at flowering time. Root and shoot dry weights were obtained by oven drying the samples at 70°C for 48 hours. Leaf area was quantified with a leaf area meter (LI-3100, LICOR, Lincoln, NE 68504 USA).
2.4.2. Physiological parameters
Leaf relative water content (LRWC) was determined by the method of Shams et al (Citation2019). Leaf discs (5 discs for each repeat) cut at a diameter of 10 mm were immediately weighed for fresh weight (FW) determination. Then, leaf discs were suspended in ultrapure water at 25°C for 24 hours to determine the turgor weights (TW). Finally, leaf discs were oven-dried at 70°C for 48 h and weighed for dry weight (DW) determination. LRWC (%) was calculated by the following equation (Arora, Pitchay, and Bearce Citation1998):
LRWC (%) = [(FW − DW)/(TW − DW)] × 100.
The amount of chlorophyll was assessed by the method defined by Lichtenthaler and Buschmann (Citation2001). The equations below were used to calculate the amounts of chlorophyll a, chlorophyll b and total chlorophyll in fresh weight (mg g−1):
where V and W refer to the extraction volume and the sample weight, respectively.
2.4.3. Biochemical parameters
Superoxide dismutase (SOD), catalase (CAT), and peroxidase (POD) activities were determined based on the method given by Sahin et al. (Citation2018). Leaf materials (1 mg) were ground in 6 ml of ice-cold 50 mM potassium phosphate buffer solution (pH 7.0) containing 2 mM sodium EDTA and 1% (w/v) polyvinyl–polypirrolidone (PVP). The homogenates were centrifuged at 10,000 × g (4°C) for 10 min. The tissue extracts were either stored at −78°C or immediately used for subsequent analyses of superoxide dismutase and catalase. For the quantification of soluble protein content, coomassie blue dye binding assay was used. Bovine serum albumin (BSA) was used for the preparation of the standard curve. Superoxide dismutase activity was determined by measuring its ability to inhibit the photochemical reduction of nitro-blue tetrazolium (NBT) in the presence of riboflavin in light. One unit of enzyme activity was determined as the amount of the enzyme needed for the inhibition of 50% NBT reduction rate by monitoring absorbance at 560 nm with spectrophotometer. For assaying CAT activity, the decomposition of H2O2 was followed by the decline in the absorbance at 240 nm.
Proline contents were determined according to the slightly modified method of Bates, Waldren, and Teare (Citation1973). Proline extension in leaf samples was obtained by adding 2 ml of 40% methanol to 0.1 g of fresh leaf sample. The 1 mL homogenate was mixed with 1 mL orthophosphoric acid (6 M): glacial acetic acid (2:3, v/v) mixture and 25 mg of ninhydrin. After being held at 100°C, for 1 h, the tubes were chilled and then mixed thoroughly with a vortex by adding 5 mL toluene. The absorbance of the supernatant was spectrophotometrically determined at 528 nm. The proline concentration (mmol kg−1 fresh weight) was determined using a standard curve.
The amount of H2O2 was quantified as described by Loreto and Velikova (Citation2001). Briefly, leaf samples (0.3 g) were homogenized in 3 ml of 1% (w/v) trichloroacetic acid (TCA) solution. The homogenates were centrifuged at 10,000 × g (4°C) for 10 min. Subsequently, 0.75 ml of the supernatant was added to 0.75 ml of 10 mM potassium phosphate buffer solution (pH 7.0) and 1.5 ml of 1 M potassium iodide (KI) solution. H2O2 concentration (mmol kg−1 fresh weight) of the supernatant was determined from its absorbance value at 390 nm using a calibration curve constructed in the range of 10 to 200 nmol.
Thiobarbituric acid-reactive substances were determined by measuring malondialdehyde (MDA) content following the method signified by Heath and Packer (Citation1968). The concentration of MDA was determined from the absorbance curve by using an extinction coefficient of 155 mM−1 cm−1.
2.4.4. Statistical analysis
The data obtained were analyzed by using SPSS 25 (IBM, NY, USA). A two-way MANOVA was performed to test the main effects of salinity and biochar, as well as their interactions on the growth and physiological parameters. Property means were separated using Duncan’s multiple-range test at the 0.05 level of significance, and significant differences were indicated by different letters. The principal component analysis (PCA) method (BioVinci 3.0.8) was applied to evaluate the relationships between salt stress and biochar applications.
3. Results
3.1. Morphological parameters of tomato
Salt (NaCl) considerably suppressed all measured morphological parameters in this study. However, when biochar was applied to the soil, the adverse effects of salinity on morphological characteristics were reduced ().
Table 4. Effects of biochar application on the growth parameters and the physiological parameters of tomato plants grown under salt-stress and non-stress conditions
Plant height was significantly affected by salinity (p ≤ 0.001) and biochar (p ≤ 0.001) application (). There was no interaction between salt and biochar applications in terms of the plant height of tomato seedlings. Saline water irrigation without biochar addition (BC0-S1) significantly (p ≤ 0.05) reduced the plant height (by 25.8%) when compared to the control (BC0-S0) (). Biochar applications at both rates, with and without salt stress, resulted in improved plant height. Under saline/non-saline water irrigation, application of 5% biochar (BC-1) and 10% biochar (BC-2) increased the plant height by 43.1%, 38.6% and by 35.8%, 31.9%, respectively, when compared to the unamended samples. But increasing biochar concentration from 5% to 10% did not significantly affect the plant height neither at saline nor at non-saline conditions ().
The shoot fresh and dry weights were significantly affected by salinity (p ≤ 0.001), biochar (p ≤ 0.001), and the salinity × biochar interaction (p ≤ 0.001) (). The shoot fresh and dry weights of the plants irrigated with saline water (BC0-S1) decreased by 16.6% and 19.6%, respectively, compared to the shoot fresh and dry weights of the control group (BC0-S0) (). On the other hand, biochar application at both levels predominantly increased the shoot fresh and dry weights under both salt-stress and non-stress conditions. Shoot fresh weights of saline water irrigated plants increased by 91% with BC-1 (5%) and 113.7% with BC-2 (10%) treatments as compared to the samples where no biochar was applied (BC0-S1). Similarly, BC1 and BC2 biochar treatments increased shoot dry weights of saline irrigated plants by 74.8% and 65.4%, respectively ().
The number of leaves per plant was significantly affected by salinity (p ≤ 0.001) and biochar (p ≤ 0.001) (). However, no significant interaction was found between salt and biochar treatments affecting the leaf number of tomato seedlings. Salinity stress caused a significant reduction (13%) in the number of leaves per plant in unamended control (BC0-S1), compared to non-saline and unamended control (BC0-S0) (). Biochar amendments (BC1 and BC2) increased the number of leaves per plant of tomato seedlings in both saline and non-saline irrigation conditions. The number of leaves increased by 13.6% at 5% biochar dose (BC1) and 23.7% at 10% biochar dose (BC2) under non-stressed conditions. In irrigation with saline water, the application of 5% biochar (BC1) and 10% biochar (BC2) resulted in 23.4% and 24.9% increase in the number of leaves, respectively. However, statistical analysis showed that biochar was equally effective in ameliorating the effect of saline water irrigation on the number of tomato leaves under salt stress conditions (BC1/S-1 and BC-2/S-1). On the other hand, the highest number of leaves (9.30 per plant) was obtained with 10% biochar (BC2) application under saline irrigation conditions ().
Leaf area was significantly affected by salinity (p ≤ 0.001), biochar (p ≤ 0.001), and the salinity × biochar interaction (p ≤ 0.001) (). Without salt stress, leaf areas increased by 84.2% and 82.4% when biochar was applied at 5% and 10% levels, respectively. On the other hand, salt stress significantly reduced the leaf area. Nevertheless, under salt stress, biochar application increased leaf area by 45.3% at the 5% level (BC1-S1) and by 39.1% at 10% level (BC2-S1). However, the difference between the biochar application levels was not statistically significant. Thus, 5% biochar dose (BC1) was effective enough (597 cm2) to alleviate the adverse effects of salinity on leaf area.
Root fresh and dry weights of the tomato were significantly affected by salinity (p ≤ 0.001), biochar (p ≤ 0.001), and the salinity × biochar interaction (p ≤ 0.001) (). A noticeable reduction was observed in root fresh and dry weights of the tomato seedlings in salt-stressed conditions. Saline water irrigation caused a 22.0% decrease in root fresh weight and a 36.0% decrease in root dry weight compared to the non-saline and unamended control (BC0-S0) (). Under non-stressed conditions, biochar addition at 5% and 10% levels increased root fresh weight by 151.3% and 112.9%, respectively. On the other hand, under salt-stressed conditions, root dry weight was increased 88.0% and 60.0%, when 5% and 10% biochar were applied, respectively. While the highest root fresh weight and root dry weight were 5.83 g and 0.47 g for 5% biochar application (BC1) in unsalted conditions, the highest root fresh weight and root dry weight were 3.90 g and 0.26 g for 10% biochar amendment (BC2) in saline conditions. In the light of these results, it can be concluded that in terms of fresh and dry root weights, under non-saline conditions, 5% biochar amendment, and under saline conditions, 10% biochar amendment cause a significant difference.
3.2. Physiological parameters of tomato
Physiological properties investigated (the leaf relative water content (LWRC), chlorophyll a, b, and total chlorophyll content) were statistically affected by salt stress. The application of saline irrigation significantly decreased the leaf relative water content (LRWC) and total chlorophyll content of the plants in the unamended (without biochar) group. On the other hand, the chlorophyll a and b contents of plants in the same group (without biochar) did not change significantly with salt stress. Biochar treatments were more effective in the physiological properties of plants in salty conditions rather than unsalted conditions (,).
The leaf relative water content (LRWC) of the tomato was significantly affected by salinity (p ≤ 0.001), biochar (p ≤ 0.01), and the salinity × biochar interaction (p ≤ 0.001) (). The leaf relative water content (LRWC) was significantly decreased under saline water irrigation. Salt stress caused a reduction of 30.9% in LRWC compared to the non-saline conditions in the unamended groups. Biochar amendment effectively ameliorated this effect and increased the LRWC in both salt-free and stressed settings. Under salt-free conditions, while 5% biochar (BC1) showed no significant effect on LRWC when compared to the control (BC0), 10% biochar application resulted in an 11.6% increase in LRWC when compared to the control (BC0). Under salt stress, biochar addition at both levels (5 and 10%) efficiently increased the LRWC by 45.2% and 39.1%, respectively, compared to the salt-stressed plants with no application of biochar ().
The chlorophyll a, b, and total chlorophyll contents were significantly affected by salinity (p ≤ 0.001), biochar (p ≤ 0.01), and the salinity × biochar interaction (p ≤ 0.001) (). Salt stress significantly decreased the total chlorophyll content in plants without biochar, but did not cause a statistically significant difference in chlorophyll a and b content (). Salt stress caused a 12.9% reduction in chlorophyll a content in plants without biochar application (BC0). On the other hand, under salt stress, 5% (BC1) biochar application significantly increased the chlorophyll a content (by 19.6%). In addition, chlorophyll a content was not affected by biochar application under non-stressed conditions (). A non-significant reduction of 4.8% was noted in the chlorophyll b content under salt stress. Biochar amendment in salt-free conditions increased the chlorophyll b content by 57.6% and 97% at 5% (BC1) and 10% (BC2) biochar levels, respectively. Under saline-water irrigation, the increase in chlorophyll b content was 26.9% at 5% (BC1) biochar level and 67.3% at 10% (BC2) biochar level (). Salt stress triggered a 6.8% decrease in total chlorophyll content when compared to the control. Biochar application at 5% and 10% doses under normal conditions resulted in 13.6% and 25.2% increase in total chlorophyll content, respectively. Whereas, in the salt-stressed plants with biochar amendment, increases in total chlorophyll content were 21.9% and 22.25% for 5% and 10% biochar applications, respectively (). When the interaction effect is considered, the most effective results in terms of total chlorophyll content in salt-free conditions were obtained from the BC2-S0 application. However, the effect of biochar doses on total chlorophyll content was the same in saline conditions.
3.3. Biochemical parameters of tomato
Salinity was found to have a significant effect on the SOD, CAT, POD activities, and proline, H2O2, and MDA contents (). Our results showed that biochar amendments alleviated the negative effects of salt stress on biochemical properties in tomato seedlings ().
Figure 1. Effects of biochar application on SOD, CAT, POD activities and proline, H2O2, MDA contents of tomato with and without salt stress. Bars with the same letter do not differ at p ? 0.05 level (Duncan’s multiple range test). Summary of two-way MANOVA for effects of salinity (S), biochar (BC), and their interaction: *Significant at p < 0.05; **Significant at p < 0.01; ***Significant at p ? 0.001; NS: nonsignificant.
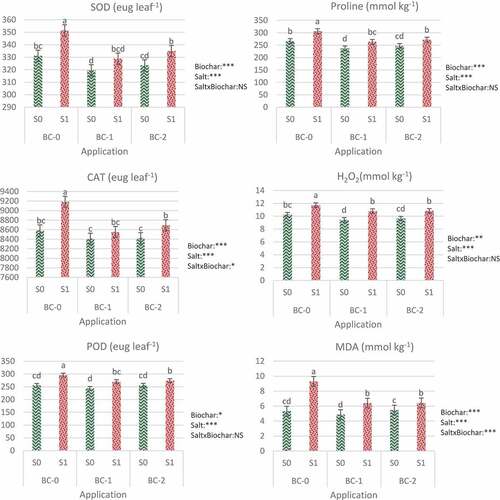
The superoxide dismutase (SOD) activity was found to be significantly affected by salinity (p ≤ 0.001) and biochar (p ≤ 0.001). The interaction effect was not observed (). Saline water irrigation increased the SOD activity by 6.1% compared to the control (BC0-S0). Biochar amendment at both rates significantly decreased the SOD activity at both stress and non-stress conditions; however, the effect was more obvious under salinity stress. Biochar application at 5% and 10% doses to the salt-free pots decreased the SOD by 3.5% and 2.35%, respectively. Under salt stress, 5% biochar amendment resulted in 6.4% reduction in SOD activity, while 10% biochar application showed a reduction of 4.7% (). As a result, 5% biochar was more effective in both saline and non-saline conditions.
As it can be seen in , catalase (CAT) activity was significantly affected by salinity (p ≤ 0.001), biochar (p ≤ 0.001), and the salinity × biochar interaction (p ≤ 0.05). Saline irrigation resulted in 7% increase in the CAT activity relative to the control (BC0-S0). Addition of biochar at both rates (5%, 10%) to salt-free pots significantly reduced CAT activity by 2% and 1.9%, respectively. Biochar amendments were also proved effective in lowering the CAT activity under salt stress conditions. In the salt environment, 5% biochar lowered the CAT activity by 6.9%, while a 5.3% reduction was noted with 10% biochar application (). The results showed that 5% (BC1) biochar application was more effective in reducing CAT activity under both irrigation conditions (saline and non-saline).
The peroxidase (POD) activity was significantly affected by salinity (p ≤ 0.001) and biochar (p ≤ 0.05), while the interaction was found to be insignificant (). A significant increase in the activity of peroxidase enzyme was observed in the plants grown under salt stress. The activity of peroxidase (POD) was substantially higher (21%) in salt treatment compared to the control (BC0-S0). The addition of biochar significantly lowered the POD activity both in normal and salt-stressed plants. Without stress, 5% (BC1) and 10% (BC2) biochar levels reduced the POD activity by 4.7% and 5.1% compared to their respective control (BC0-S0). Under salt stress, biochar applications resulted in 8.6% and 7.3% reduction, respectively, in POD activity at 5% (BC1) and 10% (BC2) levels, compared to biochar control (BC0-S1) (). Our results showed that 10% (BC2) biochar dose was more effective in reducing POD activity.
The proline content was significantly affected by salinity (p ≤ 0.001) and biochar (p ≤ 0.001) (). Results showed a significant increase (24.3%) in the proline content of tomato plants grown in stress conditions, as compared to the control (BC0-S0). Biochar amendments under non-stress conditions decreased the proline content by 3.9% at 5% (BC1) biochar level and 0.12% at 10% (BC2) biochar level when compared to their respective control (BC0-S0). However, the effect was more pronounced in a saline environment where biochar efficiently reduced the release of proline by ameliorating salt stress. Biochar application at 5% (BC1) level caused a 14% decrease, whereas application at 10% (BC2) level resulted in an 11% reduction in proline content under salinity stress. Five percent biochar application (BC1) was found to be more efficient in lowering the proline content at both normal and stressed conditions ().
As can be seen in , the formation of hydrogen peroxide (H2O2) in tomatoes was significantly affected by salinity (p ≤ 0.001) and biochar (p ≤ 0.01). Interaction between applications (salt x biochar) did not affect the change in H2O2 content. Our results showed that under salt stress, the formation of H2O2 significantly increased (up to 14.7%) with respect to the control (BC0-S0). Biochar application successfully decreased the H2O2 formation in both normal and saline settings. Under non-stress conditions, biochar application at 5% (BC1) and 10% (BC2) doses reduced H2O2 by 5.95% and 7.8%, respectively, compared to those non-amended (BC0-S1). Under salt stress, hydrogen peroxide formation decreased at similar rates when biochar was applied (7.9% and 7.7% at 5% and 10% biochar rates, respectively) (). In the reduction of hydrogen peroxide, 10% (BC2) biochar dose was more effective in salt-free irrigation conditions, while no significant difference was observed between biochar doses in saline irrigation conditions.
The MDA content was significantly affected by salinity (p ≤ 0.001), biochar (p ≤ 0.001), and the salinity × biochar interaction (p ≤ 0.001) (). We have found that there was a significant difference in MDA content under salt stress. The addition of salt increased the MDA content in tomato seedlings by 36.6%, compared to the control (BC0-S0). Biochar application, as expected, significantly lowered the MDA content for both doses under normal and stressed conditions. The effect was more pronounced with 5% (BC1) biochar application. In a salt-free environment, the content of MDA declined by up to 4.9% and 5.5% with the addition of 5% (BC1) and 10% (BC2) biochar, respectively as compared with non-amended control (BC0-S0). Whereas biochar applied to salt-stressed plants lowered the MDA content by 31.2% and 30.9% for 5% and 10% biochar amendment, respectively. The difference between biochar doses was not significant in terms of MDA content under salt stress conditions ().
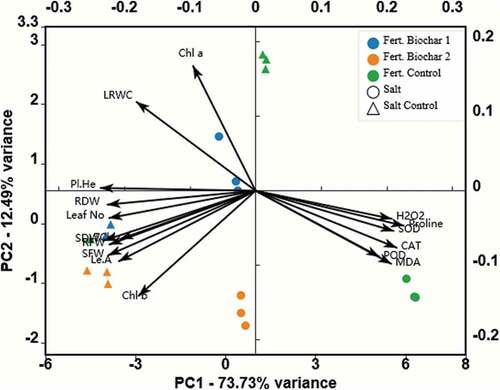
3.4. Principal Component Analysis (PCA)
The PCA analysis of the parameters showed that the treatments were separated into distinct clusters. The first principal component PC1 explained 73.73% of the variation, whereas the second principal component PC2 explained only 12.49% of the variation ().
Figure 2. Biplot representation of principal component analysis (PCA) showing the effect of biochar application on tomato plants grown under salt-stress and non-stress conditions. Pl.He: Plant height; SFW: Shoot fresh weight; SDW: Shoot dry weight; Leaf no: Number of leaves; Le.A: Leaf area; RFW: Root fresh weight; RDW: Root dry weight; LRWC: Leaf relative water content; Chla: Chlorophyll a; Chlb: Chlorophyll b; TChl: Total Chlorophyll; H2O2: Hydrogen peroxide; CAT: Catalase; POD: peroxidase; MDA: Malondialdehyde. (Salt Control: Non-saline water, Salt: 100 mM (NaCl), Fert. Control: Sandy loam soil in 3.5-L pots, Fert. Biochar-1: 5% biochar mixed thoroughly with the sandy loam soil prior to filling into 3.5-L pots, Fert. Biochar −2: 10% biochar mixed thoroughly with the sandy loam soil prior to filling into 3.5-L pots.).
4. Discussion
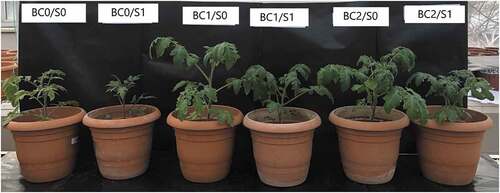
Salt stress is one of the main adverse environmental factors restraining plant production worldwide. Salinity is known to reduce the productivity of many agricultural crops, including most vegetables. The USDA report stated that tomato is moderately sensitive to salinity relative to all other vegetables. Most commercial tomato varieties are sensitive to moderate salinity up to 2.5 dSm−1 (Singh, Sastry, and Singh Citation2012). There are a great number of literatures showing the harmful effects of salinity on the morphological, physiological, and biochemical properties of tomatoes (Maggio et al. Citation2004; Li Citation2009; Gumi et al. Citation2013; Giannakoula and Ilias Citation2013; Manan et al. Citation2016; Bacha et al. Citation2017; Alzahib et al. Citation2021). Biochar, which is an organic fertilizer with activated carbon, can be used as a soil conditioner in saline soils (Lehmann and Joseph Citation2009). Recently, there has been increased interest in biochar as a soil amendment to reduce the harmful effects of salinity stress. There are many reports investigated the role of biochar in the redress of salinity soils (de Vasconcelos Citation2020; Parkash and Singh Citation2020; Karabay et al. Citation2021). Thomas et al. (Citation2013) have reported that adding biochar to the soil can reduce or even eliminate the negative effects of salinity on plant performance. The findings of our study showed that biochar amendment might be a promising way of alleviating the adverse effects of salt stress on tomato seedlings ().
Figure 3. The effect of biochar applications on the growth of tomato plants grown under salt-stress and non-stress conditions. S-0: Non-saline water (as a control), S-1: 100 mM (NaCl), BC-0: Sandy loam soil in 3.5-L pots, BC-1: 5% biochar mixed thoroughly with the sandy loam soil prior to filling into 3.5-L pots, BC-2: 10% biochar mixed thoroughly with the sandy loam soil prior to filling into 3.5-L pots.
4.1. Morphological parameters
Salt stress interrupts plant development primarily because of osmotic stress and specific ion toxicity (Munns and Tester Citation2008), as well as by causing a nutritional imbalance (Chinnusamy, Jagendorf, and Zhu Citation2005; Munns and Tester Citation2008). A significant decrease in the morphological features of tomato plants was observed when seedlings were irrigated with saline water. Under salt stress, plant height, shoot fresh and dry weights, number of leaves, leaf area, root fresh, and dry weights were reduced by 25.8%, 16.6%, 19.6%, 13.0%, 13.3%, 22.0%, and 36.0%, respectively. These results are consistent with the conclusions of Akhtar, Andersen, and Liu (Citation2015a), Usman et al. (Citation2016), Rahman et al. (Citation2018), Tanveer et al. (Citation2019), Akhtar et al. (Citation2015b). The major effect of salinity is that it leads to a decrease in biomass production by reducing carbon inputs. Being a carbon-rich material developed from the combustion of biomass, biochar application increases the carbon inputs, which decreases the adverse effects of salt stress on plants (Ali et al. Citation2017). Application of biochar at both doses resulted in improved vegetative growth both under saline and regular water irrigation. Under normal irrigation conditions, 5% (BC1) biochar dose triggered more increase in plant height and root fresh and dry weights of tomato seedlings; while the 10% (BC2) biochar dose triggered more increase in plant fresh and dry weights, number of leaves and leaf area. On the other hand, 5% (BC1) biochar dose was more effective at plant height and leaf area in relieving the effect of salt stress, while the effect of 10% (BC2) biochar dose on plant fresh and dry weights, number of leaves, root fresh and dry weights were more pronounced. However, this difference between the effects of biochar doses on morphological characteristics in salt stress conditions was not statistically significant, except for plant height and plant fresh weight. Corroborating the results in this study, Usman et al. (Citation2016) observed a noteworthy increase in the vegetative parameters of tomato crop under saline irrigation water regimes with the application of biochar amendments. Similarly, the results of the study conducted by Hansen et al. (Citation2016) also confirmed enhanced plant growth with biochar addition. Kim et al. (Citation2016) reported that 5% biochar dose significantly increased plant dry weight of corn grown in saline soil. In addition, Parkash and Singh (Citation2020) found that 5% biochar application by weight improved the yield and growth characters of eggplant grown under salinity. Jeffery et al. (Citation2011) and Liu et al. (Citation2013) also reported that biochar application stimulates plant growth and increases the demand for nutrients and water. Improvement in plant performance due to biochar application could be explained by the fact that biochar increases soil porosity and reduces the bulk density, thus making the conditions favorable for improved growth and root proliferation in saline environments. Plants treated with biochar tend to distribute the root profile more efficiently to absorb soil water and nutrients rather than accumulating root biomass (Xiang et al. Citation2017). Under saline irrigation, biochar amendment, because of its Na+ adsorbing potential, mitigates the suppressive effect of salinity on the plant growth parameters (Novak, Lima, and Xing Citation2009; Chaganti, Crohn, and Šimůnek Citation2015; Akhtar, Andersen, and Liu Citation2015a; Akhtar et al. Citation2015b). Our results on electrical conductivity (EC) showed that EC of soil increased under regular irrigation and decreased under saline irrigation when biochar was applied. This result suggests that owing to its high adsorption capacity, biochar can bind to Na+ ions, which results in a reduction of sodium uptake by the roots of tomato seedlings. Biochar is also acknowledged for its ability to modify soil physicochemical properties (Lehmann et al. Citation2011) and the rhizosphere zone, which improve the morphological and physiological characteristics of roots, thus increasing the overall plant performance (Zhang et al. Citation2013; Abrishamkesh et al. Citation2015). It has been reported by Thomas et al. (Citation2013) that under saline conditions, biochar application did not affect soil pH but increased soil EC as compared to the control. However, more data is needed to understand the impacts of biochar on saline soil properties (Thomas et al. Citation2013; Ali et al. Citation2017).
4.2. Physiological parameters
Salt stress suppresses the physiological processes taking place in tomato (Rivero et al. Citation2014; Manan et al. Citation2016). Salinity predominantly decreases the leaf relative water content and chlorophyll contents (chlorophyll a, chlorophyll b, and total chlorophyll) (Manan et al. Citation2016). Plants handle salt stress by decreasing tissue water content which may be achieved by low leaf water potential (Polash et al. Citation2018). As expected, we observed a significant decrease in leaf relative water content (LRWC), chlorophyll a, and total chlorophyll contents of the tomato (30.9%, 12.9%, and 4.8%, respectively) under salt stress. Similar results have also been reported earlier by Munns and Tester (Citation2008), Qin et al. (Citation2010), Akhtar et al. (Citation2015b), Kanwal et al. (Citation2018) and Polash et al. (Citation2018). The low LRWC of leaves is an indication of less water uptake capacity. Therefore, plant water content is directly affected by soil salinity and drought (Zhu Citation2001). Biochar has been reported to have the potential to improve the water holding capacity of soil, thus increasing plant relative water content (Uzoma et al. Citation2011; Shashi et al. Citation2018). Biochar usage in our study efficiently increased the LRWC under saline-water irrigation. While the dose of 10% biochar was more effective under salty conditions in improving LWRC, which decreased with salinity, 5% biochar was more effective under normal conditions. These findings correlate with those of Akhtar, Andersen, and Liu (Citation2015a), where biochar application under salt stress resulted in increased leaf water potential and water use efficiency in potato plants. In another study, it has been reported that there was a significant increase in relative water content (RWC) and water use efficiency (WUE) by 5% biochar amendment in tomato grown under limited irrigation conditions (Akhtar et al. Citation2014).
Salt stress causes chlorosis and early leaf senescence by damaging the active photosynthetic mechanism in leaves (Hanin et al. Citation2016). The decreased chlorophyll content as a result of salinity was related to the increased activity of chlorophyllase enzyme caused by salt stress (Reddy and Vora Citation1986) and limited N uptake (Van Hoorn et al. Citation2001). Another possible reason for the decrease in chlorophyll levels might be that the osmotic stress causes a major harm to chloroplast layers by increasing the membrane penetrability or contributing to the loss of membrane uprightness (Tang et al. Citation2015). Our results showed that chlorophyll content decreased due to salinity and biochar applications significantly increased the chlorophyll content in salt-stressed conditions. These findings correlate with the study of Kanwal et al. (Citation2018) where biochar addition resulted in increased chlorophyll content under salt stress. Similarly, a study by Karabay et al. (Citation2021) reported that saline irrigation significantly reduced the total leaf chlorophyll and carotenoid content of beans, and biochar amendments (5 t ha−1 and 15 t ha−1) mitigated these negative effects. Akhtar, Andersen, and Liu (Citation2015c) also stated that the biochar amendment resulted in a significant increase in chlorophyll content at different salt concentrations. According to Akhtar, Andersen, and Liu (Citation2015c), the application of biochar elevates the photosynthesis rate, which is an indication of increased chlorophyll content.
4.3. Biochemical parameters
Salinity stress leads to the suppression of biochemical processes in plants (Khan Citation2016). The high concentration of NaCl, the dominant salt in the soil, creates osmotic stress and ionic stress, reducing the water and mineral uptake ability of plants (Singh, Sastry, and Singh Citation2012). In addition, salt stress, like other abiotic stresses, leads to oxidative stress, which results in an increase in reactive oxygen species (ROS) (Hasanuzzaman et al. Citation2012; You and Chan Citation2015). Accumulation of ROS, which is a major cause of the decrease in crop productivity, affects many cellular functions by reacting with nucleic acids, proteins, and lipids (Foyer and Noctor Citation2005). Antioxidative enzymes are parts of efficient systems for scavenging ROS and protect plants from destructive oxidative reactions (Sharma et al. Citation2012). These enzymatic antioxidant systems composed of superoxide dismutase (SOD), ascorbate peroxidase (APX), peroxidase (POD), and catalase (CAT) neutralize stress-induced ROS accumulation (Ss and Tuteja Citation2010; Sharma et al. Citation2012; Caverzan, Casassola, and Brammer Citation2016). In our study, irrigation with NaCl caused an increase in SOD, CAT, and POD activities of tomato by 6.1%, 7%, and 21%, respectively, and antioxidant enzyme activity decreased through biochar amendments. In accordance with these results, Manan et al. (Citation2016) also reported that NaCl applications increased proline content and antioxidant enzyme activity in tomatoes. Moreover, organic amendments were found to alleviate the negative effects of salt stress by regulating the synthesis of antioxidant enzymes in plants (Tartoura et al. Citation2014). Similarly, Kim et al. (Citation2016) reported that antioxidant enzyme activities in maize, which increased under salt stress, have been decreased by the biochar amendments, compared to the control (without biochar). Another study showed that in bean seedlings under salt stress, biochar reduced the antioxidant enzyme activity and oxidative stress, relative to control (Farhangi-Abriz and Torabian Citation2017). Proline is one of the most common osmolytes produced in plants under salt stress, and this low molecular weight osmolyte helps plants overcome osmotic stress (Jogawat Citation2019). Osmolytes such as proline play an important role in osmotic adjustment and also guard cells by scavenging ROS (Pinheiro et al. Citation2001). The results of our study revealed that the tomato proline content, which increased with salt stress, could be reduced by both biochar amendments. ROS synthesis and accumulation reach high levels under oxidative stress conditions and aggressively damage cellular membranes and organic molecules. Reactive oxygen species such as hydrogen peroxide (H2O2) are usually produced in large quantities by plants as a response to various stress conditions. On the other hand, increased lipid peroxidation in terms of MDA (malondialdehyde) accumulation is shown as an index of oxidative damage caused by ROS (Anjum et al. Citation2017). Our results showed that biochar amendments mitigated oxidative stress levels on tomato plants, at both biochar doses, by inhibiting H2O2 production under salinity stress. In addition, the rise in MDA content triggered by ROS, increased by salt stress, was remarkable in our study. Farhangi-Abriz and Torabian (Citation2017) also reported that the content of H2O2 and MDA in beans increased remarkably by saline irrigation, whereas this increase was blocked considerably by biochar addition to the soil at 20% level (as mass).
4.4. Principal Component Analysis (PCA)
Principal Component Analysis (PCA) is a technique used for converting larger data sets into unrelated variables known as principal components (PC) by reducing their dimensionality. This method is widely used to uncover the effects of different independent applications on plants (Plaimart et al. Citation2021). In our study, all plant growth parameters were on the left side of the plot along the PC1 direction, whereas all biochemical parameters were on the right side of the plot along the PC1 direction, which means there is an opposite relationship between the left and right treatments in terms of these parameters. A significant plant parameter difference between biochar treatments and non-biochar treatments, as well as between salt-stressed and non-stressed treatments, was observed.
5. Conclusion
In conclusion, the use of urban waste biochar positively affected the growth and physiological parameters, thereby alleviate the adverse effects of salt stress on tomato seedlings. Biochar amendment into soil enhanced the tolerance of tomato seedlings against the salinity stress and improved the growth of tomato seedlings under salinity stress conditions by increasing the chlorophyll content and leaf relative water content. These favorable responses of biochar on reducing the effect of salinity were greater in the 10% biochar as compared to those in the 5% biochar. However, biochar application at both levels was proved to be efficient in improving overall plant performance under non-saline and saline-water irrigation. In conclusion, our results showed that biochar added to the soil under saline conditions alleviated the negative effects of salinity in tomato seedlings by improving the plant growth and adjusting some physiological and biochemical mechanisms.
Acknowledgments
We would like to thank SYNPET Technologies (Istanbul, Turkey) for providing the biochar used in this study.
Disclosure statement
No potential conflict of interest was reported by the author(s).
References
- Abrishamkesh, S., M. Gorji, H. Asadi, G. H. Bagheri-Marandi, and A. A. Pourbabaee. 2015. “Effects of Rice Husk Biochar Application on the Properties of Alkaline Soil and Lentil Growth.” Plant, Soil and Environment 61 (11): 475–482. doi:10.17221/117/2015-PSE.
- Akhtar, S. S., G. Li, M. N. Andersen, and F. Liu. 2014. “Biochar Enhances Yield and Quality of Tomato under Reduced Irrigation.” Agricultural Water Management 138: 37–44. doi:10.1016/j.agwat.2014.02.016.
- Akhtar, S. S., M. N. Andersen, and F. Liu. 2015a. “Biochar Mitigates Salinity Stress in Potato.” Journal of Agronomy and Crop Science 201: 368–378. doi:10.1111/jac.12132.
- Akhtar, S. S., M. N. Andersen, and F. Liu. 2015c. “Residual Effects of Biochar on Improving Growth, Physiology and Yield of Wheat under Salt Stress.” Agricultural Water Management 158: 61–68. doi:10.1016/j.agwat.2015.04.010.
- Akhtar, S. S., M. N. Andersen, M. Naveed, Z. A. Zahir, and F. Liu. 2015b. “Interactive Effect of Biochar and Plant Growth-promoting Bacterial Endophytes on Ameliorating Salinity Stress in Maize.” Functional Plant Biology 42 (8): 770–778. doi:10.1071/FP15054.
- Ali, S., M. Rizwan, M. F. Qayyum, Y. S. Ok, M. Ibrahim, M. Riaz, M. S. Arif, F. Hafeez, M. I. Al-Wabel, and A. N. Shahzad. 2017. “Biochar Soil Amendment on Alleviation of Drought and Salt Stress in Plants: A Critical Review.” Environmental Science and Pollution Research 24 (14): 12700–12712. doi:10.1007/s11356-017-8904-x.
- Alzahib, R. H., H. M. Migdadi, A. A. Al Ghamdi, M. S. Alwahibi, A. A. Ibrahim, and W. A. Al-Selwey. 2021. “Assessment of Morpho-physiological, Biochemical and Antioxidant Responses of Tomato Landraces to Salinity Stress.” Plants 10 (4): 696. doi:10.3390/plants10040696.
- Anjum, S. A., U. Ashraf, M. Tanveer, I. Khan, S. Hussain, A. Zohaib, F. Abbas, M. F. Saleem, and L. Wang. 2017. “Drought Tolerance in Three Maize Cultivars Is Related to Differential Osmolyte Accumulation, Antioxidant Defense System, and Oxidative Damage.” Front Plant Science 8: 1–12. doi:10.3389/fpls.2017.00069.
- AOAC. 1990. Official Methods of Analysis. 15th ed. Arlington, VA: Association of Official Analytical Chemists-International.
- Arora, R., D. S. Pitchay, and B. C. Bearce. 1998. “Water-stress Induced Heat Tolerance in Geranium Leaf Tissues: A Possible Linkage through Stress Proteins?” Physiologia Plantarum 103 (1): 24–34. doi:10.1034/j.1399-3054.1998.1030104.x.
- Bacha, H., M. Tekaya, S. Drine, F. Guasmi, L. Touil, H. Enneb, F. Triki, A. Cheour, and A. Ferchichi. 2017. “Impact of Salt Stress on Morpho-physiological and Biochemical Parameters of Solanum Lycopersicum Cv.” Microtom Leaves. South African Journal of Botany 108: 364–369. doi:10.1016/j.sajb.2016.08.018.
- Bates, L., R. P. Waldren, and I. D. Teare. 1973. “Rapid Determination of Free Proline for Water Stress Studies.” Plant and Soil 39 (1): 205–207. doi:10.1007/BF00018060.
- Belkheiri, O., and M. Mulas. 2013. “The Effects of Salt Stress on Growth, Water Relations and Ion Accumulation in Two Halophyte Atriplex Species.” Environmental and Experimental Botany 86: 17–28. doi:10.1016/j.envexpbot.2011.07.001.
- Bremner, J. M. 1996. “Nitrogen-Total.” In Methods of Soil Analysis, Part 3, Chemical Methods. SSSA Book Set: 5, edited by D. L. Sparks, 1085–1121. Madison, WI: Soil Science Society of America.
- Cakmak, I. 2005. “The Role of Potassium in Alleviating Detrimental Effects of Abiotic Stresses in Plants.” Journal of Plant Nutrition and Soil Science 168 (4): 521–530. doi:10.1002/jpln.200420485.
- Caverzan, A., A. Casassola, and S. P. Brammer. 2016. “Reactive Oxygen Species and Antioxidant Enzymes Involved in Plant Tolerance to Stress.” In Abiotic and Biotic Stress in Plants-recent Advances and Future Perspectives, edited by A. K. Shanker and C. Shanker, 463–480. London: Publisher InTech.
- Chaganti, V. N., D. M. Crohn, and J. Šimůnek. 2015. “Leaching and Reclamation of a Biochar and Compost Amended Saline–sodic Soil with Moderate SAR Reclaimed Water.” Agricultural Water Management 158: 255–265. doi:10.1016/j.agwat.2015.05.016.
- Chakraborty, K., R. K. Sairam, and D. Bhaduri. 2016. “Effects of Different Levels of Soil Salinity on Yield Attributes, Accumulation of Nitrogen, and Micronutrients in Brassica Spp.” Journal of Plant Nutrition 39 (7): 1026–1037. doi:10.1080/01904167.2015.1109105.
- Chinnusamy, V., A. Jagendorf, and J. K. Zhu. 2005. “Understanding and Improving Salt Tolerance in Plants.” Crop Science 45 (2): 437–448. doi:10.2135/cropsci2005.0437.
- Chintala, R., J. Mollinedo, T. E. Schumacher, D. D. Malo, and J. L. Julson. 2014. “Effect of Biochar on Chemical Properties of Acidic Soil.” Archives of Agronomy and Soil Science 60 (3): 393–404. doi:10.1080/03650340.2013.789870.
- de Vasconcelos, A. C. F. 2020. “Biochar Effects on Amelioration of Adverse Salinity Effects in Soils.” In Applications of Biochar for Environmental Safety, edited by A. Abdelhafez, and M. Abbas, 193. London, UK: IntechOpen. June 16th 2020. https://www.intechopen.com/chapters/72499
- Drake, J. A., T. R. Cavagnaro, S. C. Cunningham, W. R. Jackson, and A. F. Patti. 2016. “Does Biochar Improve Establishment of Tree Seedlings in Saline Sodic Soils?” Land Degradation & Development 27 (1): 52–59. doi:10.1002/ldr.2374.
- Farhangi-Abriz, S., and S. Torabian. 2017. “Antioxidant Enzyme and Osmotic Adjustment Changes in Bean Seedlings as Affected by Biochar under Salt Stress.” Ecotoxicology and Environmental Safety 137: 64–70. doi:10.1016/j.ecoenv.2016.11.029.
- Foyer, C. H., and G. Noctor. 2005. “Redox Homeostasis and Antioxidant Signaling: A Metabolic Interface between Stress Perception and Physiological Responses.” The Plant Cell 17 (7): 1866–1875. doi:10.1105/tpc.105.033589.
- Giannakoula, A. E., and I. F. Ilias. 2013. “The Effect of Water Stress and Salinity on Growth and Physiology of Tomato (Lycopersicon Esculentum Mil.).” Archives of Biological Sciences 65 (2): 611–620. doi:10.2298/ABS1302611G.
- Greenberg, A.E., R.R. Trussell, L. S. Clesceri, and Pinheiro, E.1999. “Standard Methods for the Examination of Water and Wastewater.” In edited, Washington, DC: American Public Health Association, American Water Works Association, Water Environment Federation, pp 2671.
- Gumi, A. M., A. A. Aliero, K. Shehu, and A. Danbaba. 2013. “Salinity Stress: Effects on Growth, Biochemical Parameters and Ion Homeostasis in Solanum Lycopersicum L. (Cv. Daneka).” Central European Journal of Experimental Biology 2 (3): 20–25.
- Hanin, M., C. Ebel, M. Ngom, L. Laplaze, and K. Masmoudi. 2016. “New Insights on Plant Salt Tolerance Mechanisms and Their Potential Use for Breeding.” Frontiers in Plant Science 7: 1787. doi:10.3389/fpls.2016.01787.
- Hansen, V., D. Müller-Stöver, L. J. Munkholm, C. Peltre, H. Hauggaard-Nielsen, and L. S. Jensen. 2016. “The Effect of Straw and Wood Gasification Biochar on Carbon Sequestration, Selected Soil Fertility Indicators and Functional Groups in Soil: An Incubation Study.” Geoderma 269: 99–107. doi:10.1016/j.geoderma.2016.01.033.
- Hasanuzzaman, M., M. A. Hossain, J. A. Teixeira Da Silva, and M. Fujita. 2012. “Plant Responses and Tolerance to Abiotic Oxidative Stress: Antioxidant Defense Is a Key Factor.” In Crop Stress and Its Management: Perspectives and Strategies, V. Bandi, A. K. Shanker, C. Shanker, and M. Mandapaka edited by. Berlin: Springer. 261–316. doi:10.1007/978-94-007-2220-0_8.
- Heath, R. L., and L. Packer. 1968. “Photoperoxidation in Isolated Chloroplasts: I. Kinetics and Stoichiometry of Fatty Acid Peroxidation.” Archives of Biochemistry and Biophysics 125 (1): 189–198. doi:10.1016/0003-9861(68)90654-1.
- Hichri, I., Y. Muhovski, E. Žižková, P. I. Dobrev, E. Gharbi, J. M. Franco-Zorrilla, I. Lopez-Vidriero, et al. 2017. “The Solanum Lycopersicum WRKY3 Transcription Factor SlWRKY3 Is Involved in Salt Stress Tolerance in Tomato.” Frontiers in Plant Science 8: 1343. doi:10.3389/fpls.2017.01343.
- Hussain, S., M. Shaukat, M. Ashraf, C. Zhu, Q. Jin, and J. Zhang. 2019. “Salinity Stress in Arid and Semi-arid Climates.” In Effects and Management in Field Crops. Climate Change and Agriculture, edited by S. Hussain, 123–145. London: IntechOpen.
- Inoue, M. 2012. “Salinization Status and Salt Removal Techniques.” Geotechnical Engineering Management 60: 12–15.
- Jeffery, S., F. G. Verheijen, M. Van der Velde, and A. C. Bastos. 2011. “A Quantitative Review of the Effects of Biochar Application to Soils on Crop Productivity Using Meta-analysis.” Agriculture, Ecosystems & Environment 144 (1): 175–187. doi:10.1016/j.agee.2011.08.015.
- Jogawat, A. 2019. “Chapter 5: Osmolytes and Their Role in Abiotic Stress Tolerance in Plants.” In In Molecular Plant Abiotic Stress: Biology and Biotechnology, edited by A. Roychoudhury and D. Tripathi, 91–104. Hoboken, NJ, USA: John Wiley & Sons .
- Kanwal, S., N. Ilyas, S. Shabir, M. Saeed, R. Gul, M. Zahoor, N. Batool, and R. Mazhar. 2018. “Application of Biochar in Mitigation of Negative Effects of Salinity Stress in Wheat (Triticum Aestivum L.).” Journal of Plant Nutrition 41 (4): 526–538. doi:10.1080/01904167.2017.1392568.
- Karabay, U., A. Toptas, J. Yanik, and L. Aktas. 2021. “Does Biochar Alleviate Salt Stress Impact on Growth of Salt-Sensitive Crop Common Bean.” Communications in Soil Science and Plant Analysis 52 (5): 456–469. doi:10.1080/00103624.2020.1862146.
- Khan, M. N. 2016. “Growth and Physiological Attributes of Tomato (Lycopersicon Esculentum Mill.) Genotypes as Affected by NaCl Stress.” American Journal of Plant Sciences 7 (3): 453–460. doi:10.4236/ajps.2016.73039.
- Kim, H. S., K. R. Kim, J. E. Yang, Y. S. Ok, G. Owens, T. Nehls, G. Wessolek, and K. H. Kim. 2016. “Effect of Biochar on Reclaimed Tidal Land Soil Properties and Maize (Zea Mays L.) Response.” Chemosphere 142: 153–159. doi:10.1016/j.chemosphere.2015.06.041.
- Laird, D., P. Fleming, B. Wang, R. Horton, and D. Karlen. 2010. “Biochar Impact on Nutrient Leaching from a Midwestern Agricultural Soil.” Geoderma 158 (3–4): 436–442. doi:10.1016/j.geoderma.2010.05.012.
- Lashari, M. S., Y. Ye, H. Ji, L. Li, G. W. Kibue, H. Lu, J. Zheng, and G. Pan. 2015. “Biochar–manure Compost in Conjunction with Pyroligneous Solution Alleviated Salt Stress and Improved Leaf Bioactivity of Maize in A Saline Soil from Central China: A 2-year Field Experiment.” Journal of the Science of Food and Agriculture 95 (6): 1321–1327. doi:10.1002/jsfa.6825.
- Lehmann, J., M. C. Rillig, J. Thies, C. A. Masiello, W. C. Hockaday, and D. Crowley. 2011. “Biochar Effects on Soil Biota–a Review.” Soil Biology & Biochemistry 43 (9): 1812–1836. doi:10.1016/j.soilbio.2011.04.022.
- Lehmann, J., and S. Joseph. 2009. “Biochar for Environmental Management: An Introduction.” In Biochar for Environmental Management: Science and Technology, edited by J. Lehmann and S. Joseph, 1–12. London, U.K: Earthscan/Dunstan House.
- Li, Y. 2009. “Physiological Responses of Tomato Seedlings (Lycopersicon Esculentum) to Salt Stress.” Modern Applied Science 3 (3): 171–176. doi:10.5539/mas.v3n3p171.
- Lichtenthaler, H. K., and C. Buschmann. 2001. “Chlorophylls and Carotenoids: Measurement and Characterization by UV‐VIS Spectroscopy.” Current Protocols in Food Analytical Chemistry 1 (1): F4–3. doi:10.1002/0471142913.faf0403s01.
- Lindsay, W. L., and W. A. Norwell. 1969. “Development of DTPA Soil Test for Zinc, Iron, Manganese and Copper.” Soil Sci Soc Am Proc 33: 49–54. doi:10.2136/sssaj1978.03615995004200030009x.
- Liu, J., and J. K. Zhu. 1997. “An Arabidopsis Mutant that Requires Increased Calcium for Potassium Nutrition and Salt Tolerance.” Proceedings of the National Academy of Sciences 94 (26): 14960–14964. doi:10.1073/pnas.94.26.14960.
- Liu, X., A. Zhang, C. Ji, S. Joseph, R. Bian, L. Li, G. Pan, and J. Paz-Ferreiro. 2013. “Biochar’s Effect on Crop Productivity and the Dependence on Experimental Conditions-a Meta-analysis of Literature Data.” Plant and Soil 373 (1): 583–594. doi:10.1007/s11104-013-1806-x.
- Loreto, F., and V. Velikova. 2001. “Isoprene Produced by Leaves Protects the Photosynthetic Apparatus against Ozone Damage, Quenches Ozone Products, and Reduces Lipid Peroxidation of Cellular Membranes.” Plant Physiology 127 (4): 1781–1787. doi:10.1104/pp.010497.
- Lu, W., W. Ding, J. Zhang, H. Zhang, J. Luo, and N. Bolan. 2015. “Nitrogen Amendment Stimulated Decomposition of Maize Straw-derived Biochar in A Sandy Loam Soil: A Short-Term Study.” Plos One 1–16. doi:10.1371/journal.pone.0133131.
- Machado, R. M. A., and R. P. Serralheiro. 2017. “Soil Salinity: Effect on Vegetable Crop Growth. Management Practices to Prevent and Mitigate Soil Salinization.” Horticulturae 3 (2): 30. doi:10.3390/horticulturae3020030.
- Maggio, A., S. De Pascale, G. Angelino, C. Ruggiero, and G. Barbieri. 2004. “Physiological Response of Tomato to Saline Irrigation in Long-term Salinized Soils.” European Journal of Agronomy 21 (2): 149–159. doi:10.1016/S1161-0301(03)00092-3.
- Manan, A., C. M. Ayyub, R. Ahmad, M. A. Bukhari, and Z. Mustafa. 2016. “Salinity Induced Deleterious Effects on Biochemical and Physiological Processes of Tomato.” Pakistan Journal of Life & Social Sciences 14 (2), 83-90.
- Mazac, R. (2016) “Assessing the Use of Food Waste Biochar as a Biodynamic Plant Fertilizer.” Departmental Honors Projects 43.
- McLean, E. O. 1982. “Soil pH and Lime Requirement.” In Methods of Soil Analysis, Part 2, Chemical and Microbiological Properties, A. L. Page edited by,second,199–223.Madison Wisconsin:American Society of Agronomy Inc. Soil Science Society of America. 10.2134/agronmonogr9.2.2ed.c12.
- Munns, R., and M. Tester. 2008. “Mechanisms of Salinity Tolerance.” Annual Review of Plant Biology 59 (1): 651–681. doi:10.1146/annurev.arplant.59.032607.092911.
- Nelson, D. W., and L. E. Sommers. 1982. “Total Carbon, Organic Carbon and Organic Matter.” In Methods of Soil Analysis, Part 2, Chemical and Microbiological Properties, A. L. Page edited by,second,539–577.Madison, Wisconsin:American Society of Agronomy Inc., Soil Science Society of America. 10.2134/agronmonogr9.2.2ed.c29.
- Novak, J., I. Lima, and B. Xing. 2009. “Characterization of Designer Biochar Produced at Different Temperatures and Their Effects on a Loamy Sand.” Annals of Environmental Science 3 (843): 195–206.
- Olsen, S. R., C. V. Cole, F. S. Watanabe, and L. A. Dean (1954) “Estimation of Available Phosphorus in Soils by Extraction with Sodium Bicarbonate.” USDA Circular, Washington, DC. 939, pp 1–19.
- Parkash, V., and S. Singh. 2020. “Potential of Biochar Application to Mitigate Salinity Stress in Eggplant.” HortScience 1: 1–10. aop. doi:10.21273/HORTSCI15398-20.
- Pinheiro, E., Ricardo, B., Enrique, V.C., and Heath, T. 2001 “Load balancing and unbalancing for power and performance in cluster-based systems.” In Workshop on compilers and operating systems for low power, 180: 182-195.
- Plaimart, J., K. Acharya, W. Mrozik, R. J. Davenport, S. Vinitnantharat, and D. Werner. 2021. “Coconut Husk Biochar Amendment Enhances Nutrient Retention by Suppressing Nitrification in Agricultural Soil following Anaerobic Digestate Application.” Environmental Pollution 268: 115684. doi:10.1016/j.envpol.2020.115684.
- Polash, M. A. S., M. A. Sakil, M. Tahjib-Ul-Arif, and M. A. Hossain. 2018. “Effect of Salinity on Osmolytes and Relative Water Content of Selected Rice Genotypes.” Tropical Plant Research 5 (2): 227–232. doi:10.22271/tpr.2018.v5.i2.029.
- Qayyum, M. F., M. Abid, S. Danish, M. K. Saeed, and M. A. Ali. 2015. “Effects of Various Biochars on Seed Germination and Carbon Mineralization in an Alkaline Soil.” Pakistan Journal Agricultural Science 51: 977–982.
- Qin, J., W. Y. Dong, K. N. He, Y. Yu, G. D. Tan, L. Han, M. Dong, et al. 2010. “NaCl Salinity-induced Changes in Water Status, Ion Contents and Photosynthetic Properties of Shepherdia Argentea (Pursh) Nutt. Seedlings.” Plant, Soil and Environment 56 (7): 325–332. doi:10.17221/209/2009-PSE.
- Rahman, M. M., M. Hossain, K. F. B. Hossain, M. T. Sikder, M. Shammi, M. Rasheduzzaman, M. A. Hossain, A. M. Alam, and M. K. Uddin. 2018. “Effects of NaCl-salinity on Tomato (Lycopersicon Esculentum Mill.) Plants in a Pot Experiment.” Open Agriculture 3 (1): 578–585. doi:10.1515/opag-2018-0061.
- Reddy, M. P., and A. B. Vora. 1986. “Salinity Induced Changes in Pigment Composition and Chlorophyllase Activity of Wheat.” Indian Journal of Plant Physiology 29 (4): 331–334.
- Rhoades, J. D. 1996. “Salinity: Electrical Conductivity and Total Dissolved Solids.” In Methods of Soil Analysis, Part 3, Chemical Methods, edited by D. L. Sparks, 417–435. Madison, Wisconsin: Soil Science Society of America. doi:10.2136/sssabookser5.3.c14.
- Rivero, R. M., T. C. Mestre, R. O. Mittler, F. Rubio, F. R. Garcia-Sanchez, and V. Martinez. 2014. “The Combined Effect of Salinity and Heat Reveals a Specific Physiological, Biochemical and Molecular Response in Tomato Plants.” Plant, Cell & Environment 37: 1059–1073. doi:10.1111/pce.12199.
- Sahin, U., M. Ekinci, S. Ors, M. Turan, S. Yildiz, and E. Yildirim. 2018. “Effects of Individual and Combined Effects of Salinity and Drought on Physiological, Nutritional and Biochemical Properties of Cabbage (Brassica Oleracea Var. Capitata).” Science Horticulture 240: 196–204. doi:10.1016/j.scienta.2018.06.016.
- Shams, M., E. Yildirim, E. Arslan, and G. Agar. 2020. “Salinity Induced Alteration in DNA Methylation Pattern, Enzyme Activity, Nutrient Uptake and H2O2 Content in Pepper (Capsicum Annuum L.) Cultivars.” Acta Physiologiae Plantarum 42 (59). doi:10.1007/s11738-020-03053-9.
- Shams, M., M. Ekinci, S. Ors, M. Turan, G. Agar, R. Kul, and E. Yildirim. 2019. “Nitric Oxide Mitigates Salt Stress Effects of Pepper Seedlings by Altering Nutrient Uptake, Enzyme Activity and Osmolyte Accumulation.” Physiology and Molecular Biology of Plants 25 (5): 1149–1161. doi:10.1007/s12298-019-00692-2.
- Sharma, P., A. B. Jha, R. S. Dubey, and M. Pessarakli. 2012. “Reactive Oxygen Species, Oxidative Damage, and Antioxidative Defense Mechanism in Plants under Stressful Conditions.” Journal of Botany 217037. doi:10.1155/2012/217037.
- Shashi, M. A., M. A. Mannan, M. M. Islam, and M. M. Rahman. 2018. “Impact of Rice Husk Biochar on Growth, Water Relations and Yield of Maize (Zea Mays L.) Under Drought Condition.” The Agriculturists 16 (2): 93–101. doi:10.3329/agric.v16i02.40347.
- Shrivastava, P., and R. Kumar. 2015. “Soil Salinity: A Serious Environmental Issue and Plant Growth Promoting Bacteria as One of the Tools for Its Alleviation.” Saudi Journal of Biological Sciences 22 (2): 123–131. doi:10.1016/j.sjbs.2014.12.001.
- Singh, J., E. D. Sastry, and V. Singh. 2012. “Effect of Salinity on Tomato (Lycopersicon Esculentum Mill.) During Seed Germination Stage.” Physiology and Molecular Biology of Plants 18 (1): 45–50. doi:10.1007/s12298-011-0097-z.
- Ss, G., and N. Tuteja. 2010. “Reactive Oxygen Species and Antioxidant Machinery in Abiotic Stress Tolerance in Crop Plants.” Plant Physiology And Biochemistry: Ppb / Societe francaise de physiologie vegetale 48: 909–930. doi:10.1016/j.plaphy.2016.12.005.
- Sumner, M. E., and W. P. Miller. 1996. “Cation Exchange Capacity and Exchange Coefficients.” In Methods of Soil Analysis, Part 3, Chemical Methods, edited by D. L. Sparks, 1201–1230. Madison, Wisconsin: Soil Science Society of America.
- Tang, X., X. Mu, H. Shao, H. Wang, and M. Brestic. 2015. “Global Plant-responding Mechanisms to Salt Stress: Physiological and Molecular Levels and Implications in Biotechnology.” Critical Reviews in Biotechnology 35 (4): 425–437. doi:10.3109/07388551.2014.889080.
- Tanveer, M., B. Shahzad, A. Sharma, and E. A. Khan. 2019. “24-Epibrassinolide Application in Plants: An Implication for Improving Drought Stress Tolerance in Plants.” Plant Physiology and Biochemistry 135: 295–303. doi:10.1016/j.plaphy.2018.12.013.
- Tartoura, K. A., S. A. Youssef, and E. S. A. Tartoura. 2014. “Compost Alleviates the Negative Effects of Salinity via Up-regulation of Antioxidants in Solanum Lycopersicum L. Plants.” Plant Growth Regulation 74 (3): 299–310. doi:10.1007/s10725-014-9923-y.
- Thomas, G. W. 1982. “Exchangeable Cations.” In Methods of Soil Analysis, Part 2, Chemical and Microbiological Properties, edited by A. L. Page, 159–164. second ed. Madison, Wisconsin: American Society of Agronomy Inc., Soil Science Society of America .
- Thomas, S. C., S. Frye, N. Gale, M. Garmon, R. Launchbury, N. Machado, S. Melamed, J. Murray, A. Petroff, and C. Winsborough. 2013. “Biochar Mitigates Negative Effects of Salt Additions on Two Herbaceous Plant Species.” Journal of Environmental Management 129: 62–68. doi:10.1016/j.jenvman.2013.05.057.
- Usman, A. R. A., M. I. Al-Wabel, Y. S. Ok, A. Al-Harbi, M. Wahb-Allah, A. H. El-Naggar, M. Ahmad, A. Al-Faraj, and A. Al-Omran. 2016. “Conocarpus Biochar Induces Changes in Soil Nutrient Availability and Tomato Growth under Saline Irrigation.” Pedosphere 26 (1): 27–38. doi:10.1016/S1002-0160(15)60019-4.
- Uzoma, K. C., M. Inoue, H. Andry, H. Fujimaki, A. Zahoor, and E. Nishihara. 2011. “Effect of Cow Manure Biochar on Maize Productivity under Sandy Soil Condition.” Soil Use and Management 27 (2): 205–212. doi:10.1111/j.1475-2743.2011.00340.x.
- Van Hoorn, J. W., N. Katerji, A. Hamdy, and M. Mastrorilli. 2001. “Effect of Salinity on Yield and Nitrogen Uptake of Four Grain Legumes and on Biological Nitrogen Contribution from the Soil.” Agricultural Water Management 51 (2): 87–98. doi:10.1016/S0378-3774(01)00114-7.
- Xiang, Y., Q. Deng, H. Duan, and Y. Guo. 2017. “Effects of Biochar Application on Root Traits: A Meta‐analysis.” Global Change Biology. Bioenergy 9 (10): 1563–1572. doi:10.1111/gcbb.12449.
- You, J., and Z. Chan. 2015. “ROS Regulation during Abiotic Stress Responses in Crop Plants.” Frontiers in Plant Science 6: 1092. doi:10.3389/fpls.2015.01092.
- Zhang, X., H. Wang, L. He, K. Lu, A. Sarmah, J. Li, N. S. Balon, J. Pei, and H. Huang. 2013. “Using Biochar for Remediation of Soils Contaminated with Heavy Metals and Organic Pollutants.” Environmental Science and Pollution Research 20 (12): 8472–8483. doi:10.1007/s11356-013-1659-0.
- Zhu, J. K. 2001. “Plant Salt Tolerance.” Trends in Plant Science 6 (2): 66–71. doi:10.1016/S1360-1385(00)01838-0.