
 ?Mathematical formulae have been encoded as MathML and are displayed in this HTML version using MathJax in order to improve their display. Uncheck the box to turn MathJax off. This feature requires Javascript. Click on a formula to zoom.
ABSTRACT
Atmospheric concentrations of carbon dioxide (CO2) have steadily increased over recent decades. The fertilization effect of elevated CO2 concentrations (E-[CO2]) is known to increase the biomass production and also the nitrogen (N) demand of paddy rice, which affects the rice N use efficiency. This study was conducted to elucidate the fertilizer-derived N use of paddy rice (Oryza sativa L.) for two varieties, japonica cv. Koshihikari and indica cv. Takanari, with and without E-[CO2] using a free-air CO2 enrichment (FACE) facility in central Japan. To quantify the fate of fertilizer-derived N directly, polymer-coated 15N-labeled urea was used with a one-shot application rate of 80 kg N ha–1 incorporated into the plowed layer at the basal fertilization before transplanting of rice seedlings. The biomass, total N concentrations, and 15N abundance in each part of the rice plants were measured at the panicle initiation, heading, and maturing stages. The total N content and 15N abundance in the soil were measured at the maturing stage to evaluate the N balance of the rice–soil system. While E-[CO2] significantly increased the whole plant biomass and the total N content in panicles, it did not increase the total N and the fertilizer-derived N content in the whole plant. The recovery efficiency (fertilizer-derived N in the whole plant to applied N, RE) ranged between 64.9% and 68.7%, and the agronomic efficiency (fertilizer-derived N in panicles to applied N, AE) ranged between 37.8% and 43.8%. The effect of CO2 on RE and AE was not significant. The REs, higher in Koshihikari, and the AEs, higher in Takanari indicated that Takanari preferentially allocated fertilizer-derived N to panicles. The REs, 69% at the maximum in this study, implies an upper limit of use efficiency of N fertilizer, even for polymer-coated (controlled-release) fertilizer. E-[CO2] significantly increased the rice N uptake from sources other than fertilizer, of which mineralization was the most-likely source. Monitoring of soil fertility and appropriate fertilization management are, therefore, necessary for sustainable rice production avoiding long-term decline in soil N fertility.
1. Introduction
Atmospheric concentrations of carbon dioxide (CO2) have been increasing since the industrial revolution. The global annual mean value of the CO2 concentration ([CO2]) surpassed 400 ppm in 2016 (NOAA Citation2021). Of the anthropogenic greenhouse gases, CO2 poses the greatest risk since its effects on global warming and accompanying climate change are serious threats to both humanity and nature (IPCC Citation2013). As the essential substrate of photosynthesis, elevated [CO2] (E-[CO2]) also has the effect of increasing the primary production of plants, including crops, in an effect commonly referred to the CO2 fertilization effect (Parry et al. Citation2004). However, the extent of the CO2 fertilization effect is one of the major uncertainties in future projections of crop production (Rosenzweig et al. Citation2014; Deryng et al. Citation2016; Schleussner et al. Citation2018; Hasegawa et al. Citation2019). A great concern in Asian countries including Japan is the future production of paddy rice (Oryza sativa L.) as the staple cereal in the region.
The advantage of a free-air CO2 enrichment (FACE) study is that the effects of E-[CO2] on crop production in an actual field scale can be directly determined (IPCC Citation2013; Ainsworth and Long Citation2020). FACE studies of single cropping of paddy rice were conducted continuously in the north-eastern and central parts of Japan (Hayashi et al. Citation2016). Other conditions, such as nitrogen (N) fertilization, rice varieties, and warming, were combined with E-[CO2] to elucidate their single and combined effects on rice production and carbon and N cycling in rice paddies (Tokida et al. Citation2010, Citation2011, Citation2013; Hasegawa et al. Citation2013, Citation2019; Zhang et al. Citation2013; Hayashi et al. Citation2016). While it is known that E-[CO2] fundamentally increases both the biomass and yield of single-crop paddy rice, the extent to which strongly depends on the variety of rice (e.g., Hasegawa et al. Citation2019).
The availability of N as a macronutrient strongly affects crop productivity. The CO2 fertilization effect by E-[CO2] potentially increases the N demand of rice plants. The positive responses of photosynthesis, biomass production, and yield are reduced when N availability is limited (Nakano et al. Citation1997; Kimball et al. Citation2002; Hasegawa et al. Citation2019). Although fertilizer is the most effective N source in rice production, there are other N sources in rice paddies, including biological N fixation (BNF), atmospheric deposition, irrigation, organic materials such as plant residues, and mineralization of soil organic matter (Kyuma Citation2004). It is necessary to determine the appropriate application rate of N fertilizer under E-[CO2] to ensure the balance between reducing N loss to the environment and avoiding unwanted soil N mining by rice production.
Measuring the N concentration in rice plants is not difficult; however, the obtained N value is a mixture of N from all sources. It is necessary to quantify many items to determine the fertilizer-derived N use by rice plants under E-[CO2]. They are, the proportion of fertilizer-derived N to total N in rice plants, the allocation of fertilizer-derived N in each part of rice plants, the direct effects of E-[CO2] and variety on fertilizer-derived N uptake by rice plants, and the interaction between E-[CO2] and variety on fertilizer-derived N uptake. An experiment using 15N-labeled fertilizer is a straightforward way to quantify the fertilizer-derived N in rice plants and soil (e.g., Bronson et al. Citation2000; Zhang et al. Citation2012; Chalk et al. Citation2015).
The purposes of the present study were to elucidate the uptake and allocation of fertilizer-derived N for two rice varieties, japonica cv. Koshihikari and indica cv. Takanari, in combination with and without E-[CO2], using a polymer-coated 15N-labeled urea as a controlled-release fertilizer. The effects of E-[CO2] and rice variety on the balance of fertilizer N and that of total N in the rice–soil system were also evaluated to discuss their possible effects on long-term soil fertility.
2. Materials and methods
2.1. Study site
This study was conducted in 2015 at the FACE facility for single-crop paddy rice located in Tsukubamirai City, Ibaraki Prefecture, Japan (Tsukuba FACE; 35°58′27″N, 139°59′32″E, 10 m A.S.L.). The Tsukuba FACE was in operation from 2010 to 2017 and consisted of four rectangular bays of fields. The soil was classified as Fluvisol, a typical soil in alluvial areas comprised of 23% clay and 40% silt (Hasegawa et al. Citation2013). A CO2-enrichment plot (a FACE plot) was set in each bay, accompanying a plot without a CO2 treatment (an ambient plot). The FACE plot was equipped with two-layered octagonal rings with a diameter of 17 m for pure CO2 release. The target E-[CO2] at the center of the FACE plots was 200 ppm above the ambient concentrations. Detailed information on the CO2 enrichment techniques is shown in Nakamura et al. (Citation2012).
Monthly mean air temperatures, solar radiation, and precipitation in the cropping season of 2015 and those in the preceding three years from 2012 to 2014 are summarized in . Key differences in 2015 compared to the last three years were the shortage of sunshine from July to September accompanied with relatively low temperatures in August and September and precipitation higher than its average in July and September.
Table 1. Monthly weather conditions at the Tsukuba FACE site
2.2. Field management and experimental design
The management practices common to all the Tsukuba FACE facility in 2015 were as follows: the application of chemical phosphorus and potassium fertilizer (15% P2O5 and 15% K2O; Mitsui PK Kasei, Kantodenko) on April 9 at rates of 100 kg P2O5 ha–1 for phosphorus and 100 kg K2O ha–1 for potassium, respectively; submergence of the rice paddies at the end of April 2015; and continuous submergence until the drainage at the end of August. CO2 enrichment at the FACE plots was implemented during the daytime from May 31 to September 11. The mean [CO2] in the season of 2015 was 579 ± 20 ppm at the FACE plots and 383 ± 13 ppm at the ambient plots, i.e., a difference of 196 ppm of E-[CO2].
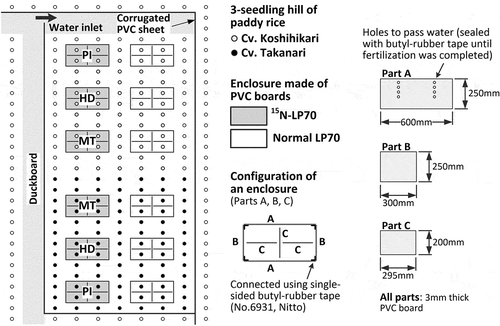
An experimental section for this study was embedded in each plot, which consisted of six enclosures of polymer-coated 15N-labelled urea (15N enclosures), six enclosures of normal polymer-coated urea (normal enclosures), and a buffer zone surrounding the enclosures (). Each enclosure was made using polyvinylchloride plates with a thickness of 3 mm and single-sided butyl-rubber tape (No.6931, Nitto) to connect the plates without gaps. The normal enclosures were prepared to determine the shoot/root biomass ratio at each growth stage under the same physical conditions as those of the 15N enclosures. The experimental sections were puddled on May 20 before N fertilizer application at the whole Tsukuba FACE facility. On May 21, enclosures with sealed holes to isolate them from water outside were set on the soil and gently hammered into soil until reaching these bottom edges to the plow pan (see the Supplementary Information for several pictures). Polymer-coated urea that releases almost all of the N over the course of 70 days (LP-70) was used as a controlled-release fertilizer with an application rate of 80 kg N ha–1 at the basal fertilization. No supplemental fertilization was conducted. On May 23, normal polymer-coated urea (LP-70, JCAM AGRI) was applied to the normal enclosures and the buffer zone, and then manually incorporated well within the plowed layer (approximately 0–15 cm depth). On the same day, polymer-coated 15N-labeled urea (3.2% 15N; LP-70, SI Science) was applied to the 15N enclosures with the same application rate and incorporated likewise. On May 28, three seedlings per hill of two rice varieties, cv. Koshihikari and cv. Takanari, were transplanted at a density of 22.2 hill m–2 (spacing of 0.3 m × 0.15 m). Koshihikari is a standard japonica cultivar (Kobayashi et al. Citation2018) and Takanari is a high-yielding indica cultivar (Imbe et al. Citation2004). Takanari has a characteristic of less N constraints in response to E-[CO2] even under limited N conditions (Hasegawa et al. Citation2019). On the same day, a soil solution collection tube (DIK-301A-A1, Daiki) was set near each of the four hills in the 15N enclosure for the maturing stage (MT). On May 29, the seals closing the holes of the enclosures were removed to allow water to pass through.
Figure 1. Design of the experimental section embedded in the Tsukuba FACE in 2015. PI, sampling plot at panicle initiation; HD, heading; and MT, maturing stages.
2.3. Sampling and analysis
The sampling of rice plants was conducted at the following three stages; panicle initiation (PI; July 7), heading (HD; August 12), and MT (September 14). On three of the four hills in the 15N-enclosure, their aboveground parts were sampled at the corresponding growth stage to determine the biomass of each part (panicles, leaves, dead leaves, and straw) and its total N concentration and 15N abundance. The one remaining hill was vertically cut into quarters at the site, a quarter of which with the roots and soil was sampled to determine the total N concentration and 15N abundance of the roots after careful soil washing. The whole of one moderately grown hill with the soil was sampled in the normal enclosure at the corresponding growth stage, and its roots were washed carefully and thoroughly to measure the aboveground biomass and root biomass, and then the ratio of aboveground biomass to root biomass (shoot/root ratio). The root biomass of the 15N enclosure was estimated using the aboveground biomass of the 15N enclosure and the shoot/root biomass ratio of the normal enclosure.
The sampling of the soil solution was conducted on May 23 and 29, and weekly from June 2 to July 14, and on July 28, August 11 and 20. The soil solutions (ca. 50 mL) collected from each of the four hills in the 15N enclosures (MT) were combined as one sample to determine the ammonium (NH4) concentration. 15N abundance was not determined for the soil solution.
Soil sampling was conducted on 13 September at the 15N enclosures (MT). A four-stage soil core sampler (HSC-20, Fujiwara Scientific) was used to collect soil cores at 5-cm intervals from 0 to 20 cm depths, with three cores from 0 to 15 cm depths analyzed. Each core has a cylindrical form with a volume of 100 mL (20 cm2 surface area, 5 cm height). The fresh soil weight was measured by subtracting the weight of the core from that containing the sampled soil. A part of the fresh soil was used to determine the soil water content and then the soil bulk density by drying under 105°C for 24 hours. The remainder was air-dried to measure the soil total N concentration and 15N abundance.
The total N concentration of the rice and soil samples (% w/w) was measured using an NC analyzer (Sumigraph NC-22 F, Sumika Chemical Analysis Service, Tokyo, Japan). The NH4 concentrations in the soil solution (mg N L–1) were measured with a flow injection analyzer (AQLA-1000, Aqualab, Tokyo, Japan). The 15N abundance (the 15N/14N stable isotope ratio) of the fertilizer, rice, and soil samples (%) was determined with an elemental analyzer/isotope ratio mass spectrometer (Flash EA 1112 coupled to Delta V Advantage via ConFlo III interface, Thermo Fisher Scientific, Bremen, Germany). All the measurements of 15N abundance were conducted at the Advanced Analysis Center, NARO, Japan. Here, the 15N abundance of the soil sampled at the Tsukuba FACE, not affected by the 15N-urea, was used as the reference abundance (15Nref = 0.367%). The ratio of fertilizer-derived N to total N in a sample (rferN,sample, %) is expressed as follows:
where 15Nsample and 15NLP70 are the 15N abundance of a sample and the fertilizer, respectively. 15NLP70 was determined as 3.21%.
The fertilizer-derived N content per unit area (FerN, kg N ha–1) is expressed by,
where part and soil denote each part of rice plants and soil, respectively. BM, the biomass per unit area (kg ha–1); BD, the bulk density of soil (Mg m–3); Ctot, the total N concentration (% w/w); and l, each layer of the soil (5-cm interval from 0 to 15 cm depth). The number of 50 in EquationEq. 3(3)
(3) converts the N content of soil (Mg N m–3) with a thickness of 5 cm into the N content per ha (kg N ha–1), = 0.05 (m) × 10,000 (m2 ha–1) × 100–1 (% w/w to ratio) × 100–1 (% to ratio) × 1000 (kg N m–3).
The recovery efficiency (RE) and the agronomic efficiency (AE) were employed to evaluate the use efficiency of N fertilizer by rice plants. The dilution method (Bronson et al. Citation2000) was applied to calculate the RE and AE for the MT stage, since the 15N-labeled fertilizer enabled direct quantification of the fertilizer-derived N in the samples. The RE of the aboveground part (REag, %), the RE of the whole plant including roots (REwp, %), and the agronomic efficiency (AE, %) are expressed by,
where, ag, wp, and pan denote the aboveground part, whole plant, and panicles, respectively. appl is the applied fertilizer N (FerNappl = 80 kg N ha–1). It is noted that the N in panicles was used as the proxy of rice yield N to calculate AE.
The difference method was also applied to calculate the RE of aboveground part (REag(diff), %) and AE (AEdiff, %) for reference to compare the two methods. The difference method indirectly estimates the rice uptake of N fertilizer as the difference in total N content between the fertilized and non-fertilized plots (Bronson et al. Citation2000).
where, TotN[15N] and TotN[0 N] denote the total N content in rice plants (ag or pan) per unit area sampled at the 15N enclosures in this study (kg N ha–1), and that of the same cultivar sampled at the non-fertilized section in each plot of the Tsukuba FACE facility in the same season (kg N ha–1), respectively.
To evaluate the fate of applied N fertilizer, the ratio of fertilizer-derived N remaining in the soil (RSR, %), and the ratio of the apparent loss of fertilizer-derived N to the environment (ELR, %) were calculated using the data at the MT stage.
Tests of statistical significance were carried out by a mixed model of SAS (‘proc mixed‘ ver. 9.4, SAS Institute Inc., Cary, NC, USA). Our experimental design corresponded to a split-plot where [CO2] was the main-plot factor, and rice variety the split-plot factor, with four replications. For comparison between the dilution and difference methods to determine RE and AE, method was treated as the split-split-plot factor under rice variety. For NH4 concentration in soil solution, sampling date was included as repeated measure with AR(1) as the correlational structure.
3. Results
3.1. Biomass and N content of rice plants
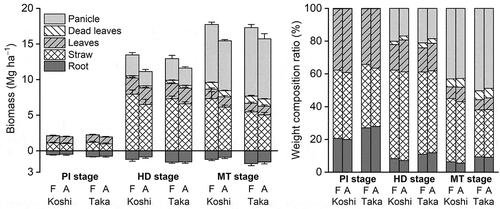
The rice plant biomass per unit area is shown in . The mean values of the aboveground biomass were 2.1, 13.9, and 18.3 Mg ha–1 at the PI, HD, and MT stages, respectively, for Koshihikari (FACE), similarly, 2.0, 11.0, and 15.4 Mg ha–1 for Koshihikari (ambient), 2.2, 13.4, and 17.5 Mg ha–1 for Takanari (FACE), and 1.9, 11.8, and 16.3 Mg ha–1 for Takanari (ambient). The mean values of the shoot/root ratio of the biomass were 3.9, 11.5, and 14.8 at the PI, HD, and MT stages, respectively, for Koshihikari (FACE), similarly, 4.2, 13.5, and 17.6 for Koshihikari (ambient), 2.7, 8.3, and 9.9 for Takanari (FACE), and 2.7, 7.6, and 10.2 for Takanari (ambient). Concrete data for each part are shown in the Supplementary Information (Table S1). E-[CO2] significantly increased the aboveground biomass at the MT stage by 14.9% for Koshihikari and 10.3% for Takanari (P < 0.001). E-[CO2] also increased the panicle biomass at the MT stage, which approximately indicates the rice yield, by 16.7% for Koshihikari and 13.7% for Takanari (P < 0.01) as well as the straw biomass (P < 0.05). The biomass of the leaves and straw of Koshihikari were larger than those of Takanari, and the biomass of the panicles and roots of Takanari were larger than those of Koshihikari (P < 0.05). However, the effect of variety on the aboveground biomass was not significant (P = 0.89) despite the fact that Takanari is known as a high biomass variety. The factors which may have contributed to this result are discussed in Section 4.1.
Figure 2. Biomass and the weight composition ratio of each part of paddy rice. Bars denote the standard deviation (n = 4 blocks). PI, HD, and MT denote the panicle initiation, heading, and maturing stages, respectively. F, elevated carbon dioxide (CO2) plot; A, ambient CO2 plot; Koshi, paddy rice (cv. Koshihikari); and Taka, paddy rice (cv. Takanari).
The total N concentrations and the ratios of fertilizer-derived N to total N in each part of rice plants at the MT stage are shown in . The total N concentrations tended to be high in the panicles and leaves (0.99–1.20% w/w) and low in the straw (0.35–0.40% w/w) in both the varieties. The ratios of fertilizer-derived N to total N were high in leaves (42.7–45.6%) and low in roots (23.8–32.3%). The effect of CO2 on the total N concentration was not significant for all parts (P > 0.1). The total N concentrations were higher in Koshihikari than in Takanari in the roots (P < 0.001), straw (P < 0.05), and dead leaves (P < 0.05). Concrete data including the PI and HD stages are shown in the Supplementary Information (Table S2).
Table 2. Total nitrogen (N) concentrations and the ratio of fertilizer-derived N to total N in the rice plants at the maturing stage
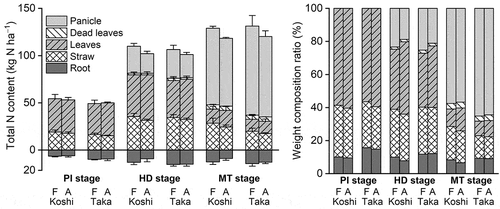
The total N content in rice plants per unit area is shown in . The mean values of the total N content in the aboveground part were 54.8, 109.9, and 129.0 kg N ha–1 at the PI, HD, and MT stages, respectively, for Koshihikari (FACE), similarly, 53.3, 102.1, and 118.2 kg N ha–1 for Koshihikari (ambient), 49.4, 106.4, and 131.3 kg N ha–1 for Takanari (FACE), and 50.3, 101.2, and 120.2 kg N ha–1 for Takanari (ambient). The mean values of the shoot/root ratio of the total N content were 9.1, 9.3, and 11.4 at the PI, HD, and MT stages, respectively, for Koshihikari (FACE), similarly, 10.0, 12.9, and 14.9 for Koshihikari (ambient), 5.4, 7.6, and 10.0 for Takanari (FACE), and 6.0, 7.4, and 10.1 for Takanari (ambient). Although the total N content in the whole plant at the MT stage tended to be high at the FACE plots, E-[CO2] did not increase that significantly (P = 0.12) but increased the panicle total N content (P < 0.05) (). The panicle N content of Takanari was higher than that of Koshihikari (P < 0.01). Approximately 50% of the total N accumulated in Koshihikari was in the panicles, and in the case of Takanari, it was more than 60%. The total N content in the aboveground parts other than the panicles (P < 0.001) and roots (P < 0.05) was higher in Koshihikari than in Takanari. Thus, Takanari preferentially allocated N into its panicles. Concrete data including the PI and HD stages are shown in the Supplementary Information (Table S3).
Table 3. Total nitrogen (N) content per unit area in the rice plants at the maturing stage
Figure 3. Total nitrogen (N) content and the weight composition ratio of each part of paddy rice. Bars denote the standard deviation (n = 4 blocks). PI, HD, and MT denote the panicle initiation, heading, and maturing stages, respectively. F, elevated carbon dioxide (CO2) plot; A, ambient CO2 plot; Koshi, paddy rice (cv. Koshihikari); and Taka, paddy rice (cv. Takanari).
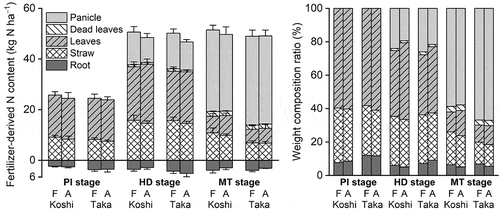
The fertilizer-derived N content in rice plants per unit area is shown in . Both varieties absorbed more than 50 kg N ha–1 of fertilizer-derived N at the HD stage, and the increases in the fertilizer-derived N content between the MT stage (51.9–55.0 kg N ha–1) and the HD stage (51.0–54.1 kg N ha–1) were small. However, the fertilizer-derived N in the leaves and straw was partly translocated into the panicles between the HD and MT stages for both the varieties. Concrete data are shown in the Supplementary Information (Table S4 and Fig. S2). The effect of CO2 on fertilizer-derived N content in the whole plant at the MT stage was not significant (P > 0.1), whereas the effect of variety on that was significant, for panicles (Koshihikari < Takanari, P < 0.01), leaves (Koshihikari > Takanari, P < 0.05), and straw (Koshihikari > Takanari, P < 0.001). Interaction between CO2 and variety was found for the fertilizer-derived N content of the whole plant (P < 0.05). This result indicated that the CO2 response of Koshihikari was higher than that of Takanari in this experiment.
Figure 4. Fertilizer-derived nitrogen (N) content and the weight composition ratio of each part of paddy rice. Bars denote the standard deviation (n = 4 blocks). PI, HD, and MT denote the panicle initiation, heading, and maturing stages, respectively. F, elevated carbon dioxide (CO2) plot; A, ambient CO2 plot; Koshi, paddy rice (cv. Koshihikari); and Taka, paddy rice (cv. Takanari).
3.2. N use efficiencies of rice plants
The REag and REwp showed a range of 61.2–64.3% and 64.9–68.7%, respectively (). The effect of CO2 on REs was not significant (P > 0.1), whereas the effect of variety on REs was significant, with Koshihikari > Takanari (P < 0.05). Interaction between CO2 and variety was found for REag (P < 0.1) and REwp (P < 0.05), indicating that E-[CO2] increased the REs of Koshihikari in particular.
Table 4. Fertilizer-derived nitrogen (N) content per unit area in the rice plants and soils, and the use efficiencies and fate of fertilizer-derived N at the maturing stage
The AE showed a range of 37.8–43.8% (). The effect of CO2 on AE was not significant (P > 0.1), whereas the effect of variety on AE was significant, with Koshihikari < Takanari (P < 0.01). Interaction between CO2 and variety was not significant for AE (P > 0.1).
The REag(diff) and AE(diff) determined by the difference method were larger than those determined by the dilution method, for REag (P < 0.01) and AE (P < 0.1) (). Interaction between method and CO2 was found for both RE (P < 0.1) and AE (P < 0.01), indicating that E-[CO2] strengthened the overestimation of the difference method.
Table 5. Comparison between the dilution and difference methods for recovery efficiency (aboveground part) and agronomic efficiency
3.3. Soil N content and soil solution ammonium concentrations
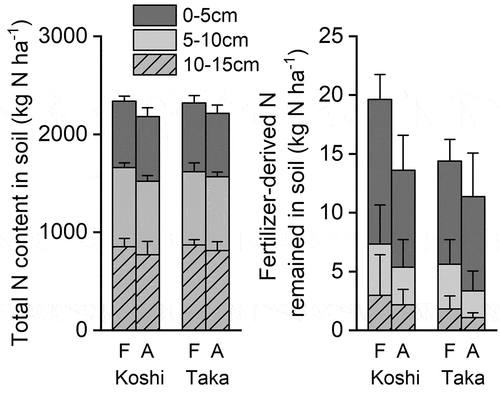
The soil N content (0–15 cm depth) as the total N and the fertilizer-derived N remaining in the soil at the MT stage is shown in . Neither CO2 nor variety had a significant effect on the soil N content (P > 0.1). The mean values of the soil total N content were 2180–2340 kg N ha–1 (0–15 cm depth). Those of the fertilizer-derived N remaining in the soil were 11.4–19.6 kg N ha–1, corresponding to RSRs of 14.2–24.5% (). Concrete soil data are shown in the Supplementary Information (Table S5).
Figure 5. Total nitrogen (N) and the remaining fertilizer-derived N content in the soil (0–15 cm depth) at the maturing stage.
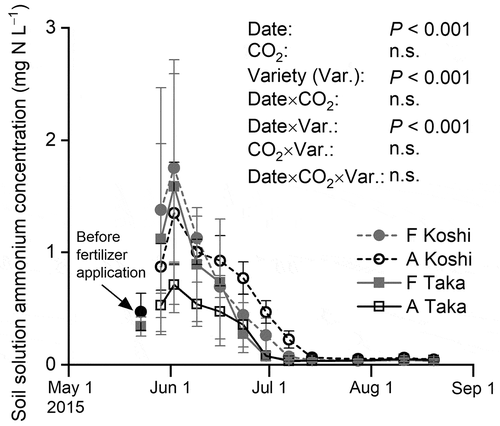
The NH4 concentrations in soil solution peaked at the beginning of June, then decreased, and were near zero after mid-July (). While the effect of CO2 on NH4 concentration was not significant (P > 0.1), the effects of sampling date and variety on NH4 concentration were significant (P < 0.001). Interaction between sampling date and variety was found (P < 0.001). These results showed that the NH4 concentrations were lower at the plots of Takanari than those of Koshihikari from mid-June to mid-July, indicating a higher N uptake rate for Takanari than that for Koshihikari.
Figure 6. Ammonium concentrations in the soil solution. Bars denote the standard deviation (n = 4 blocks). F, elevated carbon dioxide (CO2) plot; A, ambient CO2 plot; Koshi, paddy rice (cv. Koshihikari); and Taka, paddy rice (cv. Takanari).
4. Discussion
4.1. Normality of the study results
The growth and CO2 response of rice plants in this study in 2015 were different from the preceding years. Although Takanari is a variety with a higher biomass and yield than those of Koshihikari (e.g., Hasegawa et al. Citation2019), no significant difference in the aboveground biomass at the MT stage was found in this study (Section 3.1). The CO2 response of the aboveground biomass at the MT stage in this study was +14.9% for Koshihikari and +10.3% for Takanari. That at the main experimental plots of the Tsukuba FACE in 2015, with the same N fertilizer application rate, was +21.8% for Koshihikari and +9.5% for Takanari (unpublished data). On the other hand, the mean CO2 response at the main experimental plots of the Tsukuba FACE from 2012 to 2014 was +7.3% for Koshihikari and +9.4% for Takanari (Hasegawa et al. Citation2019). Takanari usually exhibited a higher CO2 response than Koshihikari, whereas the CO2 response of Koshihikari in 2015 was considerably higher than that of Takanari. It is possible that the high CO2 response of Koshihikari could be attributed to the unusual weather conditions in 2015, the fewer sunshine hours and the relatively low temperatures in August and September (). However, it is difficult to identify the mechanism and quantitative relationship between the weather conditions and the CO2 response of rice plants. The aboveground biomass at the MT stage in this study, 15.4 and 16.3 Mg ha–1 for Koshihikari and Takanari, respectively, tended to be higher than that from 2012 to 2014 on average, 14.3 and 16.0 Mg ha–1 for Koshihikari and Takanari, respectively (Hasegawa et al. Citation2019). Therefore, it can be said that the N demand of rice plants in this study was not underestimated, considering the similar or larger aboveground biomass and the similar or higher CO2 response in 2015 than found for the last three years at the same site.
4.2. Effects of CO2 and variety on rice N uptake and allocation
The effect of CO2 on rice total N uptake does not seem to be significant. In this study, E-[CO2] did not increase the whole plant total N content for both the varieties (). A series of experiments at the Tsukuba FACE from 2012 and 2014 demonstrated that E-[CO2] did not affect the aboveground total N content of Koshihikari but increased that of Takanari (Hasegawa et al. Citation2019). The difference between the two studies at the same site might be attributed to the unusual weather conditions in 2015 (Section 4.1). Another FACE experiment in China using two rice varieties, indica cv. IIY084 and japonica cv. WYJ23, also showed that E-[CO2] did not affect the whole plant total N content (Jiang et al. Citation2020). These studies confirmed the significant CO2 effect on increasing biomass (Hasegawa et al. Citation2019; Jiang et al. Citation2020, this study) that should increase the rice N demand. However, rice plants did not or could not increase N uptake. Some varieties might be able to increase N uptake as shown in the case of Takanari (Hasegawa et al. Citation2019).
The effect of variety on total N content in each part of rice plants is obvious. This study found that Takanari preferentially allocated N to panicles (Section 3.1, ). The abovementioned FACE experiment in China (Jiang et al. Citation2020) showed that the effect of variety on N content in each part was significant for panicles (indica > japonica, P < 0.05) and roots (indica < japonica, P < 0.01) but not significant for leaves and straw. The two studies demonstrated a characteristic that indica varieties preferentially allocate N to panicles.
This study provided information with few examples, i.e., the effects of CO2 and variety on rice uptake of fertilizer-derived N directly quantified using the dilution method. E-[CO2] increased the fertilizer-derived N content in roots (P < 0.1) but did not increase that in other parts and the whole plant, whereas the effect of variety on that was significant for aboveground parts and the whole plant (Section 3.1) (). In conjunction with the ratios of fertilizer-derived N to total N in each part (), these results indicate that active leaves tend to retain fertilizer-derived N, panicles tend to accumulate N from all sources, and roots have diluted concentrations of fertilizer-derived N at the MT stage. The two varieties showed different N absorption capacities, i.e., the soil solution NH4 concentrations at the Takanari plots from mid-June to mid-July was lower than that at the Koshihikari plots (). Knowledge of the differences between varieties in terms of their N demand and N uptake capacity over time will be useful for the design of an optimal fertilization method.
4.3. Effects of CO2 and variety on fertilizer-derived N use efficiencies
The REwp in this study, 64.9–68.7% (), was higher than literature values obtained by the dilution method using 15N-labeled urea. For example, the REwp obtained by a pot experiment using urea with an application rate corresponding to 300 kg N ha–1 was 44% (Bronson et al. Citation2000) and that reported from a field experiment using urea with application rates of 240–300 kg N ha–1 was 26–30% (Zhang et al. Citation2012). From these results, it can be concluded that using polymer coated urea as a controlled-release fertilizer with a low application rate in this study (80 kg N ha–1) was effective to enhance the REs.
E-[CO2] did not affect the REs and AEs (). This result implies that even a controlled-release fertilizer can not enhance rice uptake of fertilizer-derived N to meet with the possible increase in N demand with the increased rice biomass due to E-[CO2]. The total N content per unit area (= biomass per unit area × N concentration) was increased by CO2 only for the panicles and was affected by variety, with Koshihikari < Takanari for the panicles and roots and Koshihikari > Takanari for the other parts of the plant. These results suggest that rice plants have a limited capacity to increase uptake of fertilizer-derived N to meet the increased N demand; however, the capacity for additional N uptake and the strategy of N allocation inside plant body perhaps differ between varieties.
It is natural that the N release rate of the polymer-coated urea is independent from E-[CO2]. The degradation of the polymer coat is affected by temperatures. Future studies of the N use efficiency of rice for controlled-release N fertilizers under E-[CO2] and a warming climate are warranted.
4.4. Two methods to determine RE and AE
The difference method overestimated the REs and AEs compared to those of the dilution method (). Overestimation of the difference method was also found in the pot experiment by Bronson et al. (Citation2000) showing that the REs determined by the difference and dilution methods were 54% and 44%, respectively. In this study, the dilution method showed the relatively large standard deviations (), perhaps due to the fluctuations in plant growth within a plot affected by conditions other than fertilization in the field experiment. This study also revealed that E-[CO2] strengthened the overestimation of the difference method (). It means that E-[CO2] is likely to increase a contribution of N sources other than fertilizer to the total N content in rice plants at the fertilized plots.
4.5. N balance in the rice paddy
The fate of applied N fertilizer (80 kg N ha–1) at the MT stage was as follows: accumulated in rice plants (51.9–55.0 kg N ha–1), remained in soil (11.4–19.6 kg N ha–1), and lost from the rice paddies, expressed as the balance (5.4–16.7 kg N ha–1) (, Fig. S3 in Supplementary Information). Neither CO2 nor variety had a significant effect on ELR, the fertilizer-derived N loss from the rice paddies. The two main pathways of N loss from rice paddies are as follows: atmospheric emissions with ammonia (NH3) volatilization (e.g., Hayashi et al. Citation2006, Citation2008) and denitrification (e.g., Akiyama et al. Citation2006; Xia et al. Citation2020), and moving with water as an outflow of floodwater (e.g., Hayashi et al. Citation2017) and percolation to the subsoil (e.g., Katoh et al. Citation2004). In this study, the N loss associated with water movement was limited because the experiment was designed to ensure no outflow of floodwater, with only a water inlet to compensate for the decrease in floodwater due to evapotranspiration (), and the rice paddies had a well-developed plow pan at a depth of ca. 15 cm that restricted percolation. Hence, the estimated fertilizer N loss can be mostly ascribed to atmospheric emissions. Urea is a fertilizer that is particularly prone to induce NH3 volatilization, because urea produces NH3 through hydrolysis, simultaneously increasing the liquid phase pH known to be the most effective factor in facilitating NH3 volatilization (Hayashi et al. Citation2008). However, the incorporation of urea into the plowed layer strongly inhibits NH3 volatilization (Hayashi et al. Citation2006, Citation2008). Furthermore, polymer-coated urea reduces NH3 volatilization. For example, the broadcast of polymer-coated urea with an application rate of 75 kg N ha–1 resulted in a 4–5% of NH3 volatilization loss, whereas that of non-coated urea was 16–21% (Xu et al. Citation2013). The NH3 volatilization loss of fertilizer N in this study was perhaps negligibly small because of the use of polymer-coated urea which was incorporated into the plowed layer. Denitrification is a series of microbial processes active in the anaerobic conditions typical of submerged rice paddies. Denitrification produces dinitrogen (N2) as the final product and nitrous oxide (N2O) as an intermediate product, part of which can be emitted to the atmosphere (Hayashi et al. Citation2015). A meta-analysis showed the mean emission factor of N2O from rice paddies with application rates of 90–100 kg N ha–1 of chemical fertilizers was 0.36 kg N ha–1, corresponding to ca. 0.4% of the applied fertilizer (Akiyama et al. Citation2006). Complete denitrification to N2 takes place in submerged rice paddies where strong anaerobic conditions develop to the extent that methane production occurs (Hayashi et al. Citation2015). A field experiment using urea broadcast with an application rate of 220 kg N ha–1 showed the N2 and N2O emissions of 13.5% and 0.2% to the application rate, respectively, corresponded to an N2/(N2+ N2O) emission ratio of 98.5%. Consequently, the estimated loss of fertilizer N as the N balance in this study, is mostly attributed to N2 emissions with denitrification.
The rice plants accumulated 126.4–144.6 kg N ha–1 of total N at the MT stage. Therefore, by subtracting the fertilizer-derived N in rice plants, the N sources other than the fertilizer supplied to the rice plants was 74.1–92.1 kg N ha–1 of the total N as net values (). N sources other than fertilizer are BNF, atmospheric deposition, and irrigation as input processes and mineralization as an internal process (Kyuma Citation2004). In previous studies at the Tsukuba FACE, a free-living BNF of 43.3–47.1 kg N ha–1 was reported during the cropping season (Hayashi et al. Citation2014), with net atmospheric deposition of 11.7–13.0 kg N ha–1 yr–1, and irrigation of 11.1–14.5 kg N ha–1 (Hayashi et al. Citation2017). It was estimated using a simple model (Hasegawa and Horie Citation1994) that the soil of this study (0–15 cm depth) provided ca. 90 kg N ha–1 of N via mineralization during the experimental period. Accordingly, the N source with the largest contribution was likely to be mineralization. CO2 did not affect the total N content in rice plants but significantly increased the N content originated from sources other than fertilizer (P < 0.05) (). This result agreed with the finding that E-[CO2] strengthened the overestimation of the difference method for the fertilizer-derived N content estimated as the difference in total N content between the fertilized and non-fertilized plots (Section 4.4). What was the N source mostly contributed to the increased N content due to E-[CO2]? The effect of CO2 on free-living BNF at the Tsukuba FACE was not significant (Hayashi et al. Citation2014). Atmospheric deposition and irrigation are events independent from E-[CO2]. A rice FACE study in China showed that E-[CO2] increased the cumulative soil N mineralization and the first-order rate constant of mineralization (Wu et al. Citation2020). Therefore, mineralization is the most likely N source to compensate the increased rice N demand due to E-[CO2]. This implies that E-[CO2] might lead to the long-term degradation of soil N fertility in the absence of appropriate fertilization management.
Table 6. Total nitrogen (N) content in the rice plants at the maturing stage separating its N sources
5. Conclusions
The advantage of this study using a 15N-labeled fertilizer was that the fertilizer-derived N in each part of rice plants and soil was able to be directly quantified, and therefore it was possible to evaluate N use efficiencies more accurately. It is noted that attention should be paid to the residual 15N in the soil for its effects on future experiments using 15N abundance.
E-[CO2] increased the rice biomass. However, the total N uptake of rice and the REs and AEs did not increase significantly to meet the additional N demand due to E-[CO2]. The maximum RE was 69% as the whole plant (64% as the aboveground part), even with the polymer-coated urea as a controlled-release fertilizer. On the other hand, E-[CO2] significantly increased the rice N uptake from sources other than fertilizer. The most likely source was mineralization. To achieve sustainable rice production and avoid long-term deficiency in soil N fertility under E-[CO2], a combination of periodic soil diagnosis and appropriate fertilization management techniques are required, such as the management of crop residues and other organic materials, and the application of the appropriate chemical fertilizers.
Supplemental Material
Download MS Word (1.3 MB)Acknowledgments
The authors deeply appreciate Ms. Hitomi Wakatsuki for data processing and Dr. Midori Morichi for analyzing the 15N abundance. The 15N abundance analysis was supported by the Advanced Analysis Center Research Program, NARO, Japan. The SAS program for statistical analysis was run on the supercomputer of AFFRIT, MAFF, Japan.
Disclosure statement
No potential conflict of interest was reported by the author(s).
Supplementary material
Supplemental data for this article can be accessed here.
Correction Statement
This article has been republished with minor changes. These changes do not impact the academic content of the article.
Additional information
Funding
References
- Ainsworth, E. A., and S. P. Long. 2020. “30 Years of Free-air Carbon Dioxide Enrichment (FACE): What Have We Learned about Future Crop Productivity and Its Potential for Adaptation?” Global Change Biology 27 (1): 27–49. doi:https://doi.org/10.1111/gcb.15375.
- Akiyama, H., X. Yan, and K. Yagi. 2006. “Estimations of Emission Factors for Fertilizer-induced Direct N2 O Emissions from Agricultural Soils in Japan: Summary of Available Data.” Soil Science and Plant Nutrition 52 (6): 774–787. doi:https://doi.org/10.1111/j.1747-0765.2006.00097.x.
- Bronson, K. F., F. Hussain, E. Pasuquin, and K. Ladha. 2000. “Use of 15 N-Labeled Soil in Measuring Nitrogen Fertilizer Recovery Efficiency in Transplanted Rice.” Soil Science Society of America Journal 64 (1): 235–239. doi:https://doi.org/10.2136/sssaj2000.641235x.
- Chalk, P. M., E. T. Craswell, J. C. Polidoro, and D. Chen. 2015. “Fate and Efficiency of 15N-labelled Slow- and Controlled-release Fertilizers.” Nutrient Cycling in Agroecosystems 102 (2): 167–178. doi:https://doi.org/10.1007/s10705-015-9697-2.
- Deryng, D., J. Elliott, C. Folberth, C. Müller, T. A. M. Pugh, K. J. Boote, D. Conway, et al. 2016. “Regional Disparities in the Beneficial Effects of Rising CO2 Concentrations on Crop Water productivity.” Nature Climate Change 6 (8): 1–7. doi:https://doi.org/10.1038/nclimate2995.
- Hasegawa, T., H. Sakai, T. Tokida, H. Nakamura, C. Zhu, Y. Usui, M. Yoshimoto, et al. 2013. “Rice Cultivar Responses to Elevated CO2 at Two Free-air CO2 Enrichment (FACE) Sites in Japan.” Functional Plant Biology 40 (2): 148–159. doi:https://doi.org/10.1071/FP12357.
- Hasegawa, T., H. Sakai, T. Tokida, Y. Usui, H. Nakamura, H. Wakatsuki, C. P. Chen, et al. 2019. “A High-yielding Rice Cultivar “Takanari” Shows No N Constraints on CO2 Fertilization.” Frontiers in Plant Science 10 :Article 361. doi:https://doi.org/10.3389/fpls.2019.00361.
- Hasegawa, T., and T. Horie. 1994. “A Simplified Model for Estimating Nitrogen Mineralization in Paddy Soil.” Japanese Journal of Crop Science 63 (3): 496–501. doi:https://doi.org/10.1626/jcs.63.496.
- Hayashi, K., K. Ono, K. Matsuda, T. Tokida, and T. Hasegawa. 2017. “Characteristics of Atmosphere–rice Paddy Exchange of Gaseous and Particulate Reactive Nitrogen in Terms of Nitrogen Input to a Single-cropping Rice Paddy Area in Central Japan.” Asian Journal of Atmospheric Environment 11 (3): 202–216. doi:https://doi.org/10.5572/ajae.2017.11.3.202.
- Hayashi, K., S. Nishimura, and K. Yagi. 2006. “Ammonia Volatilization from the Surface of a Japanese Paddy Field during Rice Cultivation.” Soil Science and Plant Nutrition 52 (4): 545–555. doi:https://doi.org/10.1111/j.1747-0765.2006.00053.x.
- Hayashi, K., S. Nishimura, and K. Yagi. 2008. “Ammonia Volatilization from a Paddy Field following Applications of Urea: Rice Plants are Both an Absorber and an Emitter for Atmospheric Ammonia.” Science of the Total Environment 390 (2–3): 485–494. doi:https://doi.org/10.2136/sssaj2000.641235x.
- Hayashi, K., T. Tokida, M. Kajiura, Y. Yanai, and M. Yano. 2015. “Cropland Soil–plant Systems Control Production and Consumption of Methane and Nitrous Oxide and Their Emissions to the Atmosphere.” Soil Science and Plant Nutrition 61 (1): 2–33. doi:https://doi.org/10.1080/00380768.2014.994469.
- Hayashi, K., T. Tokida, M. Y. Matsushima, K. Ono, H. Nakamura, and T. Hasegawa. 2014. “Free-air CO2 Enrichment (FACE) Net Nitrogen Fixation Experiment at a Paddy Soil Surface under Submerged Conditions.” Nutrient Cycling in Agroecosystems 98 (1): 57–69. doi:https://doi.org/10.1007/s10705-013-9595-4.
- Hayashi, K., T. Tokida, and T. Hasegawa. 2016. “FACEing up to Future Uncertainty: Free-air CO2 Enrichment Experiments in Japanese Rice Ecosystems.” In The Challenges of Agro-Environmental Research in Monsoon Asia, edited by K. Yagi and C. G. Kuo, 93–114. Tsukuba: National Institute for Agro-Environmental Sciences.
- Imbe, T., Y. Akama, A. Nakane, T. Hata, K. Ise, I. Ando, H. Uchiyamada, et al. 2004. “Development of a Multipurpose High-yielding Rice Variety Takanari.” Bulletin of the National Institute of Crop Science 5:35–51. in Japanese with English summary.
- IPCC. 2013. “Summary for Policymakers.” In Climate Change 2013: The Physical Science Basis, Contribution of Working Group I to the Fifth Assessment Report of the Intergovernmental Panel on Climate Change, edited by T. F. Stocker, D. Qin, G.-K. Plattner, M. Tignor, S. K. Allen, J. Boschung, A. Nauels, Y. Xia, V. Bex, and P. M. Midgley. 3-29. Cambridge and New York: Cambridge University Press.
- Jiang, Q., J. Zhang, X. Xu, G. Liu, and J. Zhu. 2020. “Effects of Free-air CO2 Enrichment (FACE) and Nitrogen (N) Supply on N Uptake and Utilization of Indica and Japonica Cultivars (Oryza Sativa L.).” Ecological Processes 9 (1): 35. doi:https://doi.org/10.1186/s13717-020-00238-5.
- Katoh, M., J. Murase, M. Hayashi, K. Matsuya, and M. Kimura. 2004. “Nutrient Leaching from the Plow Layer by Water Percolation and Accumulation in the Subsoil in an Irrigated Paddy Field.” Soil Science and Plant Nutrition 50 (5): 721–729. doi:https://doi.org/10.1080/00380768.2004.10408528.
- Kimball, B., K. Kobayashi, and M. Bindi. 2002. “Responses of Agricultural Crops to Free-air CO2 Enrichment.” Advances in Agronomy 77: 293–368. doi:https://doi.org/10.1016/S0065-2113(02)77017-X.
- Kobayashi, A., K. Hori, T. Yamamoto, and M. Yano. 2018. “Koshihikari: A Premium Short-grain Rice Cultivar – Its Expansion and Breeding in Japan.” Rice 11 (1): 15. doi:https://doi.org/10.1186/s12284-018-0207-4.
- Kyuma, K. 2004. ““Fertility Considerations for Paddy Soils (I) General Nutrient Balance and Nitrogen” Chap.” In Paddy Soil Science, 8. Kyoto: Kyoto University Press.
- Nakamura, H., T. Tokida, M. Yoshimoto, H. Sakai, M. Fukuoka, and T. Hasegawa. 2012. “Performance of the Enlarged Rice-FACE System Using Pure CO2 Installed in Tsukuba, Japan.” Journal of Agricultural Meteorology 68 (1): 15–23. doi:https://doi.org/10.2480/agrmet.68.1.2.
- Nakano, H., A. Makino, and T. Mae. 1997. “The Effect of Elevated Partial Pressures of CO2 on the Relationship between Photosynthetic Capacity and N Content in Rice Leaves.” Plant Physiology 115 (1): 191–198. doi:https://doi.org/10.1104/pp.115.1.191.
- NOAA (National Oceanic and Atmospheric Administration). 2021. “Trends in Atmospheric Carbon Dioxide.” Accessed 30 April 2021. https://www.esrl.noaa.gov/gmd/ccgg/trends/
- Parry, M. L., C. Rosenzweig, A. Iglesias, M. Livermore, and G. Fisher. 2004. “Effects of Climate Change on Global Food Production under SRES Emissions and Socio-economic Scenarios.” Global Environmental Change 14 (1): 53–67. doi:https://doi.org/10.1016/j.gloenvcha.2003.10.008.
- Rosenzweig, C., J. Elliott, D. Deryng, A. C. Ruane, C. Müller, A. Arneth, K. J. Boote, et al. 2014. “Assessing Agricultural Risks of Climate Change in the 21st Century in a Global Gridded Crop Model Intercomparison.” Proceedings of the National Academy of Sciences of the United States of America 111 (9): 3268–3273. doi:https://doi.org/10.5572/ajae.2017.11.3.202.
- Schleussner, C.-F., D. Deryng, C. Müller, J. Elliott, F. Saeed, C. Folberth, W. Liu, et al. 2018. “Crop Productivity Changes in 1.5°C and 2°C Worlds under Climate Sensitivity Uncertainty.” Environmental Research Letters 13 (6): 064007. doi:https://doi.org/10.1088/1748-9326/aab63b.
- Tokida, T., M. Adachi, W. Cheng, Y. Nakajima, T. Fumoto, M. Matsushima, H. Nakamura, M. Okada, R. Sameshima, and T. Hasegawa. 2011. “Methane and Soil CO2 Production from Current-season Photosynthates in a Rice Paddy Exposed to Elevated CO2 Concentration and Soil Temperature.” Global Change Biology 17 (11): 3327–3337. doi:https://doi.org/10.1111/j.1365-2486.2011.02475.x.
- Tokida, T., T. Fumoto, W. Cheng, T. Matsunami, M. Adachi, N. Katayanagi, M. Matsushima, et al. 2010. “Effects of Free-air CO2 Enrichment (FACE) and Soil Warming on CH4 Emission from a Rice Paddy Field: Impact Assessment and Stoichiometric Evaluation.” Biogeosciences 7 (9): 2639–2653. doi:https://doi.org/10.5194/bg-7-2639-2010.
- Tokida, T., W. Cheng, M. Adachi, T. Matsunami, H. Nakamura, M. Okada, and T. Hasegawa. 2013. “The Contribution of Entrapped Gas Bubbles to the Soil Methane Pool and Their Role in Methane Emission from Rice Paddy Soil in Free-air [CO2] Enrichment and Soil Warming Experiments.” Plant and Soil 364 (1–2): 131–143. doi:https://doi.org/10.1007/s11104-012-1356-7.
- Wu, Q., C. Zhang, X. Liang, C. Zhu, T. Wang, and J. Zhang. 2020. “Elevated CO2 Improved Soil Nitrogen Mineralization Capacity of Rice Paddy.” Science of the Total Environment 710: 136438. doi:https://doi.org/10.1016/j.scitotenv.2019.136438.
- Xia, L., X. Li, Q. Ma, S. K. Lam, B. Wolf, R. Kiese, K. Butterbach-Bahl, D. Chen, Z. Li, and X. Yan. 2020. “Simultaneous Quantification of N2, NH3 and N2O Emissions from a Flooded Paddy Field under Different N Fertilization Regimes.” Global Change Biology 26 (4): 2292–2303. doi:https://doi.org/10.1111/gcb.14958.
- Xu, M., D. Li, J. Li, D. Qin, Y. Hosen, H. Shen, R. Cong, and X. He. 2013. “Polyolefin-coated Urea Decreases Ammonia Volatilization in a Double Rice System of Southern China.” Agronomy Journal 105 (1): 277–284. doi:https://doi.org/10.2134/agronj2012.0222.
- Zhang, G., H. Sakai, T. Tokida, Y. Usui, C. Zhu, H. Nakamura, M. Yoshimoto, M. Fukuoka, K. Kobayashi, and T. Hasegawa. 2013. “The Effects of Free-air CO2 Enrichment (FACE) on Carbon and Nitrogen Accumulation in Grains of Rice (Oryza Sativa L.).” Journal of Experimental Botany 64 (11): 3179–3188. doi:https://doi.org/10.1093/jxb/ert154.
- Zhang, Q., Z. Yang, H. Zhang, and J. Yi. 2012. “Recovery Efficiency and Loss of 15N-labelled Urea in a Rice–soil System in the Upper Reaches of the Yellow River Basin.” Agriculture, Ecosystems & Environment 158: 118–126. doi:https://doi.org/10.1016/j.agee.2012.06.003.