
ABSTRACT
This study aimed to investigate the effects of using controlled release fertilizers with reduced application rates on nitrous oxide (N2O) gas emissions. For this, we monitored the N2O emissions released from soybean fields converted from rice paddies in Japan for three years, i.e., from 2017 to 2020, under six nitrogen fertilizer treatments: conventional (AC: ammonium chloride, 20 kg N ha−1), controlled release coated urea (CRCU: ammonium chloride, 5 kg N ha−1, coated urea, 15 kg N ha−1, total 20 kg N ha−1), controlled release coated nitrate (CRCN: coated calcium nitrate, 20 kg N ha−1), CRCU at a reduced rate (CRCU-R: 10 kg N ha−1), CRCN at a reduced rate (CRCN-R: 10 kg N ha−1), and no nitrogen fertilizer (NF: 0 kg N ha−1). The soil of the field was classified as Gleyic Fluvisol.
The annual N2O emissions of the CRCN treatment were significantly lower than those of the AC in the first and second years (p < 0.05) and were not significantly different in the third year, with reductions of 17–32%, while the same yield was maintained. The annual N2O emissions of the CRCU treatment tended to be lower than those of the AC for the three years, with reductions of 14–19%, although not statistically significant. This suggests that coated nitrate fertilizers were more effective in reducing N2O emissions, since nitrate produces this gas via denitrification only. In addition, the N2O emissions of the CRCU-R and CRCN-R treatments were 22–37% and 24–41% lower than that of the AC treatment, respectively. Although not statistically significant, these reductions were slightly greater than those obtained for the N2O emissions of CRCU and CRCN, suggesting the effect of further mitigation of N2O emissions through the reduction of application rate. Furthermore, the N2O emissions per yield tended to decrease due to the use of controlled release fertilizers for the three years, and further decrease due to the reduction of application rate. In conclusion, the use of controlled release fertilizers with reduced application rates can be regarded as an improved climate-smart soil management in soybean fields converted from rice paddies.
1. Introduction
Nitrous oxide (N2O) is a greenhouse gas whose effect is approximately 300 times that of carbon dioxide and has an atmospheric lifetime of approximately 120 years (IPCC, Citation2007). Soils are by far the largest overall source of N2O. Agricultural soils particularly are the largest anthropogenic source of this gas (Intergovernmental Panel on Climate Change (IPCC) Citation2007; Van Groenigen et al. Citation2010), owing to the direct or indirect (through recycling as manure) application of synthetic nitrogen fertilizers (Van Groenigen et al. Citation2010).
The world’s consumption of nitrogen fertilizer in 1961 was 11.8 Tg N year−1 and increased approximately nine times to 104.5 Tg N year−1 until 2010 (IFA Citation2016). N2O emissions are expected to increase further in the future owing to the growing consumption of nitrogen fertilizer accompanying the increase of food production. For this reason, improving the yields of major grains and stabilizing productions are important international issues. Although the yield of soybean, one of the main upland crops, has increased over the last century, the average worldwide yield remains at a low level. For instance, Japan achieved an average yield of 1.52 Mg ha−1 in 2019, while the world’s average yield was 2.77 Mg ha−1 (FAO Citation2020). More than 80% of soybean products in Japan are cultivated in paddy-upland fields where the groundwater level is relatively high; therefore, soil moisture is an issue affecting these plantations (Kokubun Citation2013). These reports indicate that maintaining or increasing the yield of soybean in fields converted from rice paddies is an important issue in Japan.
Fertilizer management, drainage improvement, and cultivation abandonment are effective measures for reducing N2O emissions in agricultural lands (Intergovernmental Panel on Climate Change (IPCC) Citation2007). Fertilizer management can be practical, and many studies have reported the effects of controlled release fertilizers (coated fertilizers) on reducing N2O emissions (Akiyama, Yan, and Yagi Citation2010; Noda Citation2001; Hasukawa et al. Citation2017).
Nitrous oxide is produced in the soil by the microbial processes of nitrification and denitrification after the application of nitrogen fertilizers (Akiyama and Tsuruta Citation2003). As such, N2O emissions are reduced by using coated calcium nitrate fertilizers that do not generate N2O derived from the nitrification process (Akiyama and Tsuruta Citation2002). In addition, N2O emissions are generally positively correlated with nitrogen application rates, with emission levels decreasing when the nitrogen application rate is low (Van Groenigen et al. Citation2010). However, a reduced nitrogen fertilizer application rate generally leads to reduced crop yield. Mitigating greenhouse gas emissions while maintaining productivity is, therefore, important for achieving sustainable agricultural productions. By focusing on maintaining or improving grain yield and reducing N2O emissions simultaneously with the appropriate levels of nitrogen fertilizer, it is possible to maximize economic viability and environmental conservation (Mosier et al. Citation2006). For instance, Van Groenigen et al. (Citation2010) proposed a method for evaluating N2O emissions per yield as agronomic productivity to environmental sustainability.
Hasukawa et al. (Citation2017) revealed that coated fertilizer application reduced the annual N2O emissions in a wheat-soybean cropping system converted from rice paddy fields, while the wheat and soybean production was equivalent to that of plantations using conventional fertilizers. However, the effect of reducing N2O emissions by using coated fertilizers in soybean cultivation was low and unstable compared to wheat cultivation and depended on rainfall. In this study, to develop a mitigation strategy aimed at reducing N2O emissions from soybean fields converted from rice paddies, we evaluated the effects of different types and application rates of nitrogen fertilizers on N2O emissions from soybean fields. Furthermore, we evaluated these effects on the optimal balance between soybean productivity and the mitigation of N2O emissions per yield.
2. Materials and Methods
2.1. Experimental plots and design
The experiment was performed for 3 years from 2017 to 2020 in the Shiga Agricultural Technology Promotion Center (Shiga Agricultural Technology Center) in Omi-Hachiman City, Shiga Prefecture, Japan (35°18ʹN, 136°12ʹE; mean annual air temperature: 14.5°C, annual precipitation: 1,731 mm). The experiment was carried out in soybean cultivation fields within a paddy-upland rotation system (paddy–wheat–soybean); therefore, the experimental field changed every year to study the soybean cultivated fields. In the crop rotation system, wheat was sown at the end of October following the rice harvest, and soybean was sown after the wheat harvest at the end of June. Each field was monitored for approximately one year from the soybean sowing period in June to the next paddy rice transplanting period in May of the following year. The soil of the experimental fields was classified as Gleyic Fluvisol according to the World Reference Base Classification (FAO, ISRIC, and ISSS, Citation2006), or as fine-textured gray lowland soil according to the classification of cultivated soil in Japan, third approximation (Nishina, Sudo, and Yagi et al. Citation2015). lists the soil chemical properties selected before the experiment.
Table 1. Selected physicochemical properties of the experimental fields soils
presents the experimental design. Six nitrogen fertilizer treatments were established: conventional (AC), a compound fertilizer based on ammonium chloride and an application rate of 20 kg N ha−1; controlled release fertilizer 1 (CRCU), a mixture of compound fertilizer containing ammonium chloride at 5 kg N ha−1 and coated urea (Ceracoat R50/70/90) at 15 kg N ha−1, with a total application rate of 20 kg N ha−1; controlled release fertilizer 2 (CRCN), a coated calcium (23%) nitrate fertilizer 70 days type of elution period, with a total application rate of 20 kg N ha−1; CRCU at a reduced rate (CRCU-R: 10 kg N ha−1), CRCN at a reduced rate (CRCN-R: 10 kg N ha−1), and a fertilizer without nitrogen (NF: 0 kg N ha−1). Each treatment had three replicate plots selected with randomized block design in each year. The area of each plot was approximately 20 m2.
Table 2. Fertilizer management of treatments
Soybeans were grown according to the Cultivation Technology Guideline of Shiga Prefecture (Shiga Prefectural Government Citation2012). The total amount of wheat residue (straw: 433–618 g m−2) of each year was incorporated in soil after harvest in mid-June. The soybean cultivar ‘Kotoyutaka’ (2017 and 2018) and ‘Kotoyutaka A1ʹ (2019) were sown from late-June to mid-July, using a narrow-line non-tillage cultivation method. Nitrogen fertilizer was applied to the entire area (5–10 cm deep) before sowing. Phosphorus and potassium were applied as PK compound fertilizers, following the Shiga Prefecture cultivation technology guidelines. The planting density was about 25 plants m−2 (length between rows 30 cm, spacing between plants 14 cm). Soybeans were harvested in mid- to late-November. The total amount of soybean residue (stem and pod) was incorporated in soil after harvest from mid-November to early December.
2.2. Measurement of N2O emissions
Nitrous oxide gas fluxes were measured using the closed-chamber method (Yagi Citation1997). Gas was collected once per week between 9:00 AM and 12:00 AM. The frequency of measurement was approximately two to three times per week immediately after basal fertilizer application, and biweekly from January to March, the post-soybean fallow period.
An acrylic chamber (60 cm long, 30 cm wide, and 50 cm high) was used for the measurements. To facilitate covering the thick soybean plants inside the chamber during the latter soybean growth periods, the number of the soybean plants inside the chamber was reduced to two in the area of 30 cm × 14 cm. The chamber base was inserted into the soil up to a depth of 8 cm. The height of the chamber was set to 100 cm from mid-August until harvesting period according to the soybean growing height. For gas sampling, the gas in the chamber was mixed several times with a 50 mL syringe, and then 30 mL were sampled three times at 10-min intervals. The gas concentration was analyzed based on the method of Sudo (Citation2012) using a gas chromatograph (GC; GC-14A, Shimadzu, Kyoto, Japan) with an electron capture detector. Nitrous oxide flux was calculated as follows based on Hasukawa et al. (Citation2013).
F = ρ · V/A · ΔC/Δt · 273/T
Here, F is N2O flux (μg N m−2 h−1), ρ is the gas density in the standard state (N2O-N: 1.25 kg m−3), V is the volume of air in the chamber (m3), A is the bottom area of the chamber (m2), and ΔC/Δt is the average rate of increase of gas concentration in the chamber (10−9 m3 m−3 h−1), T is the temperature (K) inside the chamber. Cumulative N2O emissions were calculated using the trapezoidal integration method.
The fertilizer-induced N2O emission factor (EF) was also evaluated in this research. It is a robust predictor of N2O fluxes and has been used to estimate national greenhouse gas emissions (IPCC, Citation2006).
The EF was calculated as follows:
EF (%) = (N2O emissions in plots where nitrogen fertilizer was applied – N2O emissions in NF)/(nitrogen fertilizer application rate) × 100
2.3. Measurement of the selected field properties
The air and soil (5 cm deep) temperatures inside the chamber at the time of collection were measured using a temperature data logger (Ondotori, T & D, Matsumoto, Japan). The volumetric moisture content (0–12 cm deep) was measured at five locations around the chamber using a portable soil moisture meter (HydroSense, Campbell, UT, USA) at the time of gas sampling. The solid phase ratio between the time of soybean harvest and the end of the experimental period was 35.6%–40.4% in the first year, 36.4%–39.9% in the second year, and 30.5%–36.8% in the third year. Using this for the volumetric moisture content, the water-filled pore space (WFPS; soil moisture), defined as the ratio of water volume to the soil pore volume, was calculated and the average value for each treatment was determined. To obtain the cumulative precipitation values, meteorological observation data from the Shiga Agricultural Technology Center were used.
The yield of soybean was measured at maturity in each plot with a survey area of 1.2 m2 (1.0 m × 4 lines). The grain weight of soybeans with a grain diameter of at least 5.5 mm was determined and converted to the value at 15.0% moisture. The selected soil properties were investigated based on the Soil Nutrient Measurement Method Committee (Citation1983) and the Soil Environment Analysis Method Editing Committee (Citation1997). Before starting the experiment, five soil samples were collected from the overall experimental field, mixed and air-dried, 2.0 mm sieved, and subjected to soil chemical analysis. For the three-phase distribution, the soil core samples (100 ml) were collected at two locations from each treatment after soybean harvest. The available phosphate was measured using the Truog method (Nanzyo Citation1997). The inorganic nitrogen concentrations of ammonium nitrogen (NH4-N), nitrite nitrogen (NO2-N), and nitrate nitrogen (NO3-N) in the soil were determined with an automatic nitrogen analyzer (TRAACS 2000, Bran+Luebbe, Norderstedt, Germany) for all collected soil samples. The soil samples in all plots were collected from a depth of 0–10 cm around the chamber when gas fluxes were measured. The nitrogen content of soybeans collected at maturity in each plot was analyzed using the Kjeldahl method.
2.4. N2O emissions per yield
A balance between crop productivity and mitigation of greenhouse gases is important for sustainable agriculture. Mosier et al. (Citation2006) introduced the concept of greenhouse gas intensity by dividing Global Warming Potential by crop yield. Expressing N2O emissions per unit of yield can account for the management impacts on both N2O emissions and yield, and might provide a useful metric for greenhouse gas inventories (Venterea, Maharjan, and Dolanet Citation2011).
In this study, the N2O emissions per yield were calculated as follows:
N2O emission per yield (kg N2O-N Mg−1) = (N2O emission in each treatment)/(soybean yield in each treatment).
2.5. Statistical analysis
A one-way analysis of variance with the type of treatment was performed for N2O emissions, emissions factor, soybean yield (grain weight), nitrogen accumulation of the aboveground plant parts, and N2O emission per yield, followed by a Tukey’s test. In this study, the level of statistical significance was set at 0.05 (R Core Team Citation2017).
3. Results
3.1. N2O emissions
The N2O flux during the 3 years is shown in (a), and the soil temperature, precipitation, WFPS, and inorganic nitrogen (NH4-N and NO3-N) concentrations during the 3 years are shown in (b–e). The annual N2O emissions and the annual EFs for the 3 years are listed in .
Table 3. N2O emissions, yield, and N2O emission per yield of soybean during the experimental period
Figure 1. Changes in (a) N2O flux, (b) soil temperature, (c) precipitation and WFPS, and (d, e) soil inorganic nitrogen concentration in the first year. Small figures on the right side of (a), (d), and (e) are enlarged ones for the period immediately after fertilization.
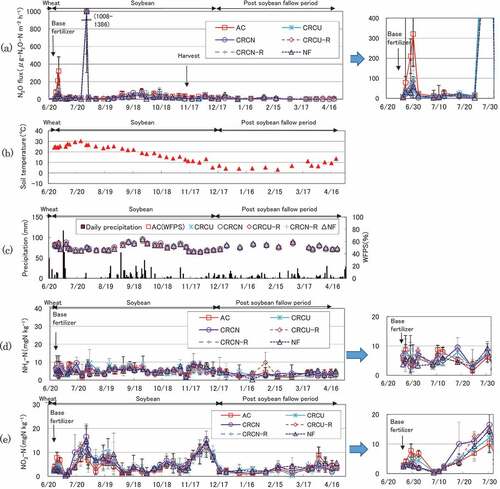
Figure 2. Changes in (a) N2O flux, (b) soil temperature, (c) precipitation and WFPS, and (d, e) soil inorganic nitrogen concentration in the second year. Small figures on the right side of (a), (d), and (e) are enlarged ones for the period immediately after fertilization.
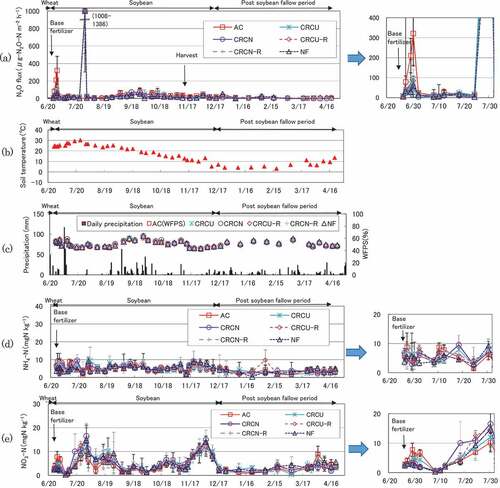
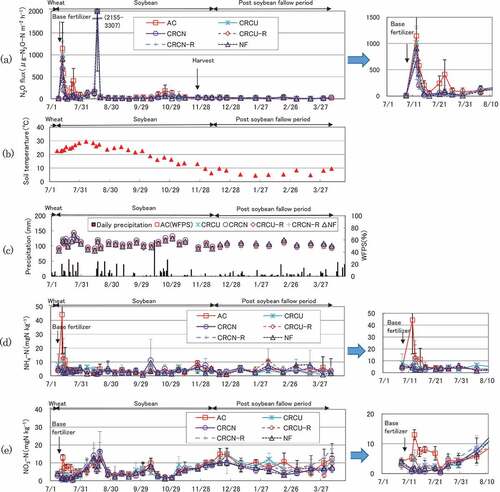
Figure 3. Changes in (a) N2O flux, (b) soil temperature, (c) precipitation and WFPS, and (d, e) soil inorganic nitrogen concentration in the third year. Small figures on the right side of (a), (d), and (e) are enlarged ones for the period immediately after fertilization.
3.1.1. N2O flux
The N2O flux had two periods with relatively high peaks within a year: just after the base fertilization and after rainfall under high temperature conditions from the end of June to August ( (a)). The N2O flux increased immediately after the base fertilization (within one week after application) for 3 years. The highest peak was obtained in the third year (690–1,145 μg N m−2 h−1). N2O flux showed a higher peak after rainfall under high temperature conditions than immediately after the application of basal fertilizer (within 40 days after application) for 3 years. The peak after rainfall under high temperature was highest in the third year (2,155–3,307 μg-N m−2 h−1), followed by the second and first years. Over the 3 years, the N2O flux during the fallow period after soybean cultivation (post soybean fallow period) remained lower in all plots than that during the soybean cultivation period, except for a temporary increase.
3.1.2. Temperature and precipitation
The soil temperature (5 cm deep) ( (b)) did not show a clear difference between years and treatments and remained above 25°C from the sowing period to mid-August; however, it gradually decreased after September and was approximately 10°C during the mature period (November). In winter, the temperature was low (5–10°C).
The cumulative precipitation ( (c)) was 1,482 mm in the first year, 1,040 mm in the second year, and 1,196 mm in the third year. Seasonal variation in all three years, namely, there was 133 mm of precipitation in early August and 289 mm in late October in the first year, 204 mm on July 5–7 and 116 mm in late September in the second year, 147 mm in mid-July 102 mm in late-July, 97 mm in mid-August, and 120 mm in late October in the third year.
3.1.3. WFPS
The WFPS throughout the year tended to increase with precipitation ( (c)). There was no clear difference in the WFPS values between the treatments and years. The WFPS ranges were relatively constant during the 3 years: 43%–62% (average 53% in AC) in the first year, 42%–65% (average 50% in AC) in the second year, and 41%–72% (average 53% in AC) in the third year. Notably, in the third year, the maximum of WFPS was slightly higher than in the other two years.
3.1.4. Soil inorganic nitrogen concentration
The NH4-N concentration increased immediately after fertilization in the first and third years, with the NO3-N concentration subsequently increasing, as typically observed in AC ( (d), (e)). In the second year, although the NO3-N concentration increased immediately after fertilization (from late-June to early-July), the NH4-N concentration did not. After the initial peaks, the NH4-N concentration remained low. However, the NO3-N concentration temporarily increased after soybean harvest in the second and third years. There were no clear differences between any of the treatments. The NO2-N concentration remained almost zero (detector limit: 0.06 mg L−1) in all plots throughout the 3 years.
3.1.5. N2O emissions
In the first year, the annual N2O emissions in CRCN, CRCU-R, CRCN-R, and NF were significantly lower than those in AC (CRCN: p < 0.05; CRCU-R, CRCN-R, and NF: p < 0.01), with reductions of 32%, 37%, 41%, and 47%, respectively. In the second year, the annual N2O emissions in CRCN, CRCU-R, CRCN-R, and NF were significantly lower than those in AC (CRCN, CRCU-R, CRCN-R, and NF: p < 0.05), with reductions of 27%, 30%, 31%, and 32%, respectively. The annual N2O emissions in CRCU tended to be lower than those in AC in the first and second year, with reductions of 18%, 19%, although the effects were not statistically significant. In the third year, the annual N2O emissions were not significantly different among the treatments, with reductions of 14%, 17%, 22%, 24%, and 28%, respectively. The annual N2O emissions were highest in the third year, followed by the second and first years. Both the use of controlled release fertilizer and reduced application rates actually decreased the annual N2O emissions, although the effects were not always statistically significant.
3.1.6. The fertilizer-induced N2O emission factor (EF)
In the first year, the annual EFs ranged from 1.30% in CRCN-R to 4.97% in AC, but there were no significant differences among the treatments. In the second year, the annual EFs ranged from 0.29% in CRCN-R to 4.59% in AC, but there were no significant differences among the treatments. In the third year, the annual EFs ranged from 2.05% in CRCN-R to 7.70% in AC, but there were no significant differences among the treatments. The annual EFs tended to be highest in AC and lowest in CRCN-R for all three years. Both the use of controlled release fertilizer and reduced application rates actually decreased the annual EFs, although the effects were not statistically significant.
3.2. Yield and nitrogen accumulation of soybean plantations
The annual yield and nitrogen accumulation for the 3 years are listed in . In the first year, the yield of soybean ranged from 3.03 Mg ha−1 in CRCU-R to 3.91 Mg ha−1 in AC, but there were no significant differences among the treatments. In the second year, the yield ranged from 2.39 Mg ha−1 in NF to 2.96 Mg ha−1 in CRCU-R, but there were no significant differences among the treatments. In the third year, the yield ranged from 2.84 Mg ha−1 in NF to 3.73 Mg ha−1 in CRCU-R, and the yield in NF was significantly lower than that in other treatments (p < 0.01). The soybean yields were similar in the first and third years and slightly lower in the second year. The nitrogen accumulation of the aboveground plant parts showed the same tendency as the yield, and there were no significant differences among the treatments, except for NF in the third year (p < 0.05). In conclusion, differences in yield and nitrogen accumulation were not statistically significant among the nitrogen fertilizer treatments.
3.3. N2O emissions per yield
The annual N2O emissions per yield for the 3 years are listed in . In the first year, the N2O emissions per yield ranged from 0.30 kg N2O-N Mg−1 in NF to 0.55 kg N2O-N Mg−1 in AC, but there were no significant differences among the treatments, except for the NF and AC (p < 0.05). In the second year, the annual N2O emissions per yield ranged from 0.70 kg N2O-N Mg−1 in CRCU-R to 0.98 kg N2O-N Mg−1 in AC, but there were no significant differences among the treatments. In the third year, the annual N2O emissions per yield ranged from 1.15 kg N2O-N Mg−1 in CRCU-R to 1.51 kg N2O-N Mg−1 in AC, but there were no significant differences among the treatments. The annual N2O emissions per yield were highest in AC for all three years among the treatments. Both the use of controlled release fertilizer and reduced application rates actually decreased the annual N2O emissions per yield, although the effects were not statistically significant.
4. Discussion
4.1. Temporal changes in the N2O emissions and their influencing factors
4.1.1. N2O flux
In our study, two large peaks of N2O flux were observed during the early stages of growth of soybean plants throughout 3 years ( (a)), namely from the end of July to August. The two peaks may be influenced not only by soil moisture but also by temperature, as temperature was positively correlated with N2O flux (Aguilera et al., Citation2013). The first large peak occurred immediately after the application of basal fertilizer, and the N2O flux increased most in the AC treatment, followed by the CRCU, and the lowest in the CRCN treatment ( (a)). The soil NH4-N and NO3-N concentrations in the CRCU treatment tended to have a slower increase than in the AC soil ( (d), (e)), which was attributed to the slower release of NH4+ from the controlled release fertilizer that was applied. In addition, the NH4-N concentration in the CRCN treatment was consistently very low, while the NO3–N concentration was high because coated NO3− was applied; we suppose these trends caused the reduced N2O flux, due to minimal nitrification. In the CRCU-R and CRCN-R treatments, the peak N2O flux tended to decrease with lower application rates, but the concentrations of NH4-N and NO3-N were almost the same. There was no difference in WFPS at the first peak among treatments ( (c)). Namely, the WFPS was approximately 50% in the first and second years, and approximately 60% in the third year when the peak was large. As previously reported by Smith et al. (Citation2003), the N2O flux tended to increase with the WFPS to approximately 60%.
The second large peak occurred from the end of July to the middle of August, when there was no significant difference in N2O flux among the treatments. The soil NH4-N and NO3-N concentrations were consistently relatively low, while the WFPS increased up to approximately 60%. In addition, Kusa, Sawamoto, and Hu et al. (Citation2010) reported that N2O production due to denitrification can occur in a local anaerobic environment such as inside soil aggregates even under relatively aerobic conditions. Judging from these points, it seemed that the second large peak of N2O flux mainly originated from the denitrification process rather than nitrification.
4.1.2. N2O emissions
The annual N2O emissions of the CRCN treatment were significantly lower than those of the AC in the first and second years (p < 0.05, ) and were not significantly different in the third year. The annual N2O emissions of the CRCU treatment tended to be lower than those of the AC for the three years, although not statistically significant. The annual N2O emissions tended to be reduced by the use of controlled release fertilizers.
The cumulative N2O emissions in the early stages of growth are shown in . N2O emissions in the CRCN treatment were significantly lower than those in the AC treatment in the first and second years, while those in the CRCU treatment were significantly lower than those of the AC treatments in the second year. These results indicate that coated calcium nitrate is more effective in reducing N2O emissions than coated urea, probably because N2O is produced only from denitrification when coated calcium nitrate is used, while N2O is produced from both denitrification and nitrification when using coated urea. Hasukawa et al. (Citation2013) reported that the effect of reducing N2O emissions in soybean cultivation by coated urea was not stable, but our results suggested that the problem could be solved by utilizing coated calcium nitrate. In addition, the results of our study performed in soybean fields converted from paddy fields with poor drainage (Gleyic Fluvisols) were similar to those reported by Akiyama and Tsuruta (Citation2002) for the upland of Andosols, which had good drainage. Accordingly, the effect of reducing N2O emissions by coated calcium nitrate can be observed regardless of the level of soil drainage. In the CRCU-R and CRCN-R treatments, N2O emissions tended to decrease when lower application rates were used, as previously reported by Shcherbak, Millar, and Philip Robertson (Citation2014).
The NF treatment had the highest average reduction rate of N2O emissions, followed by the CRCN-R, CRCU-R, CRCN, and CRCU. The reduction rate was greater during the early stages of growth than during the entire growth period. Namely, N2O emissions decreased with the increase in the rate of controlled release fertilizer and with reduced nitrogen application rate in addition to the use of nitrate-N as the source of N in coated fertilizer. Akiyama, Yan, and Yagi (Citation2010) found out, in their meta-analysis, that coated fertilizers reduced N2O emissions by an average of 35% (95% confidential interval: 14% to 58%). They also reported that the effectiveness of coated fertilizers in reducing N2O emissions differed with soil type; although N2O emissions had a 77% reduction in the grasslands of Gleysol, their effectiveness was lower in the upland of Andosol. In our study with Gleyic Fluvisols, a similar reduction rate was obtained (14%–32%).
4.2. Relationship between fertilizer application rate and N2O emissions
The annual EFs for the 3 years were 4.59–7.70% in AC, 1.89–3.86% in CRCU, 0.70–2.87% in CRCN, 0.71–2.95% in CRCU-R, and 0.29–2.05% in CRCN-R (). These values were higher than the EF of 0.62% ± 0.48% obtained for upland fields in Japan (Akiyama, Yan, and Yagi Citation2006), and EF of 1% reported by the IPCC (Intergovernmental Panel on Climate Change (IPCC) Citation2006). In our survey, the high EF was considered to be due to the low fertilizer application rate of 10–20 kg N ha−1 for nitrogen-fixing soybeans, as supported by Shcherbak, Millar, and Philip Robertson (Citation2014).
The annual EFs in CRCU, CRCN, CRCU-R, and CRCN-R for the 3 years were lower by 39–59%, 63–85%, 61–85%, and 73–94% than those in AC, respectively. Both the use of controlled release fertilizers and reduced application rates decreased the EF, although this effect was not statistically significant. Shcherbak, Millar, and Philip Robertson (Citation2014) reported that EF was significantly lower for controlled release urea treatments than for treatments using conventional synthetic fertilizers.
Fertilized nitrogen is required for soybean production; it is highly effective, especially when the yield is low. For example, the nitrogen fixation function of rhizobia is small due to environmental factors such as drought and shortage of O2 due to submergence (Shimada Citation2013) or continuous cropping (Tamura Citation2000). Therefore, it is common to apply a small amount of nitrogen (20 kg N ha−1) as basal fertilizer at the time of sowing to support the early stages of growth before active nodule development and nitrogen fixation. In addition, Takakai, Takeda, and Kon et al. (Citation2010) showed that the nitrogen balance in paddy-converted soybean fields was negative, and appropriate nitrogen fertilization and organic matter application were required to achieve sustainable productions. The low EF obtained in treatments where controlled release fertilizers were used suggests that the nitrogen release rate from these fertilizers matched the nitrogen requirements of soybean plants. Although reduced nitrogen application rate is also effective in terms of nitrogen utilization efficiency, the balance between yield and N2O emissions should be considered.
4.3. Relationship between soybean yield and N2O emissions
The annual N2O emissions per yield for the 3 years were 0.55–1.51 kg N2O-N Mg−1 in AC, 0.47–1.39 kg N2O-N Mg−1 in CRCU, 0.38–1.37 kg N2O-N Mg−1 in CRCN, 0.46–1.15 kg N2O-N Mg−1 in CRCU-R, 0.35–1.16 kg N2O-N Mg−1 in CRCN-R, and 0.30–1.42 kg N2O-N Mg−1 in NF (). In all treatments, the third year had the highest N2O emissions per yield and the first year had the lowest, based on the trends of N2O emissions and yield. The annual N2O emissions per yield in the CRCU-R and CRCN-R treatments tended to be reduced steadily throughout the three years compared to those in the AC, although not statistically significant. The combination of controlled release fertilizers with reduced nitrogen application rates was effective in maintaining the yield while reducing N2O emissions. Soybeans produced by this combination are certified as environmentally friendly agricultural products in Shiga Prefecture. Therefore, this combination can reduce the costs and increase the value of the products. Van Groenigen et al. (Citation2010) reported that yield-scaled N2O emissions have a significant negative relationship with nitrogen fertilizer use efficiency (defined as the percentage of nitrogen fertilizer taken up by the aboveground parts of the plant), indicating that increasing nitrogen fertilizer use efficiency is directly linked to minimizing N2O fluxes.
Relatively high soil T-C and T-N concentrations can ensure the growth of soybean plants during the early stages, which leads to stable soybean production. However, the yield level can be further improved by using controlled release fertilizers that can supply nitrogen after the flowering period, because nitrogen absorption of soybean generally increases after the flowering period (Furuhata, Adachi, and Ohono Citation2011). In our survey, a certain level of yield could be secured even in NF. This was considered to be because the soil was relatively fertile and soybean was a nitrogen-fixing plant. Venterea, Coulter, and Dolanet (Citation2016) further reported that optimizing both the application timing and source of nitrogen can allow for a moderate reduction in the nitrogen rate that does not affect grain yield but decreases N2O. In such cases, N2O emissions per yield could be reduced by decreasing the basal nitrogen application rate and increasing the nitrogen utilization efficiency.
4.4. Crop field rotation system and greenhouse gas emissions
Snyder, Bruulsema, and Jensen (Citation2007) reported that management practices such as balanced nitrogen fertilizer management and crop rotation lead to reduced N2O emissions. Adviento-Borbe et al. (Citation2007) reported that CO2 equivalent emissions could be reduced by switching continuous maize cropping to maize-soybean crop rotation. Hasukawa et al. (Citation2021) reported that the net greenhouse gas balance (CH4, N2O and CO2) in the paddy-upland rotation (four cultivations (wheat–soybean–rice–rice) over 3 years) and continuous paddy rice fields were estimated to be 2.38 and 7.51 Mg CO2 ha−1 year−1, respectively, highlighting a 68% reduction in the paddy-upland rotation system. To achieve a good balance between the mitigation of greenhouse gas emissions and crop productivity, it is necessary to verify the effectiveness of comprehensive measures that combine land use management, such as crop and field rotation, with fertilization management.
5. Conclusions
The use of controlled release fertilizers with reduced application rates was able to significantly reduce N2O emissions. Moreover, it reduced N2O emission factors while maintaining soybean yield, thereby reducing N2O emissions per yield. As such, this practice can be regarded as a climate-smart soil management (Paustian et al. Citation2016) for soybean fields converted from rice paddies.
Acknowledgments
This study was supported by the ‘‘Basic Survey on Farmland Soil Greenhouse Gas Emissions’’ project of the Ministry of Agriculture, Forestry and Fisheries from 2017 to 2020. We thank Prof. Kazuyuki Inubushi, Chiba University for acting as external experts on this project and for providing valuable comments throughout the study, and Dr. Yasuhito Shirato of the Institute for Agro-Environmental Sciences, National Agricultural and Food Research Organization (NARO), for their helpful advice and support. Furthermore, we thank the staff of the Agricultural Technology Promotion Center of Shiga Prefecture for their support.
Disclosure statement
No potential conflict of interest was reported by the author(s).
Additional information
Funding
References
- Adviento-Borbe, M. A. A., M. L. Haddix, D. L. Binder, D. T. Walters, and A. Dobermann. 2007. “Soil Greenhouse Gas Fluxes and Global Warming Potential in Four High-yielding Maize Systems.” Global Change Biology 13 (9): 1972–1988. doi:10.1111/j.1365-2486.2007.01421.x.
- Aguilera, E., L. Lassaletta, A. Sanz-Cobena, J. Garnier, and A. Vallejo. 2013. “The Potential of Organic Fertilizers and Water Management to Reduce N2O Emissions in Mediterranean Climate Cropping Systems. A Review.” Agriculture, Ecosystems & Environment 164: 32–52. doi:10.1016/j.agee.2012.09.006.
- Akiyama, H., and H. Tsuruta. 2002. “Effect of Chemical Fertilizer Form on N2O, NO and NO2 Fluxes from Andisol Field.” Nutrient Cycling in Agroecosystems 63 (2/3): 219–230. doi:10.1023/A:1021102925159.
- Akiyama, H., and H. Tsuruta. 2003. “Nitrous Oxide, Nitric Oxide, and Nitrogen Dioxide Fluxes from Soils after Manure and Urea Application.” Journal of Environmental Quality 32 (2): 423–431. doi:10.2134/jeq2003.4230.
- Akiyama, H., X. Yan, and K. Yagi. 2006. “Estimations of Emission Factors for Fertilizer-induced Direct N2O Emissions from Agricultural Soils in Japan: Summary of Available Data.” Soil Science and Plant Nutrition 52 (6): 774–787. doi:10.1111/j.1747-0765.2006.00097.x.
- Akiyama, H., X. Yan, and K. Yagi. 2010. “Evaluation of Effectiveness of Enhanced-efficiency Fertilizers as Mitigation Options for N2O and NO Emissions from Agricultural Soils: Meta-analysis.” Global Change Biology 16 (6): 1837–1846. doi:10.1111/j.1365-2486.2009.02031.x.
- FAO, ISRIC, ISSS. 2006. “World Reference Base for Soil Resources 2006, A Framework for International Classification Correlation and Communication”, World Soil Resources Reports 103, pp. 1–128. Rome, Italy.
- FAO. 2020: “FAOSTAT Database”. 2020, Available online: http://faostat.fao.org/
- Furuhata, M., K. Adachi, and S. Ohono. 2011. “Influence of Field Drainage on Dry Matter and Seed Production of Soybean in the Hokuriku District of Japan.” Japanese Journal of Crop Science 80 (1): 65–72. in Japanese with English summary. doi:10.1626/jcs.80.65.
- Hasukawa, H., S. Toritsuka, Y. Takahashi, S. Sudo, N. Oura, K. Nishina, and T. Sano. 2017. “Effect of Controlled Release Fertilizer on Nitrous Oxide Emission from Gray Lowland Soil of a Wheat–soybean Cropping System.” Japanese Journal of Soil Science and Plant Nutrition 88: 109–119. in Japanese with English summary.
- Hasukawa, H., Y. Inoda, S. Toritsuka, S. Sudo, N. Oura, T. Sano, Y. Shirato, and J. Yanai. 2021. “Effect of Paddy-upland Rotation System on the Net Greenhouse Gas Balance as the Sum of Methane and Nitrous Oxide Emissions and Soil Carbon Storage: A Case in Western Japan.” Agriculture 11 (1): 52. doi:10.3390/agriculture11010052.
- Hasukawa, H., Y. Takahashi, S. Toritsuka, S. Sudo, and K. Nishina. 2013. “Influence of Different Soil Management Methods during the Non-irrigation Period on Annual Greenhouse Gas Emissions from Rice Paddies.” Japanese Journal of Soil Science and Plant Nutrition 84: 462–472. in Japanese with English summary.
- IFA 2016: “IFA Statistics”. International Fertilizer Industry Association (IFA), Paris, France. Accessed April, 2021. http://www.fertilizer.org/Statistics
- Intergovernmental Panel on Climate Change (IPCC). 2007. Couplings between Changes in the Climate System and Biogeochemistry. New York: Cambridge Univ. Press.
- Intergovernmental Panel on Climate Change (IPCC). 2006. “2006 IPCC Guidelines for National Greenhouse Gas Inventories.” In Agriculture, Forestry and Other Land Use, edited by E. Eggleston, L. Buendia, K. Miwa, T. Ngara, and K. Tanabe, Vol. 4, 11.1-11.54. Kanagawa, Japan: Institute for Global Environmental Strategies.
- Kokubun, M. 2013. “Genetic and Cultural Improvement of Soybean for Waterlogged Conditions in Asia.” Field Crops Research 152: 3–7. doi:10.1016/j.fcr.2012.09.022.
- Kusa, K., T. Sawamoto, R. Hu, Hatano, R. et al. 2010. “Comparison of N2O and CO2 Concentrations and Fluxes in the Soil Profile between a Gray Lowland Soil and an Andosol.” Soil Science and Plant Nutrition 56 (1): 186–199. DOI:10.1111/j.1747-0765.2009.00439.x.
- Mosier, A. R., A. D. Halvorson, C. A. Reule, and X. J. J. Liu. 2006. “Net Global Warming Potential and Greenhouse Gas Intensity in Irrigated Cropping Systems in Northeastern Colorado.” Journal of Environmental Quality 35 (4): 1584–1598. doi:10.2134/jeq2005.0232.
- Nanzyo, M. 1997. “V. 12 Available Nitrogen”. Analysis Methods of Soil Environment, edited by. T. Konno. 262–273. Hakuyusha, Tokyo. Japanese Society of Soil Science and Plant Nutrition.
- Nishina, K., S. Sudo, K. Yagi, Sano, T., Takata, Y., Obara, H., Eguchi, S., Oura, N., Yano, S., Ohkoshi, S., et al. 2015. “Multi-site Monitoring for $$\hbox {N}_2\hbox {O}$$ N 2 O Emission Factors of Synthetic Fertilizer in Various Soils with Different Redoximorphic Features across Japan.” Nutrient Cycling in Agroecosystems 103 (1): 87–99. DOI:10.1007/s10705-015-9723-4.
- Noda, S. 2001. “Application and Use of Fertilizers for the Reduction of Nitrous Oxide Emissions from Upland Soils.” Japanese Journal of Soil Science and Plant Nutrition 72: 575–581. in Japanese with English summary.
- Paustian, K., J. Lehmann, S. Ogle, D. Reay, G. P. Robertson, and P. Smith. 2016. “Climate-smart Soils.” Nature 532 (7597): 49–57. doi:10.1038/nature17174.
- R Core Team. 2017. R: A Language and Environment for Statistical Computing. Vienna, Austria: R Foundation for Statistical Computing.
- Shcherbak, I., N. Millar, and G. Philip Robertson. 2014. “Global Metaanalysis of the Nonlinear Response of Soil Nitrous Oxide (N2O) Emissions to Fertilizer Nitrogen.” Proceedings of the National Academy of Sciences of the United States of America 111 (25): 9199–9204. doi:10.1073/pnas.1322434111.
- Shiga Prefectural Government. 2012. Guidelines for Wheat and Soybeans Cultivation that Sell, 1–177. Shiga Prefectural Government, Otsu. in Japanese.
- Shimada, S. 2013. “A New Framework for Study of Irrigated Paddy Rice and Upland Crops Rotation Farming and Its Relation to Soil and Plant Nutrition Science. 2. Expectations of Integrated Manuring Technology for Productive Soybean Cultivation on Drained Paddy Fields”. Japanese Journal of Soil Science and Plant Nutrition. 84. 208–214. in Japanese.
- Smith, K. A., T. Ball, F. Conen, K. E. Dobbie, J. Massheder, and A. Rey. 2003. “Exchange of Greenhouse Gases between Soil and Atmosphere: Interactions of Soil Physical Factors and Biological Processes.” European Journal of Soil Science 54 (4): 779–791. doi:10.1046/j.1351-0754.2003.0567.x.
- Snyder, C. S., T. W. Bruulsema, and T. L. Jensen. 2007. Greenhouse Gas Emissions from Cropping Systems and the Influence of Fertilizer Management – A Literature Review. Norcross, GA: International Plant Nutrition Institute.
- Soil Environment Analysis Method Editing Committee. 1997. Soil Environmental Analysis, 1–427. Hakuyusha, Tokyo. Japanese Society of Soil Science and Plant Nutrition.
- Soil Nutrient Measurement Method Committee. 1983. Soil Nutrient Analysis, 1–440. Yokendo, Tokyo. Agriculture, Forestry and Fisheries Technology Council.
- Sudo, S. 2012. “Recent Advances in Research on Soil Redox Recations: Chasing Redox Recation in Soil. 3. Measurement Method of Greenhouse Gas Emission from Agricultural Field by Gas Chromatograph”. Japanese Journal of Soil Science and Plant Nutrition. 83. 599–605. in Japanese.
- Takakai, F., M. Takeda, K. Kon, Inoue, K., Nakagawa, S., Sasaki, K., Chida, A., Sekiguchi, K., Takahashi, T., Sato, T., et al. 2010. “Effect of Preceding Compost Application on the Nitrogen Budget in an Upland Soybean Field Converted from a Rice Paddy Field on Gray Lowland Soil in Akita, Japan.” Soil Science and Plant Nutrition 56 (5): 760–772. DOI:10.1111/j.1747-0765.2010.00503.x.
- Tamura, Y. 2000. “Development of Method of Producing High-Yielding Soybean Crops with Nitrogen Fixation in the Northern Area of Tohoku District.” Bulletin of the National Agricultural Research Center of Tohoku Region Station 97: 1–73. in Japanese with English summary.
- Van Groenigen, J. W., G. L. Velthof, O. Oenema, K. J. Van Groenigen, and C. V. Kessel. 2010. “Towards an Agronomic Assessment of N2O Emissions: A Case Study for Arable Crops.” European Journal of Soil Science 61 (6): 903–913. doi:10.1111/j.1365-2389.2009.01217.x.
- Venterea, R. T., B. Maharjan, and M. S. Dolanet. 2011. “Fertilizer Source and Tillage Effects on Yield-Scaled Nitrous Oxide Emissions in a Corn Cropping System.” Journal of Environmental Quality 40 (5): 1521–1531. doi:10.2134/jeq2011.0039.
- Venterea, R. T., J. A. Coulter, and M. S. Dolanet. 2016. “Evaluation of Intensive “4R” Strategies for Decreasing Nitrous Oxide Emissions and Nitrogen Surplus in Rainfed Corn.” Journal of Environmental Quality 45 (4): 1186–1195. doi:10.2134/jeq2016.01.0024.
- Yagi, K. 1997. “Greenhouse Gas Generation-absorption”. Soil Environmental Analysis, 129–138. Hakuyusha, Tokyo. Japanese Society of Soil Science and Plant Nutrition.