
ABSTRACT
Ammonia (NH3) and nitrate (NO3−) are two major sources of N loss during the urea-N transformation process in soil. 3, 4-dimethypyrazole phosphate (DMPP) is a nitrification inhibitor that could effectively limit the NO3 – production process but aggravate NH3 emissions. NH3 volatilization, NO3 – production and the efficiency of DMPP are all influenced by different soil factors. The objective of this study was to understand the effects of soil properties on N losses after urea application and DMPP efficacy. A laboratory incubation experiment was set up with urea applied to seven different types of soil at a rate of 0.25 g N/kg soil, with or without DMPP, (at a rate of 1% of the N applied in the fertilizer). Urea content, NH3 losses and mineral N were measured regularly for 50 days after treatment addition. NO3–N production rates, inhibition efficiencies of DMPP and urea half-lives were calculated based on the measured NO3–N and urea concentrations. Results showed that urea half-life was negatively correlated with soil total organic carbon (TOC) (r = −0.930). NO3 – production rate was correlated with soil pH (r = 0.670), sand (r = 0.639) and clay content (r = −0.632). The efficiency of DMPP for inhibiting NO3 – production was positively correlated with NO3 – production rate (r = 0.721). NH3 volatilization was positively correlated with soil pH (r = 0.657) and sand content (r = 0.687) and negatively correlated with urea half-life (r = −0.586). Greater inhibition efficiency of DMPP led to higher NH3 losses. Urea degradation, NH3 loss, NO3 – production rate and the inhibition efficiency of DMPP were significantly affected by soil properties and the risk of NH3 volatilization was increased by DMPP application.
1. Introduction
Application of N fertilizer has become the most extensive and effective method of supplying N for crop growth. Urea, a solid N fertilizer, has dominated the N fertilizer market due to its beneficial properties of high N concentration (46%), chemical stability and low price.
Urea is hydrolyzed by the urease enzyme and converted into ammonium (NH4+), which is the most effective N nutrient for plant growth (Zaman and Blennerhassett Citation2010). However, hydroxyl ions (OH−) are also produced during urea hydrolysis. The accumulation of NH4+ and OH – promotes ammonia (NH3) formation resulting in N losses through NH3 volatilization (Zaman and Blennerhassett Citation2010). Therefore, the rate of urea hydrolysis not only affects the availability of NH4+ from urea fertilizer but also the rate of N loss in the NH3 form. Meanwhile, NH4+ is also converted to nitrate (NO3−) in soil through the nitrification process, which is carried out by soil microorganisms using the enzymes ammonium monooxygenase (AMO), hydroxylamine oxidoreductase (HAO) and nitric oxide reductase (NOR) (Ruser and Schulz Citation2015). NH3 volatilization and NO3 – leaching are two processes largely responsible for N loss from the soil and also trigger environmental issues such as water eutrophication and soil acidification (Philippot, Hallin, and Schloter Citation2007).
In order to reduce NO3 – production from nitrification, nitrification inhibitors (NIs) have been widely used in agriculture. NIs can inhibit the first step of the nitrification process (i.e., the conversion of NH3 to NO2−) by reducing the activity of AMO (Subbarao et al. Citation2006).
Currently, the most widely used NIs around the world are 3,4-dimethypyrazole phosphate (DMPP), dicyandiamide (DCD) and nitrapyrin. In contrast with DCD and nitrapyrin, DMPP has several advantages, such as lower application rate (1% of the N applied in the fertilizer, about 10 times less than the recommended DCD application rate), less mobility in the soil, less volatility than nitrapyrin and it is easier to blend with fertilizer (Kong et al. Citation2017, Citation2016; Wu et al. Citation2007; Zerulla et al. Citation2001).
It has been well established that urea hydrolyzation, ammonia volatilization, the nitrification process and the effectiveness of DMPP are strongly related to temperature, moisture, pH, soil organic matter content and soil texture (Barth et al, Citation2001; Xue et al. Citation2012; Aijânio et al. Citation2017).
As well, Zhang, Wu, and Zhou (Citation2004) found that peat humus could effectively adsorb DCD and prolong the nitrification inhibition effect by protecting it from biodegradation and excessive leaching. Thus, it is likely that soil humus could also affect the efficacy of DCD. However, DMPP may also be affected by soil humus. Soil humus accounts for 60–90% of soil organic matter and can be divided into humic acid (HA), fulvic acid (FA) and humin (HM). HA and FA are the two most active parts of humus and mainly account for its physical and chemical characteristics (Dou et al. Citation2008). To date, few studies have focused on the effects of different components of soil humus on DMPP effectiveness.
In addition, the effects of single soil factors on urea hydrolyzation, NH3 volatilization, DMPP efficacy and the nitrification process have been examined (Aijânio et al. Citation2017; Barth et al, Citation2001), but there has been no comprehensive study into the effects of multiple soil physical and chemical properties on urea transformation, N losses or DMPP efficiency.
Thus, in this study, soil humus components (e.g., HA and FA) were extracted and measured and an experiment was conducted to comprehensively evaluate the correlations between soil properties, urea hydrolyzation, ammonia volatilization, nitrification rate and the inhibitory effect of DMPP. Furthermore, an understanding of soil factors influencing urea transformation, N losses and DMPP effectiveness may help in the development of a new fertilizer additive to reduce N losses and/or enhance DMPP efficacy.
2. Materials and methods
2.1. Soil sampling and preparation
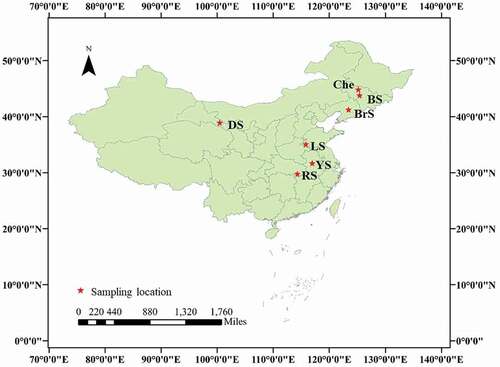
Soil samples, which included seven soil types according to Chinese soil classification: Red soil (RS), Black soil (BS), Brown soil (BrS), Yellow soil (YS), Lime concretion black soil (LS), Chernozem (Che) and Desert soil (DS), were collected from six provinces in China during March to early May 2017 (). All sites had not received any N inputs since the end of 2012. Ten sampling plots were randomly set up in each sampling location and a total of 100 kg of bulk soil was collected from the upper 20 cm of these sampling plots (about 10 kg per plot). The samples were mixed thoroughly, air dried and then passed through a 2 mm sieve to remove large stones, plant roots and residues. Sampling locations and soil physical and chemical properties are shown in and .
Table 1. Characteristics of the soils used in the study
Figure 1. Sampling locations in China. Che: chernozem (site location: N 44°51′10″; E 125°11′3″); BS: black soil (N 43°49′3″ N; E 125°24′5″); BrS: brown soil (N 41°16′17″ N; E 123°26′18″); LS: lime concretion black soil (N 35°5′16″ N; E 115°48′41″); YS: yellow soil (N 31°42′11″; E 116°57′13″); RS: red soil (N 29°48′30″; E 114°18′15″); DS: desert soil (N38°56′11″; E 100°27′38″).
2.2. Experimental design
An aerobic soil incubation was conducted over a 50-day period at a constant temperature of 25°C. Air-dried soil (equivalent to 400 g oven-dry soil) was placed into clean cylindrical polystyrene containers (10 cm in diameter and 10 cm in height), adjusted to approximately 40% water-filled pore space (WFPS) with deionized water and then pre-incubated at 25°C for 1 week to recover soil microorganism activity. After pre-incubation, each soil sample was divided equally into four parts (approximately 100 g each). 10 ml of a solution containing 0.1 g N (0.213 g urea) (U) or a mixture of 0.1 g N and 0.001 g DMPP (UD) was homogeneously sprayed onto each of these portions and then mixed and adjusted to 60% WFPS, which is the optimum WFPS for nitrification to occur (McGeough et al. Citation2016). Each treatment had six replicates, seven soils resulting in a total of 84 containers.
Three containers for each treatment were prepared for NH3 collection by being placed into volatilization chambers (15 cm in height and diameter) where a small beaker containing 10 ml of 20 g L−1 boric acid solution and pH indicators (0.044 g L−1 methyl red with 0.066 g L−1 bromocresol green) was used to trap NH3 (Katukurunda et al. Citation2013; Soares, Cantarella, and Menegale Citation2012). The boric acid solution was removed daily and analyzed for NH3 content until NH3 could no longer be detected. The other three containers were used to periodically measure urea, NH4+ and NO3 – concentrations in the soil. All of the containers were randomly placed in the incubator. The soil in each container was checked periodically for water loss and, if required, adjusted with deionized water to maintain a WFPS of 60% over the 50-day incubation period. There were 12 sampling occasions (1, 3, 5, 10, 15, 20, 25, 30, 35, 40, 45, and 50 days after treatment application) during the incubation period and 2 g soil was sampled at each sampling occasion for texting the concentrations of NH4+-N and NO3–N. Urea concentration was determined initially and then until it could no longer be detected. After each sampling, the incubation containers were placed back into the incubator randomly.
2.3. Analytical methods
Soil total organic carbon (TOC) and total nitrogen (TN) were determined using Total Organic Carbon and elemental analyzer ((TOC-V CPH; Elementary Vario RL III) respectively.
Soil catalase activity was measured based on the method of Guan (Citation1987); briefly, 2 g air-dried soil (< 2 mm) was shaken with 40 ml distilled water and 5 ml 0.3% hydrogen peroxide (H2O2) for 20 mins. 5 ml of 3 N H2SO4 was then added and mixed. The sample was then filtered through qualitative filter paper and 25 ml of the filtrate was titrated with 0.1 N KMnO4.
Soil textures were determined based on the method of Kettler, Doran, and Gilbert (Citation2001), 15 g soil (< 2 mm) was shaken with 45 ml of 3% sodium hexametaphosphate (HMP) for 2 hours, then passed through a 0.053 mm sieve to collect sand (on the sieve). The sieved solution (silt and clay) was stirred thoroughly, then settled undisturbed for a sedimentation period of 6 hours. After the sedimentation period, the suspended clay fraction was discarded. The settled silt fraction and the sand on the sieve were then dried at 105°C to constant weight. The sand and silt contents were calculated, and the clay content was determined by subtracting the sum of the sand and silt weights from the original sample weight. Soil pH and conductivities were determined using a pH-meter (S210 SevenCompactTM, Mettler, Germany) with a soil:water ratio of 1:2.5 (Bao et al. Citation1999).
Soil HA and FA were extracted according to a method modified from Brunetti et al. (Citation2007). Briefly, a solution of 0.1 M Na4P2O7 and 0.1 M NaOH was mixed with soil at a ratio of 10:1 (solution to soil). The mixture was shaken horizontally in a water-bath at 72°C for 2 hours at a rate of 145 r min−1, centrifuged at 9600 g for 30 minutes, and then filtered. 5 ml of the filtrate was acidified with 2 M H2SO4 to pH 1 (to separate HA and FA). After chilling for 12 hours the mixture was filtered again. The FA passed through and HA was retained on the filter paper. The HA was dissolved in 0.5 M NaOH and the concentrations of HA and FA were determined using a Total Organic Carbon Analyzer (TOC-V CPH).
Soil NH4+-N and NO3–N were extracted from the soil with 2 M KCl and determined by the MgO distillation method (Bao et al. Citation1999). Urea concentrations were determined by the diacetyl monoxime method after extraction from the soil samples with 2 M KCl (Seaton and Ali Citation1984). Briefly: 1 g of soil was shaken with 10 ml of 2 M KCl for 60 minutes at a shaking rate of 120 r min−1 and filtered. The Filtrate (0.4 ml) was diluted to 10 ml with deionized water then a 0.4 ml aliquot was mixed with 6 ml of color reagent (diacetyl monoxime combined with thiosemicarbazide. Urea reacts with diacetyl monoxime under acid conditions to give a yellow condensation product; thiosemicarbazide intensifies this reaction), and placed in a boiling waterbath for 15 minutes. After removal from the waterbath, the samples were rapidly cooled in iced water to room temperature. Absorbance was measured on a spectrophotometer at 535 nm wavelength.
The amount of NH3 volatilized was determined by a titrating the boric acid trap solutions with 0.005 M H2SO4 (Katukurunda et al. Citation2013)
2.4. Calculations and statistical analysis
Traditionally, nitrification rate has been calculated using the following formula: NO3–N content/(NH4+-N + NO3–N). However, previous research has indicated that not all NH4+-N can be extracted by KCl solution. The non-extractable NH4+ can also be a source of available N to nitrifiers under certain conditions (Feigenbaum et al. Citation1994). Additionally, NH3 volatilizations significantly affect soil NH4+ content as well. The conventional formula NO3–N content/(NH4+-N + NO3–N) may cannot exhibit nitrification rate accurately. Thus, in this study, the average NO3 – production rate was used to represent the nitrification rate. NO3 – production rates are calculated as: (final NO3–N content – initial NO3–N content)/incubation time. The inhibitory rates are calculated as: (NO3 – production rates in without DMPP treatment – NO3 – production rates in with DMPP treatment)/(NO3 – production rates in without DMPP treatment).
The hydrolyzation of urea in the soils was quantified using regression analysis including 95% confidence limits (P < 0.05). A first-order degradation model (Ct = [k*ln(t) + A)] was applied to the urea concentration data over time, where the constant k is the first order rate constant for urea decomposition. The time taken for the urea concentration to decline to half its initial concentration (i.e., the concentration determined on the first day of incubation) is termed the half-life (t1/2).
An ANOVA analysis was used to determine the significance of the effects of the different treatments on urea hydrolyzation, NH3 volatilization and soil NH4+ and NO3 – concentrations in the different soil types. A significance level of 0.05 was used unless otherwise stated. Estimates of means, standard errors of means, standard errors of differences in means and Fisher’s least significant difference (LSD) were calculated using SPSS 19.0. Pearson correlation analysis using Sigmaplot 12 was performed with urea half-life, NH3 volatilization, NO3 – production rate, inhibitory rate of DMPP and all soil physical and chemical properties.
3. Results
3.1. Urea hydrolyzation
Urea was completely hydrolyzed after day 4 with U and UD treatments in BS and BrS, which exhibited faster hydrolyzation rates than the other soil types (). The lowest hydrolyzation rate of urea was found in RS (urea was no longer found after day 8). DMPP application did not show a significant effect on the hydrolyzation rate in any soil type.
Figure 2. Urea concentration in the soil during the incubation period. Vertical bars are standard errors of the mean (n = 3). BS: black soil; BrS: brown soil; RS: red soil; DS: desert soil; YS: yellow soil; Che: chernozem; LS: lime concretion black soil. U:ureaonly;UDureawithDMPP.
The half-lives of urea are shown in . For both treatments (U and UD), the shortest half-life of urea was found in BrS and the longest half-life was found in RS. DMPP application significantly prolong the half-life urea in BrS by 0.08 day (P < 0.05), while this effectiveness did not observed in other soil types.
Table 2. Average half-lives (days) of urea with different treatments in seven soil types
3.2. Dynamics of NH4+-N and NO3–N concentrations in different soil types
The concentration changes in NH4+ and NO3 – after urea application with or without DMPP in the test soils are shown in . Results showed that N remained in the NH4+ form for longer periods in RS than in the other soil types.
Figure 3. Changes in soil mineral N concentrations. Vertical bars are standard errors of the mean (n = 3). BS: black soil; BrS: brown soil; RS: red soil; DS: desert soil; YS: yellow soil; Che: chernozem; LS: lime concretion black soil. U: urea only; UD urea with DMPP.
Application of DMPP significantly increased NH4+ concentrations and prolonged the retention of N in the NH4+ form, in DS, Che and LS, but not in the other soil types (). Changes in NO3–N over time showed that less NO3 – was produced when DMPP was applied in all soil types except in RS. The NO3 – production rate and the inhibitory rate of DMPP also varied among the different soil types (), the highest and lowest NO3 – production rates were 3.8 and 0.8 mg kg−1 day−1 in LS and RS, respectively. The strongest inhibition effect of DMPP on NO3–N production rates was observed in DS achieving 53.6%, while the weakest was only 2.6% in RS.
Table 3. Average NO3–N production rates (mg kg−1 d−1) in each soil type under the urea and DMPP treatments
3.3. The NH3 volatilization rate and total amount volatilized
NH3 volatilization rate exhibited similar trends to NH4+ dynamics in all soil types, rapidly increasing at initially and then decreasing (). The timing of the occurrence of volatilization peaks and the cumulative amounts of NH3 emitted exhibited differences in the different soil types. The earliest NH3 volatilization peak was found in LS on day 3, and the latest was on day 7 in RS. DMPP application (UD) did not affect the occurrence time of peaks.
Figure 4. Daily NH3 flux from different treatments in seven soil types. Vertical bars are standard errors of the mean (n = 3). BS: black soil; BrS: brown soil; RS: red soil; DS: desert soil; YS: yellow soil; Che: chernozem; LS: lime concretion black soil. U:ureaonly;UDureawithDMPP.
The cumulative NH3 losses also varied with the different soil types. The order from high to low of cumulative NH3 volatilization is Che > LS > BrS > DS > BS > YS > RS (). DMPP application significantly increased NH3 emissions. In contrast with the U treatment, the UD treatment increased NH3 losses by 24.8% in DS, which was the greatest effect on NH3 losses. The smallest effect was found in YS (6.3%) ().
Table 4. Cumulative NH3 volatilization (mg N kg−1 soil)
3.4. Relationships between soil characteristics and urea half-life, NH3 volatilization, nitrification rate and inhibitory rate of DMPP
The Pearson correlation coefficients, r, and associated probabilities, P, between soil characteristics and urea half-life, NH3 volatilization, nitrification rate and inhibitory rate of DMPP, are summarized in : Of the total 9 soil variables assessed, 4 of them had a statistically significant correlation with the NO3 – production rate. These variables included pH (r = 0.670, P < 0.01), sand content (r = 0.639, P < 0.01), clay content (r = −0.632, P < 0.01) and EC (r = 0.774, P < 0.01). The nitrification inhibition rate of DMPP was positively correlated with soil pH (r = 0.931, P < 0.01), sand content (r = 0.611, P < 0.01), EC (r = 0.666, P < 0.01) and catalase activity (r = 0.670, P < 0.01) and negatively correlated with clay content (r = – 0.920, P < 0.01). Urea half-life was negatively affected by TOC (r = −0.930, P < 0.01), HA content (r = −0.718, P < 0.01), FA (r = −0.924, P < 0.01) and catalase activity (r = −0.529, P < 0.05). The amount of NH3 volatilized was positively correlated with pH (r = 0.657, P < 0.01), sand content (r = 0.687, P < 0.01), FA content (r = 0.504, P < 0.05), EC (r = 0.639, P < 0.01), TOC (r = 0.439, P < 0.05) and negatively correlated with clay content (r = −0.711, P < 0.01).
Table 5. Correlation coefficients (r) between average NO3–N production rate, % inhibition rate of NO3 – production by DMPP, half-life of urea, cumulative NH3 volatilization, % NH3 losses aggravated by DMPP and soil properties
As well as the effects of soil factors on nitrification rate, urea hydrolyzation and NH3 volatilization, strong relationships were also found between other variables. The DMPP inhibitory rate was positively correlated with NO3 – production rate (r = 0.679, P < 0.01). The cumulative NH3 losses was positively correlated with the inhibitory rate of DMPP (r = 0.721, P < 0.01) and negatively correlated with urea half-life (r = 0.679, P < 0.01). No significant relationship was found between urea half-life and DMPP inhibition efficiency, whereas NO3–N production rate was negatively correlated with urea half-life (r = −0.452, P < 0.05) ().
4. Discussion
In this experiment, temperatures and moisture contents were controlled, thus, differences in NO3 – production rate, DMPP inhibitory rate and urea degradation rate (half-life) between different soil types were mainly caused by the different soil physical and chemical characteristics.
4.1. Effects of soil characteristics on urea hydrolyzation
In this study, urea half-life was calculated and used to describe the urea hydrolyzation rate. Results showed that TOC and catalase activity were the only two soil factors (HA and FA are two components of TOC) which significantly reduced urea half-life (). Urease is the only enzyme that can hydrolyze urea in soil, thus, the urea hydrolyzation rate is determined by the activity of urease in soil (Zaman and Blennerhassett Citation2010). The urease enzyme is produced by soil microbes (Kot, Zaborska, and Orlinska Citation2001), higher TOC could lead to higher soil microbial activity and catalase is an oxidoreductase commonly found in microorganisms (Zhang et al. Citation2005). Thus, Higher TOC content and catalase activity could increase urease activity, and lead to a shorter urea half-life.
4.2. Effects of soil characteristics on Nitrification rate
Microbial oxidation of ammonia is a rate limiting step in the nitrification process and dominates the NO3 – production process (Jia and Conrad Citation2009; McGeough et al. Citation2016). Soil and other environmental factors could affect the NO3 – production rate by influencing microbial ammonia oxidation.
Ammonia-oxidizing bacteria (AOB) and ammonia oxidizing archaea (AOA) are two primary groups of microorganisms responsible for the ammonia oxidation process (Purkhold et al. Citation2000; Wakelin et al. Citation2014)). Phylogenetic analysis has shown that most operational taxonomic units (OTUs) of AOB are affiliated with the Nitrosospira cluster 3 and AOA are affiliated with Nitrosomonas cluster 7 (Ouyang et al. Citation2016). Nitrosospira cluster 3 often outcompetes other Nitrosospira (Tourna, Freitag, and Prosser Citation2010). Thus, the oxidizing ability of AOB on ammonia is stronger than that of AOA and dominates the nitrification process. Many other studies have also verified this relationship (Jia and Conrad Citation2009; Shen et al. Citation2008). In the current study, the lowest NO3 – production rate was found in RS, which had the lowest pH value and soils with higher pH values (LS and Che) exhibited higher NO3 – production rates (). Correlation analysis showed that the NO3 – production rate was positively correlated with soil pH (r = 0.821, P < 0.05). These results align with the effect of soil pH on the activity of AOB, suggesting that the dominant nitrification microorganisms in the test soils were AOB. Previous research has indicated that pH could strongly affect the compositions and activities of AOB and AOA; AOB are most suited to alkaline conditions, and conversely, AOA are more suited to acidic conditions (De Boer and Kowalchuk Citation2001; Hu, Xu, and He Citation2014; Hu et al. Citation2013; Jia and Conrad Citation2009; Shen et al. Citation2008; Zhang et al. Citation2012).
In addition, the substrate for the AMO enzyme is ammonia rather than ammonium (McCarty Citation1999). The high H+ concentration under acidic conditions could restrict ammonium conversion to ammonia, this restriction could directly reduce the substrate concentration of AMO (Hu, Xu, and He Citation2014; Li et al. Citation2018). This could be another reason for a lower NO3 – production rate and longer NH4+ storage time under low pH conditions, as found in RS in this study ().
The results of this study suggest that soil textural factors such as sand and clay contents can significantly affect NO3 – production rate. Higher NO3 – production rates were observed in Che and DS, which are two soils with lower clay content. This is mainly due to the fact that the nitrification process is an aerobic biological process, which needs a high oxygen concentration. The sand: clay ratio affects soil aerobic – anaerobic processes by changing the soil aeration status and redox potential. Low oxygen concentration and redox potential would occur when there is high clay content, retarding the nitrification process (Benckiser, Schartel, and Weiske Citation2015; Yu et al. Citation2007). Furthermore, high clay content could result in high cation exchange capacity (CEC) and strong NH4+ sorption ability (McGeough et al. Citation2016; Yu et al. Citation2007), thus decreasing the amount of substrate for nitrifiers.
There was a positive relationship between soil EC and NO3 – production rate (). Soil EC indicates the ability for electron transfer and the concentration of soluble salts in the soil. The ammonia oxidation process is a microbial oxidation – reduction process which needs electrons. A highly conductive environment could ensure a sufficient supply of electrons to support the ammonia oxidation process (Benckiser, Schartel, and Weiske Citation2015). In addition, in this study, soil EC exhibited a significant positive relationship with soil pH (). This result was consistent with previous research and may indicate a possible indirect effect of soil EC on NO3 – production rate by influencing soil pH.
4.3. Impact of soil properties on inhibitory rate of DMPP
A significantly positive correlation was found between the inhibitory rate of DMPP and soil pH (r = 0.881, P < 0.05). The major reason for this relationship could be summarized as follows: Firstly, DMPP has a specific target on AOB (Benckiser, Schartel, and Weiske Citation2015; Kong et al. Citation2016; Müller et al. Citation2002), which dominate the nitrification process under alkaline conditions, and poor inhibitory function on AOA, which play a leading role in nitrification under acidic conditions (Benckiser, Schartel, and Weiske Citation2015; Kleineidam et al. Citation2011; Shi et al. Citation2016). So, DMPP could be more effective in high soil pH conditions than in low. Secondly, DMPP is a weak alkaline salt, thus the high hydroxyl (OH−) concentration in soil with high pH could neutralize the phosphate in DMPP and accelerate the hydrolysis of DMPP to 3, 4-dimethypyrazole (DMP), which is the actual functional chemical group that inhibits the ammonia oxidizing process (McCarty Citation1999).
Results shown in suggest that soil texture could play an important role in affecting DMPP inhibitory rate. There would be a strong nitrification potential in coarse soils, and the inhibitory function of DMPP would be amplified by this strong nitrification potential. However, the binding behavior of DMPP to clay would reduce the amount of active DMPP in the soil environment, and thus decrease the contact opportunity between DMPP and soil nitrifiers (Barth et al. Citation2001). Accordingly, the higher content of clay negatively affected the inhibition rate of DMPP on NO3 – production.
As discussed above, strong soil EC could facilitate the nitrification process, resulting in a faster NO3 – production rate, which in turn would amplify the inhibitory function of DMPP. The positive correlation between soil EC and DMPP inhibitory rate found in this study () supports this suggestion.
Barth et al. (Citation2001) observed that catalase and DMPP bound at similar sites on soil particle surfaces. Thus, a competitive relationship may exist between catalase and DMPP. For example, a higher catalase activity may result in greater competition for soil binding sites leaving more DMPP free in the soil environment, thus weakening the physical protection from soil particles and increasing the contact opportunity between DMPP and soil nitrifiers.
4.4. Effects of soil characteristics and DMPP application on cumulative NH3 volatilization
The higher soil pH and NH4+ accumulation are two important factors for NH3 volatilization (Zaman and Blennerhassett Citation2010). NH4+ and OH – ions are co-produced during urea hydrolysis and result in an increase in soil pH, faster urea degradation (shorter half-life) will accelerate the accumulation of OH – and NH4+ and stimulate NH3 emissions. Thus, in this study, the cumulative NH3 volatilization was negatively correlated with urea half-life and positively correlated with soil pH and TOC. Clay could restrict NH3 emissions by physical protection of NH4+.
DMPP application significantly increased NH3 volatilization, the percentage of NH3 lost was positively correlated with the inhibition rate of DMPP (, ). This was mainly due to DMPP increasing soil NH4+ concentration and pH by inhibiting the nitrification process, which is an acidifying process (Zaman et al. Citation2009).
4.5. Correlation between urea hydrolyzation, nitrification rate and DMPP inhibition efficiency
In this study, significant inhibition rates of DMPP were found in DS, Che, LS. Significantly increased effects on DMPP on NH4+ were also found in DS, Che, LS, as well (), this result mainly caused by the inhibitory effect of DMPP on nitrification process.
Nitrification rate can be affected by increased soil NH4+ concentration in suitable range, and shorter urea half-life means a faster NH4+ accumulation rate, thus, the nitrification rate was negatively affected by urea half-life (). A greater nitrification potential will lead to greater nitrification inhibition efficiency (McGeough et al. Citation2016), therefore, a positive relationship was found between nitrification rate and DMPP inhibition efficiency ().
5. Conclusion
Results in this study indicate that urea hydrolyzation rate is strong positively correlated with soil organic carbon and catalase activity. NH3 losses from urea fertilizer were positively correlated with soil pH, sand content, organic carbon content and urea hydrolyzation rate. NO3 – production was significantly affected by soil pH, EC and sand and clay content. DMPP effectively inhibited the nitrification process but showed different inhibitory rates in different soils. DMPP efficacy was generally high in soils with high pH, sand content and EC, and low in soils with high clay content. DMPP application inhibited the nitrification process but aggravated NH3 losses, and a greater inhibition rate resulted in higher NH3 emissions. Using this knowledge, further study could lead to the development of measures to reduce the NH3 losses caused by DMPP and enhance its efficacy.
Acknowledgments
This project was funded by the Development and Industrialization of New Stabilized Compound Fertilizer project (2017YFD0200708-2). The authors would like to express thanks to Hanwen Liu, Guohui Wu and Fang Ding from the Institute of Applied Ecology, Chinese Academy of Science for assistance during soil collection and to Professor Song Guan from Jilin Agricultural University for assistance with technical support for measuring soil humic substances.
Disclosure statement
No potential conflict of interest was reported by the author(s).
Additional information
Funding
References
- Aijânio, G. B. S., H. S. Cleiton, A. S. Renata, and O. Refael. 2017. “Urease Inhibitor NBPT on Ammonia Volatilization and Crop Productibity: A Meta-analysis.” Agronomy Journal 109: 1–13.
- Bao, S., R. Jiang, G. Xu, and X. Han. 1999. “Soil Agricultural Analysis.” China Beijing.(In Chinese): China Agriculture Press.
- Barth, G., S. Von Tucher, and U. Schmidhalter. 2001. “Influence of Soil Parameters on the Effect of 3,4-dimethylpyrazole-phosphate as a Nitrification Inhibitor.” Biology and Fertility of Soils 34: 98–102.
- Benckiser, G., T. Schartel, and A. Weiske. 2015. “Control of NO3− and N2O Emissions in Agroecosystems: A Review.” Agronomy for Sustainable Development 35: 1059–1074.
- Brunetti, G., C. Plaza, C. E. Clapp, and N. Senesi. 2007. “Compositional and Functional Features of Humic Acids from Organic Amendments and Amended Soils in Minnesota, USA.” Soil Biology & Biochemistry 39: 1355–1365.
- De Boer, W., and G. A. Kowalchuk. 2001. “Nitrification in Acid Soils: Micro-organisms and Mechanisms.” Soil Biology & Biochemitry 33: 853–866.
- Dou, S., K. Li, J. Cui, S. Guan, and J. Zhang. 2008. “Advancement in the Study on Formation, Transformation and Structural Characteristics of Soil Humic Substances.” Acta Pedologica Snica 45: 1148–1158.
- Feigenbaum, S., A. Hadas, M. Sofer, and J. A. E. Molina. 1994. “Clay-Fixed Labeled Ammonium as a Source of Available Nitrogen.” Soil Science Society America Journal 58: 980–985.
- Guan, S. 1987. Soil Enzyme and Analytical Method. China Beijing (In Chinese): Agricultural Press.
- Hu, H., L. Zhang, Y. Dai, H. Di, and J. He. 2013. “pH-dependent Distribution of Soil Ammonia Oxidizers across a Large Geographical Scale as Revealed by High-throughput Pyrosequencing.” Journal of Soils Sediments 13: 1439–1449.
- Hu, H., Z. Xu, and J. He. 2014. “Ammonia-oxidizing Archaea Play a Predominant Role in Acid Soil Nitrification.” Advances in Agronomy 125: 261–302.
- Jia, Z., and R. Conrad. 2009. “Bacteria Rather than Archaea Dominate Microbial Ammonia Oxidation in an Agricultural Soil.” Environmental Microbiology 11: 1658–1671.
- Katukurunda, K. G. S. C., M. K. W. Gamage, H. A. A. Y. Buddhika, S. D. Prabhashini, and D. Senaratna 2013. “Mturmaric Powder (Curcuma Longa) Affected on Microbial Dynamics, Ammonia Emission Rate and Some Chemical Properties of Layer Litter. In mTurmaric Powder (Curcuma Longa) Affected on Microbial Dynamics, Ammonia Emission Rate and Some Chemical Properties of Layer Litter.” Proceedings of the Second International Symposium on Minor Fruits and Medicinal Plants for Better Lives (2nd ISMF & MP), University of Ruhuna, Sri Lanka.” 134–138: Faculty of Agriculture, Unviersity of Ruhuna.
- Kettler, T. A., J. W. Doran, and T. L. Gilbert. 2001. “Simplified Method for Soil Particle-Size Determination to Accompany Soil-Quality Analyses.” Soil Science Society of America Journal 65: 849–852.
- Kleineidam, K., K. Kosmrlj, S. Kublik, I. Palmer, H. Pfab, R. Ruser, S. Fiedler, and M. Schloter. 2011. “Influence of the Nitrification Inhibitor 3,4-dimethylpyrazole Phosphate (DMPP) on Ammonia-oxidizing Bacteria and Archaea in Rhizosphere and Bulk Soil.” Chemosphere 84: 182–186.
- Kong, X., Y. Duan, A. Schramm, J. Eriksen, M. Holmstrup, T. Larsen, R. Bol, and S. O. Petersen. 2017. “Mitigating N2O Emissions from Clover Residues by 3,4-dimethylpyrazole Phosphate (DMPP) without Adverse Effects on the Earthworm Lumbricus Terrestris.” Soil Biology & Biochemistry 104: 95–107.
- Kong, X., Y. Duan, A. Schramm, J. Eriksen, and S. O. Petersen. 2016. “3,4-Dimethylpyrazole Phosphate (DMPP) Reduces Activity of Ammonia Oxidizers without Adverse Effects on Non-target Soil Microorganisms and Functions.” Applied Soil Ecology 105: 67–75.
- Kot, M., M. Zaborska, and K. Orlinska. 2001. “Inhibition of Jack Bean Urease by N-(n-butyl) Thiophosphoric Triamide and N-(n-butyl) Phosphoric Triamide: Determination of the Inhibition Mechanism.” Journal of Enzyme Inhibition 16: 507–516.
- Li, Y., S. J. Chapman, G. W. Nicol, and H. Yao. 2018. “Nitrification and Nitrifiers in Acidic Soils.” Soil Biology &Biochemistry 116: 290–301.
- McCarty, G. W. 1999. “Modes of Action of Nitrification Inhibitors.” Biology and Fertility of Soils 29: 1–9.
- McGeough, K. L., C. J. Watson, C. Müller, R. J. Laughlin, and D. R. Chadwick. 2016. “Evidence that the Efficacy of the Nitrification Inhibitor Dicyandiamide (DCD) Is Affected by Soil Properties in UK Soils.” Soil Biology & Biochemistry 94: 222–232.
- Müller, C., R. Stevens, R. Laughlin, F. Azam, and J. Ottow. 2002. “The Nitrification Inhibitor DMPP Had No Effect on Denitrifying Enzyme Activity.” Soil Biology & Biochemistry 34: 1825–1827.
- Ouyang, Y., J. M. Norton, J. M. Stark, J. R. Reeve, and M. Y. Habteselassie. 2016. “Ammonia-oxidizing Bacteria are More Responsive than Archaea to Nitrogen Source in an Agricultural Soil.” Soil Biology & Biochemistry 96: 4–15.
- Philippot, L., S. Hallin, and M. Schloter. 2007. “Ecology of Denitrifying Prokaryotes in Agricultural Soil.” Advances in Agronomy 96: 249–305.
- Purkhold, U., A. Pommerening-Röser, S. Juretschko, M. C. Schmid, H. P. Koops, and M. Wagner. 2000. “Phylogeny of All Recognized Species of Ammonia Oxidizers Based on Comparative 16S rRNA and amoA Sequence Analysis: Implications for Molecular Diversity Surveys.” Applied and Environmental Microbiology 66: 5368.
- Ruser, R., and R. Schulz. 2015. “The Effect of Nitrification Inhibitors on the Nitrous Oxide (N2O) Release from Agricultural Soils-a Review.” Journal of Plant Nutrition and Soil Scicence 178: 171–188.
- Seaton, B., and A. Ali. 1984. “Simplified Manual High Performance Clinical Chemistry Methods for Developing Countries.” Medical Laboratory Sciences 41: 327–336.
- Shen, J., L. Zhang, Y. Zhu, J. Zhang, and J. He. 2008. “Abundance and Composition of Ammonia-oxidizing Bacteria and Ammonia-oxidizing Archaea Communities of an Alkaline Sandy Loam.” Environmental Microbiology 10: 1601–1611.
- Shi, X., H. Hu, J. He, D. Chen, and H. C. Suter. 2016. “Effects of 3,4-dimethylpyrazole Phosphate (DMPP) on Nitrification and the Abundance and Community Composition of Soil Ammonia Oxidizers in Three Land Uses.” Biology and Fertility of Soils 52: 927–939.
- Soares, J. R., H. Cantarella, and M. L. C. Menegale. 2012. “Ammonia Volatilization Losses from Surface-applied Urea with Urease and Nitrification Inhibitors.” Soil Biology & Biochemistry 52: 82–89.
- Subbarao, G. V., O. Ito, K. L. Sahrawat, W. L. Berry, K. Nakahara, T. Ishikawa, T. Watanabe, K. Suenaga, M. Rondon, and I. M. Rao. 2006. “Scope and Strategies for Regulation of Nitrification in Agricultural Systems-challenges and Opportunities.” Critical Reviews in Plant Sciences 25: 303–335.
- Tourna, M., T. E. Freitag, and J. I. Prosser. 2010. “Stable Isotope Probing Analysis of Interactions between Ammonia Oxidizers.” Applied and Environmental Microbiology 76: 2468–2477.
- Wakelin, S., E. Williams, C. A. O’Sullivan, K. C. Cameron, H. Di, V. Cave, and M. O’Callaghan. 2014. “Predicting the Efficacy of the Nitrification Inhibitor Dicyandiamide in Pastoral Soils.” Plant and Soil 381: 35–43.
- Wu, S., L. Wu, Q. Shi, Z. Wang, X. Chen, and Y. Li. 2007. “Effects of a New Nitrification Inhibitor 3,4-dimethylpyrazole Phosphate (DMPP) on Nitrate and Potassium Leaching in Two Soils.” Journal of Environmental Sciences 19: 841–847.
- Xue, Y., Z. Wu, L. Zhang, P. Gong, X. Dong, and Y. Nie. 2012. “Inhibitory Effect of DMPP on Soil Nitrification as Affected by Soil Moisture Content, pH and Ogranic Matter.” Chinese Journal of Applied Ecology. 23. 2663–2669. In Chinese.
- Yu, Q., Y. Chen, X. Ye, Q. Zhang, Z. Zhang, and P. Tian. 2007. “Evaluation of Nitrification Inhibitor 3,4-dimethyl Pyrazole Phosphate on Nitrogen Leaching in Undisturbed Soil Columns.” Chemosphere 67: 872–878.
- Zaman, M., and J. D. Blennerhassett. 2010. “Effects of the Different Rates of Urease and Nitrification Inhibitors on Gaseous Emissions of Ammonia and Nitrous Oxide, Nitrate Leaching and Pasture Production from Urine Patches in an Intensive Grazed Pasture System.” Agrculture Ecosystems & Environment 136: 236–246.
- Zaman, M., S. Saggar, J. D. Blennerhassett, and J. Singh. 2009. “Effect of Urease and Nitrification Inhibitors on N Transformation, Gaseous Emissions of Ammonia and Nitrous Oxide, Pasture Yield and N Uptake in Grazed Pasture System.” Soil Biology & Biochemistry 41: 1270–1280.
- Zerulla, W., T. Barth, J. Dressel, K. Erhardt, K. H. Von Locquenghien, G. Pasda, Rädle, and A. M. Wissemeier. 2001. “3,4-Dimethylpyrazole Phosphate (DMPP) - a New Nitrification Inhibitor for Agriculture and Horticulture.” Biology and Fertility of Soil 34: 79–84.
- Zhang, H., Z. Wu, and Q. Zhou. 2004. “Dicyandiamide Sorption-desorption Behavior on Soils and Peat Humus.” Pedosphere 14: 395–399.
- Zhang, L., H. Hu, J. Shen, and J. He. 2012. “Ammonia-oxidizing Archaea Have More Important Role than Ammonia-oxidizing Bacteria in Ammonia Oxidation of Strongly Acidic Soils.” The ISME Journal 6: 1032–1045.
- Zhang, L., L. Chen, Y. Zhang, and Z. Wu. 2005. “Research Advances in Catalytic Kinetics of Soil Oxidoreductase.” Chinese Journal of Applied Ecology. 16. 371–374. In Chinese.