
 ?Mathematical formulae have been encoded as MathML and are displayed in this HTML version using MathJax in order to improve their display. Uncheck the box to turn MathJax off. This feature requires Javascript. Click on a formula to zoom.
ABSTRACT
To elucidate the effects of slow-release fertilizers on nitrous oxide (N2O) emission from fields with winter wheat cultivation in cool-temperate regions, we conducted a two-year field experiment in Hokkaido. Four types of fertilizer treatment, i.e., urea (U), coated urea (CU), coated calcium nitrate (CC), and no nitrogen fertilizer (NN) were investigated. In the U treatment, urea was applied at 40 and 90 + 60 kg N ha−1 in autumn and in spring, respectively. In the CU and CC treatments, all the nitrogen (190 kg N ha−1) was applied using coated fertilizers in autumn for the first cultivation, whereas nitrogen was applied at 130 kg N ha−1 using the coated fertilizers in autumn and the remaining 60 kg N ha−1 was applied using urea in spring for the second cultivation. The magnitudes and seasonal courses of N2O flux did not largely differ among the treatments (i.e., types of fertilizer), including the NN treatment in most of the experimental periods except that the N2O fluxes were higher in the U and CU treatments than in the CC and NN treatments at the beginning of the second wheat cultivation. In all the treatments, the N2O flux showed the highest peak immediately after basal fertilization, followed by other small peaks in autumn. After the next spring, the N2O flux consistently remained low until the wheat harvest including immediately after the end of snowmelt and after supplemental fertilizations. Cumulative N2O emissions tended to be lower in the CC treatment than in the U and CU treatments, although these differences in the emissions were not statistically significant. Although the wheat grain yields were lower in the CU and CC treatments than in the U treatments, the differences were small for the second wheat cultivation. These results indicate that reduction in N2O emission with no decrease in the wheat yield can be achieved by the basal application of slow-release nitrate fertilizer combined with the supplemental application of conventional fertilizer in winter wheat cultivation in Hokkaido, although further studies are still necessary to determine the optimum allocation levels of the basal and supplemental nitrogen applications.
1. Introduction
Nitrous oxide (N2O) is a major greenhouse gas, which has 298 times higher global warming potential than carbon dioxide in a time horizon of 100 years (Myhre et al. Citation2013). It also degrades stratospheric ozone (Denman et al. Citation2007). Fertilized soil in upland croplands is one of the major sources of N2O (Greenhouse Gas Inventory Office of Japan Citation2021). Nitrous oxide is produced in the soil by various soil microbial species mainly as a byproduct of nitrification and an intermediate product of denitrification (Bouwman Citation1990; Hutchinson and Davidson Citation1993) and emitted from upland soils with various types of crop and vegetable cultivations.
Wheat is one of the major crops in the world, the cultivation area of which is about 2.4 × 10⁶ km2 (Food and Agriculture Organization of the United Nations Citation2021). Among these, winter wheat, sown in autumn and harvested in the next summer, is widely cultivated in cool and cold regions in the world. In Japan, approximately 60% of the wheat grain is obtained as winter wheat cultivated in Hokkaido (Ministry of Agriculture, Forestry and Fisheries of Japan Citation2021).
The cultivation period of winter wheat is longer than those of other annual crop species. In conventional winter wheat cultivation in Japan, supplemental fertilizers are generally supplied multiple times after spring, which often become laborious for farmers in the busy spring season. In addition, in cold regions with snow cover in winter, supplemental fertilization in the early spring season (immediately after the end of snowmelt with high soil water content) is often required, which includes difficulty in working under muddy conditions.
Therefore, in various regions in Japan, cultivation of winter wheat with reduced number of supplemental fertilizations has been investigated by the basal application of slow-release fertilizers in autumn. The effects on labor saving with the reduced number of supplemental fertilizations using a suitable mixture of conventional chemical fertilizers (i.e., fast-acting fertilizers) and slow-release fertilizers have been reported, with no decrease in the grain yield or protein content of the wheat in various prefectures, such as Akita, Aichi, Saitama, Yamaguchi, Fukuoka, and Shiga (Yamaya et al. Citation1991; Takei and Ikeda Citation2004; Ishii Citation2009; Nakatsukasa, Kimura, and Ariyoshi Citation2010; Araki Citation2017; Hasukawa et al. Citation2017), whereas occasional decreases in grain yield and protein content have been reported in Mie (Ohnishi Citation2016). Such experiments have also been conducted in Hokkaido. The studies conducted in Hokkaido showed that, by basal applications of a suitable mixture of conventional and slow-release fertilizers in autumn, supplemental fertilizations after spring can be omitted completely (Kitami Agricultural Experiment Station, Hokkaido Research Organization (HRO) Citation2018) or partly (Central Agricultural Experiment Station, HRO Citation2013; Furudate et al. Citation2013) with no decrease in wheat yield.
Such fertilizer management methods (reduced number of supplemental fertilizations using slow-release fertilizers) may also decrease N2O emission caused by supplemental fertilizations. The effects of slow-release fertilizers on N2O emission from winter wheat fields have been investigated in various regions in the world both with and without continuous snow cover in winter. In most of these previous studies with no continuous snow cover period, the magnitudes of N2O fluxes in fields with winter wheat were generally low, presumably owing to the low ambient temperature during the wheat cultivation periods, and the effects of slow-release fertilizers on N2O emission were not consistent. Hasukawa et al. (Citation2017) reported significant reductions in the N2O emission by applying slow-release fertilizers, whereas some other previous studies found no recognizable differences in the N2O emissions among the treatments applied with slow-release fertilizers and conventional chemical fertilizers (Shi et al. Citation2013; Yan et al. Citation2015; An et al. Citation2021) or found relatively higher N2O emissions when slow-release fertilizers were applied (Jiang et al. Citation2010).
On the other hand, in regions with continuous snow cover in winter such as northern regions in Japan, the N2O flux often increases markedly around the snowmelt period in early spring owing to the temporary enhancement of denitrification in the soil (e.g., Yanai et al. Citation2011). In addition, in Hokkaido, the first supplemental fertilization is often required immediately after the end of snowmelt when the soil water content is still high (Hokkaido Agricultural Association Citation2021). Such fertilization under a high soil water content condition may markedly enhance N2O production via denitrification in early spring, thus the development of fertilizer management including no supplemental application in early spring, is also highly important to reduce N2O emission in such regions. To the best of our knowledge, however, studies focusing on the utilization of slow-release fertilizers to omit supplemental fertilization in early spring in cool-temperate regions with continuous snow cover in winter have been limited to date.
The objective of this study was to elucidate the effects of the application of slow-release fertilizers on N2O emission from fields with winter wheat cultivation in Hokkaido, a cool-temperate region with continuous snow cover in winter. We investigated two types of coated slow-release fertilizer. One was coated urea, which is widely used in various crop cultivations. The other was coated calcium nitrate, which is another type of slow-release fertilizer. It contains nitrate nitrogen (NO3-N) instead of ammonium nitrogen (NH4-N), and thus produces no N2O via nitrification after being applied to soils. Although coated calcium nitrate has been expected to markedly decrease N2O emission, it is not widely used and has not been intensively investigated, with only a few previous studies (Akiyama and Tsuruta Citation2002; Toma et al. Citation2018; Nishimura et al. Citation2021) available. In this study, we measured N2O and concomitant nitric oxide (NO) fluxes during the winter wheat cultivation periods. The characteristics of the gas fluxes from the soils applied with the two types of slow-release fertilizer were evaluated in comparison with those applied with urea, a conventional fast-acting chemical fertilizer.
2. Materials and Methods
2.1. Outline of experimental field and crop cultivation
The experiment was conducted in an experimental field (43°00ʹN, 141°23ʹE) of Hokkaido Agricultural Research Center, National Agriculture and Food Research Organization (HARC/NARO), located in Sapporo city in Hokkaido, a northern region in Japan. According to the climate data acquisition station of HARC/NARO, the mean annual temperature from 1991 to 2020 was 7.6°C, and the mean annual precipitation was 967 mm. The field is covered with snow generally from late November to March (Figure S1). The soil of the field is classified as Allophanic Andosols. The top layer of the soil at depths of 0–10 cm had a light clay texture (sand, 27.7%; silt, 38.6%; clay, 33.8%). The bulk density of the topsoil at depths of 0–10 cm was 0.83 Mg m−3, and the soil pH in H2O was 5.5. The carbon (C) and nitrogen (N) contents of the topsoil (at depths of 0–10 cm) were 55 mg C g soil−1 and 3.5 mg N g soil−1, respectively.
The field was cultivated with oat from 2016 to 2017 and then kept under fallow condition until this experiment. In this study, winter wheat (sown in autumn and harvested in the next summer) was cultivated in the field twice, from September 2018 to July 2019, and from September 2019 to July 2020. The wheat cultivar was Yumechikara, a major hard wheat cultivar planted in this region. The wheat seeds were sown in rows at intervals of 12.5 cm. Four experimental treatments amended with different N fertilizers were established according to a randomized block design with three replicate plots per treatment; each had an area of 12 m2 (4 m × 3 m) for the first wheat cultivation, and 15 m2 (5 m × 3 m) for the second wheat cultivation. The four N fertilizers were urea (hereafter, referred to as U treatment), urea coated with a film of polyolefin resin and inorganic minerals (CU treatment), calcium nitrate coated with a film of polyolefin resin and inorganic minerals (CC treatment), and no nitrogen fertilizers (NN treatment). As the coated urea and calcium nitrate, commercial fertilizers designed to elute 80% of the N within 40 days at 25°C (LP-40 and Long Calcium Nitrate-40, respectively; JCAM AGRI., Japan) were used. We referred to the previous field experiments carried out in Hokkaido described above (Central Agricultural Experiment Station, HRO Citation2013; Furudate et al. Citation2013; Kitami Agricultural Experiment Station, HRO Citation2018) in which applications of slow-release fertilizers with the elution types of 25–50 days were found to maintain the wheat grain yields, and then selected the fertilizers with the elution type of 40 days in this study. Superphosphate of lime and potassium chloride were used as the phosphate and potassium fertilizer amendments for all the treatments including the NN treatment. The total fertilization levels were 190–150–100 (N–P2O5–K2O) kg ha−1 for the U, CU, and CC treatments and 0–150–100 for the NN treatment. In the U treatment, the rates and timings of fertilizations followed those recommended in this region (Hokkaido Agricultural Association Citation2021). Basal application of N of 40 kg ha−1 was carried out in September (immediately before the wheat seed sowing), and the remaining N of 150 kg ha−1 was broadcasted on the soil surface after the next spring (90 kg N ha−1 in April and 60 kg ha−1 in May). In the CU and CC treatments, for the first wheat cultivation, basal application of total N of 190 kg ha−1 was carried out in September 2018, and no N fertilizer was applied thereafter. By applying all the slow-release fertilizers at the beginning of the cultivation, we expected to obtain maximum reduction in the N2O emission combined with no laborious supplemental fertilizations. However, as shown in the following, the wheat grain yields in the CU and CC treatments became significantly lower than that in the U treatment. Then, we reconsidered the experimental design, and changed the fertilization management in the CU and CC treatments in the second wheat cultivation. For the second wheat cultivation, in the CU and CC treatments, basal application of N of 130 kg ha−1 was carried out in September 2019, and the remaining N of 60 kg ha−1 was broadcasted using urea on the soil surface in the next May. By this fertilizer management, we aimed to maintain the wheat growth and grain yield by supplying the N required until the heading stage of the wheat by the basal application of the slow-release fertilizers in the autumn and that after the heading stage by the supplemental application of fast-acting fertilizer in the next late spring, although such N fertilizer managements may not have been the best way to minimize cumulative N2O emissions. All the superphosphate of lime and potassium chloride were incorporated to the soil in all the treatments (including the NN treatment) as the basal application in September.
The wheat plants grew normally except for those with the NN treatment. Flowering was observed around 30 May 2019 for the first cultivation and around 10 June 2020 for the second cultivation. The mature grains of the wheat were harvested on 10 July 2019 and 20 July 2020, respectively. At the wheat harvests, all the aboveground wheat straw except for the wheat stubble was removed from the field to minimize the organic matter remained in the soil. More details on the specific dates of agricultural practices and N fertilization rates are shown in .
Table 1. Dates of agricultural practices in the experimental field from 2018 to 2020
2.2. Measurements of N2O and NO fluxes
Nitrous oxide flux was measured during the wheat cultivation periods and for 35 to 40 days after the wheat harvests, with three replicates per treatment. The flux was measured generally twice a week immediately after the fertilizations, and once a week thereafter. From late November to the next mid March when the fields were continuously covered with snow, we did not measure the gas flux.
A square frame with a groove on the upper side was inserted into the soil to a depth of approximately 5 cm and was left throughout the wheat cultivation period. A chamber consisting of opaque polyvinyl chloride plates was placed on the groove of the frame. The bottom of the chamber was sealed with tap water filled in the groove. The chamber and the frame had a cross-sectional area of 0.075 m2 (0.3 m × 0.25 m). The height of the chamber was 0.3 m when the wheat plants were small. It was then increased stepwise to 0.6 m, 0.75 m, and 1.05 m by inserting an additional sidewall as the wheat plants grew taller. Air was sampled for flux measurement between 9:00 and 12:00. The chamber containing two rows of the wheat plants inside was closed for 25 min. The air inside the chamber was drawn three times (1, 13, and 25 min after closing the chamber) using a syringe and immediately injected into an evacuated glass vial of 15 ml. A gas chromatograph (GC; GC-2014, Shimadzu, Japan) equipped with an electron capture detector and a switching valve for preliminarily separating water vapor was used for N2O measurement. Argon mixed with 5% methane was used as the carrier gas.
For the second wheat cultivation period, we also measured the NO flux concomitantly with the measurement of the N2O flux. Air of 200 ml was drawn from the chamber using a syringe and injected into a 1,000 ml bag made of polyvinyl fluoride (Tedlar ® bag) at 1 and 25 min after closing the chamber. The air samples for the N2O and NO analyses were collected separately, i.e., at 1 and 25 min after the chamber closure, we first collected the air sample to the glass vial (for the N2O analysis), and then immediately collected the air sample to the Tedlar bag (for the NO analysis). The air in the bag was injected into a NOx analyzer (Model 42i, Nippon Thermo, Japan) for the analysis of NO concentration within 6 h.
Nitrous oxide and NO fluxes were calculated on the basis of the increasing/decreasing rates of the concentrations during the time when the chamber was closed. Cumulative gas emissions were calculated by integrating the measured instantaneous flux data by linear interpolation.
The percentages of emitted N with respect to applied N (EF; emission factor) (% – kg N kg N−1) as the cumulative N2O and NO emissions were calculated as
where C_N (kg N ha−1) is the cumulative N2O or NO emission in the treatments with N fertilization, C_NNN (kg N ha−1) is that in the NN treatments, and F_N (= 190 kg N ha−1) is the N fertilization rate.
2.3. Other data measurements
The air temperature inside the chamber was measured using a thermistor thermometer (CT-410WR, Custom, Japan) to calculate gas fluxes. Hourly data on ambient air temperature and precipitation were provided by the climate data acquisition station of HARC/NARO.
The volumetric soil water content at depths of 0–12 cm was measured using a portable time domain reflectometry (TDR) sensor (Hydrosense, Campbell Scientific, USA) on the days of gas flux measurements. Together with the modified TDR values obtained using the equation proposed by Hatano, Hasegawa, and Sakuma (Citation1995) and the soil bulk density data based on the soil core samples of the field obtained around the beginning and end of each wheat cultivation, the water-filled pore space (WFPS; ratio of the pore space filled with water in volume) of the soil was calculated.
Soil samples at depths of 0–5 cm were collected occasionally (generally weekly immediately after fertilizations and biweekly thereafter) for the analysis of soil inorganic N content. Soil samples were collected randomly from five sites in each replicate, mixed, and subjected to extraction while still fresh with potassium chloride solution (100 g l−1). Nitrate nitrogen was analyzed by hydrazine reduction-sulfanilamide, α-naphthylamine absorption spectrophotometry, and NH4-N was analyzed by indophenol blue absorption spectrophotometry in a continuous flow analyzer (QuAAtro2-HR, BL-TEC, Japan).
At wheat harvest, wheat plants within 1 m2 (0.5 m × 2.0 m) were collected in each replicate to determine the wheat grain yield. The collected wheat plants were bundled together and air-dried, threshed, and sieved. On the basis of the measured wheat grain weight and its water content, the modified wheat grain weight value with the assumed water content of 12.5% was calculated and shown as the wheat grain yield. The N and C contents of the dried wheat grains were measured using organic elemental analyzers (varioMAX CNS, elementar, Germany, and SUMIGRAPH® NC-TRINITY, Sumika Chemical Analysis Service, Japan).
2.4. Statistical analyses
The significance of differences in the N2O flux, cumulative N2O and NO emissions, wheat grain yield, and the N and C contents among the treatments were determined by two-way analysis of variance (ANOVA) and Tukey’s multiple comparison test with the treatment and the block effect as the dependent variables.
3. Results
3.1. Seasonal courses of N2O and NO fluxes
Seasonal courses of air temperature and precipitation, N2O and NO fluxes, soil water content, and soil NH4- and NO3-N contents are shown in . Throughout the autumn period in 2018 with the first wheat cultivation, the magnitudes and time courses were similar in all the treatments including the NN treatment. The N2O fluxes increased immediately after the basal fertilization, reached their maxima of 96–146 µg N m−2 h−1 6–9 days after the fertilization, and then decreased. Thereafter, other small temporary increases in the N2O flux were found during the autumn period, around October 5 and 19, and November 5 (). During this period, the soil water contents ranged between 0.6 and 0.8 in WFPS, and tended to increase gradually owing to the frequent precipitation and low evaporation rate at low ambient temperatures (). The soil NH4-N content was markedly higher in the CU treatment (maximum; 66 mg N kg soil−1) compared with the other treatments until October 22. On the other hand, increases in the soil NO3-N content were smaller, the maxima of which were lower than 35 mg N kg soil−1 in all the treatments ().
Figure 1. Seasonal courses of daily mean air temperature and precipitation (a), N2O flux (b), water-filled pore space (WFPS) of the soil at depths of 0–12 cm (c), and NH4- and NO3-N contents of the topsoil (d, e) in the experimental field during the first wheat cultivation period in autumn of 2018 (left) and from spring to summer of 2019 (right). U, CU, CC, and NN indicate the treatments with urea, coated urea, coated calcium nitrate, and no nitrogen applications, respectively. More details of the treatments are described in . The vertical error bars of the N2O flux and soil NH4- and NO3-N contents represent the standard deviations of three replicates. For better clarity of the figures, only the upper halves of the error bars are shown. Data on the WFPS are shown as the mean of all the replicate plots of the four treatments (two sites per plot: 24 sites in total), with error bars as the standard deviations of 24 replicates. For better clarity of the figures, only the upper halves of the error bars are shown. The vertical arrows with ‘BF,’ ‘SF,’ and ‘H’ represent the dates of basal and supplemental fertilizations and the wheat harvest, respectively. Note that the supplemental fertilizations were conducted only in the U treatment.
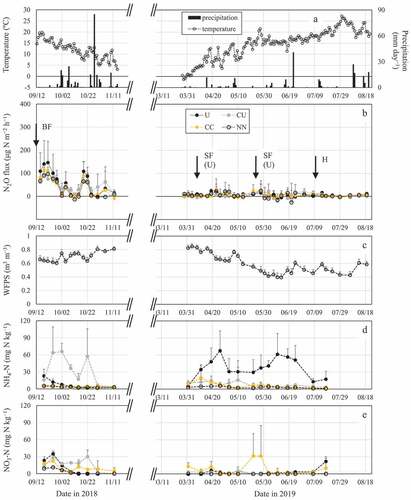
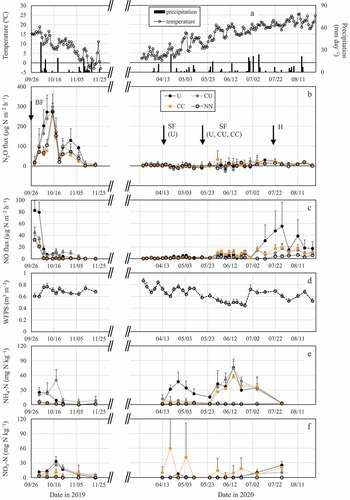
Figure 2. Seasonal courses in daily mean air temperature and precipitation (a), N2O and NO fluxes (b, c), water-filled pore space (WFPS) of the soil at depths of 0–12 cm (d), and NH4- and NO3-N contents of the topsoil (e, f) in the experimental field during the second wheat cultivation period in autumn of 2019 (left) and from spring to summer of 2020 (right). U, CU, CC, and NN indicate the treatments with urea, coated urea, coated calcium nitrate, and no nitrogen applications, respectively. More details of the treatments are described in . The vertical error bars of the N2O and NO fluxes and soil NH4- and NO3-N contents represent the standard deviations of three replicates. For better clarity of the figures, only the upper halves of the error bars are shown. Data on the WFPS are shown as the mean of all the replicate plots of the four treatments (two sites per plot: 24 sites in total), with error bars as the standard deviations of 24 replicates. For better clarity of the figures, only the upper halves of the error bars are shown. The vertical arrows with ‘BF,’ ‘SF,’ and ‘H’ represent the dates of basal and supplemental fertilizations and the wheat harvest, respectively. Note that the supplemental fertilization in April was conducted only in the U treatment, whereas the supplemental fertilization in May was conducted in the U, CU, and CC treatments.
In early spring in 2019 immediately after the end of snowmelt, no recognizable increases in the N2O flux were found in all the treatments, although the soil water content remained at high levels, around 0.8 in WFPS, until mid April (). In addition, the N2O fluxes thereafter remained low, lower than 30 µg N m−2 h−1 in most cases, until the wheat harvest in all the treatments. In particular, although supplemental fertilizers were broadcasted twice (April 8 and May 24) and the following increases in the soil NH4-N content were observed in the U treatment, the N2O fluxes in the U treatment also remained low (). After the wheat harvest on July 10, the N2O fluxes also remained low (lower than 20 µg N m−2 h−1) for 40 days in all the treatments ().
In the autumn of 2019 with the second wheat cultivation, the N2O fluxes increased immediately after the basal fertilization, reached their maxima of 250–299 µg N m−2 h−1 on October 15 (19 days after the fertilization), and then decreased. Other small temporary increases in the N2O flux were also found around the end of October. The fluxes tended to be higher in the U and CU treatments than in the CC and NN treatments until October 10. Thereafter, the fluxes were similar in all the treatments until the late autumn (). The maximum NO fluxes were found on September 29, immediately after the basal fertilizer application. They were 83, 44, 32, and 32 µg N m−2 h−1 in the U, CU, CC, and NN treatments, respectively. Thereafter, the NO fluxes decreased rapidly and remained lower than 15 µg N m−2 h−1 in all the treatments after October 10 (). The soil water content remained constant during the autumn of 2019, between 0.6 and 0.8 in WFPS, until late November (). In the U treatment, the initial high soil NH4-N content was followed by an increase in the soil NO3-N content, the maximum (33 mg N kg soil−1) of which was found on October 18. In the CU treatment, both the soil NH4- and NO3-N contents reached their maxima (50 and 26 mg N kg soil−1, respectively) on October 18. In the CC and NN treatments, both the soil NH4- and NO3-N contents were lower than those in the U and CU treatments, with no recognizable increases throughout the autumn period ().
In early spring in 2020 immediately after the end of snowmelt, no recognizable increases in the N2O flux were found in all the treatments, although the soil water content was relatively high, 0.6–0.8 in WFPS until mid April. In addition, the N2O fluxes thereafter remained consistently low, lower than 30 µg N m−2 h−1 in most cases, until the wheat harvest in all the treatments. Similar to the first wheat cultivation, although supplemental fertilizers were applied (twice in the U treatment and once in the CU and CC treatments) and the following increases in the soil NH4-N content were observed in these treatments, the N2O fluxes in the U, CU, and CC treatments also remained low. In the CC treatment, occasional sporadic increases in the soil NO3-N content were observed, but the increase in the soil NO3-N content did not seem to have enhanced the N2O flux either (). After the wheat harvest on July 20, the N2O fluxes also remained low (lower than 30 µg N m−2 h−1) for 35 days in all the treatments (). The NO fluxes also remained low (consistently lower than 15 µg N m−2 h−1) in all the treatments until June. Although the first supplemental fertilization was conducted in the U treatment in April, the NO flux also remained low in this treatment. Similarly, it also remained low after the supplemental fertilization in the U, CU, and CC treatments in May. On the other hand, after July, the NO fluxes in the U, CU, and CC treatments showed small increases, reaching their maxima of 55, 17, and 19 µg N m−2 h−1, respectively, on July 28 ().
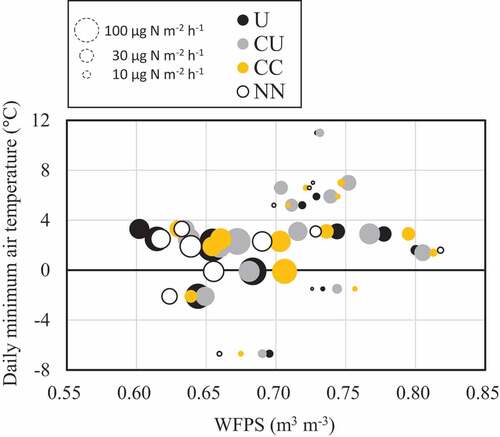
We investigated the major environmental factors related to the N2O flux in the autumn period after the first N2O flux peak ended (October 2–12 November 2018 and October 21–22 November 2019; hereafter, referred to as ‘mid–late autumn’), and found that the flux did not necessarily increase markedly immediately after rainfall (), but that the flux showed occasional marked increase when the soil WFPS and daily minimum air temperature ranged approximately from 0.6 to 0.7 m3 m−3 and from −2 to +3°C, respectively ().
Figure 3. Relationships among N2O flux, water-filled pore space (WFPS) of the soil at depths of 0–12 cm, and daily minimum air temperature in the experimental field with wheat cultivation. The magnitude of N2O flux is proportional to the size (area) of each circle . Data obtained from mid to late autumn after the first N2O flux peak ended (October 2–12 November 2018 and October 21–22 November 2019) are plotted. U, CU, CC, and NN indicate the treatments with urea, coated urea, coated calcium nitrate, and no nitrogen applications, respectively. More details of the treatments are described in .
3.2. Cumulative N2O and NO emissions
Cumulative N2O and NO emissions are summarized in . For the first wheat cultivation from 2018 to 2019, the cumulative N2O emissions in the CC and NN treatments (0.70 and 0.61 kg N ha−1, respectively) were lower than those in the U and CU treatments (0.88 and 0.85 kg N ha−1, respectively). However, the variations among the three replicates were generally large, and the differences in the cumulative N2O emissions were not statistically significant among the treatments. The apparent EFs of the U, CU, and CC treatments were calculated to be 0.14, 0.12, and 0.05%, respectively.
Table 2. Cumulative N2O and NO emissions from the experimental field from 2018 to 2020
The general levels of the cumulative N2O emission were higher for the second wheat cultivation from 2019 to 2020 than for the first wheat cultivation. Although the differences in the cumulative emission for the entire wheat cultivation period were not statistically significant among the treatments (P = 0.16 by two-way ANOVA), the emissions in the autumn tended to be lower in the CC and NN (0.78 and 0.88 kg N ha−1) than in the U and CU treatments (1.43 and 1.28 kg N ha−1) (P = 0.07). The apparent EFs of the U, CU, and CC treatments were calculated to be 0.32, 0.23, and 0.02%, respectively. For the second wheat cultivation, the cumulative NO emissions in the U, CU, CC, and NN treatments were 0.62, 0.35, 0.29, and 0.12 kg N ha−1, and the EFs of the U, CU, and CC treatments were calculated to be 0.26, 0.12, and 0.09%, respectively.
3.3. Wheat grain yield
Wheat grain yield and the N and C contents are summarized in . For the first cultivation, the grain yields in the CU and CC treatments (5.41–6.04 t ha−1) were significantly lower than that in the U treatment (7.47 t ha−1). For the second cultivation, the grain yields in the CU and CC treatments (6.87–7.15 t ha−1) were also slightly lower than that in the U treatment (7.67 t ha−1), although the differences were smaller than those in the first cultivation and were not statistically significant.
Table 3. Grain yield and nitrogen and carbon contents of the wheat in the experimental field from 2018 to 2020
The N content of the wheat grain also tended to decrease in the CU and CC treatments compared with the U treatment. The decrease was significant in the CU treatment for the first cultivation and in the CU and CC treatments for the second cultivation. Differences in the C content of the wheat grain among the U, CU, and CC treatments were small, although those between the U and CC treatments and between the CU and CC treatments in the first cultivation was statistically significant.
4. Discussion
4.1. Processes and responsible regulatory factors of N2O production in the soil
In this study, recognizable increases in the N2O flux were found in the autumn, i.e., at the beginning of the wheat cultivation with basal fertilization (). At the beginning of the second cultivation (until October 10), the N2O fluxes in the U and CU treatments tended to be higher than those in the CC and NN treatments. In particular, on October 7 and 10 when the N2O fluxes were increasing rapidly, the differences in the fluxes between the U and CC, and between the U and NN treatments were statistically significant. The soil NH4-N contents were also higher in the U and CU treatments than in the CC and NN treatments (). These results show that the increase in the N2O flux was closely related to the oxidation of NH4-N in the U and CU treatments, indicating the enhancement of N2O production via nitrification in the soil during this period. In addition, NO fluxes higher in the U and CU treatments than in the CC and NN treatments were also observed at the beginning of the second wheat cultivation (), which also indicates that N2O production via nitrification was enhanced in the soils in the U and CU treatments during this period. Lipschultz et al. (Citation1981) and Medinets et al. (Citation2015) reported that the N2O flux via nitrification is accompanied by the NO flux that is higher than the N2O flux, whereas that via denitrification is accompanied by the NO flux that is much lower than the N2O flux.
For other periods (i.e., except the beginning of the second wheat cultivation until October 10) both in the autumn of 2018 and 2019, the magnitudes of the N2O fluxes were similar and not largely different among the treatments including the NN treatment (). The soil water content remained relatively high levels from mid to late autumn, generally from 0.6 to 0.8 in WFPS, owing to frequent rainfalls and low evaporation at low ambient temperatures (). The production rate of N2O via denitrification generally increases markedly when the soil WFPS increases to high levels, with the optimum WFPS being 0.7–0.8 (Linn and Doran Citation1984; Bateman and Baggs Citation2005). Therefore, the results indicate that the temporary increases in the N2O flux from mid to late autumn were caused mainly by the enhancement of denitrification. In addition, in the autumn of 2019, the NO flux decreased after October 10 (), which also indicates that N2O was produced mainly via denitrification in the soil (Lipschultz et al. Citation1981; Medinets et al. Citation2015).
In more detail, we also found that both the soil WFPS and the gradual decrease in ambient temperature were closely related to the N2O flux from mid to late autumn. also indicate that the N2O flux was not necessarily enhanced immediately after rainfall with high soil WFPS, and was occasionally enhanced markedly when the daily minimum air temperature decreased to be around 0°C. Although detailed mechanisms of N2O production from mid to late autumn have not been determined in this study, the N2O production via denitrification might have been enhanced markedly when the soil water just below the soil surface was partially frozen and then melted in early morning, as similar enhancements of N2O flux according to the freeze-thaw cycle of the soil in early spring have been found in many previous studies (e.g., Yanai et al. Citation2011). Unfortunately, we did not measure the temperature or water content just below the soil surface in this study. Further studies in future focused on the combined effects of water and temperature conditions in the layers very close to the soil surface may elucidate detailed mechanisms of N2O production and emission from mid to late autumn in cool-temperate regions.
Around the snowmelt period in early spring in cool-temperate regions, temporary increases in the N2O flux were observed in many previous studies, which were also discussed in relation to the temporary enhancement of N2O production via denitrification under low O2 condition in microsites in the soils that are partially thawed, as described above. However, no such temporary increases in the N2O flux immediately after the end of snowmelt were observed in this study; the N2O flux remained low in this period in both 2019 and 2020 in this study (). Although the detailed reasons still remain unclear, the absence of recognizable increases in the N2O flux around the snowmelt periods may have been attributed to the relatively small soil frost depth in this region. Around the area of this field experiment (western region in Hokkaido), although the fields are continuously covered with snow during winter for 3–4 months, the soil frost depth generally does not become large since the soil temperature under the thick snow cover does not decrease to much lower than 0°C. In addition, in a neighboring experimental field of this study in HARC/NARO, we measured soil freeze depth by methylene blue method and observed that the soil freeze layer scarcely developed in the winter from 2018 to 2019 whereas it developed up to depth of 9 cm in the winter from 2019 to 2020 and disappeared before 18 March 2020 (Figure S1). This suggests that, in the case of this study, the temporary increase in N2O flux around the snowmelt period did not occur or had already ended before the first flux measurement in the spring.
After the end of snowmelt, the N2O flux was also consistently low in all the treatments. In particular, no recognizable increases in the N2O fluxes were observed even after the supplemental urea applications in the U treatment (twice in the spring of both 2019 and 2020) and in the CU and CC treatments (once in the spring of 2020), although clear temporary increases in the soil NH4-N content were found after these supplemental fertilizations (). The reasons for the absence of recognizable increases in the N2O flux after supplemental fertilizations have not been determined in this study. However, in some other previous studies in Hokkaido, such low N2O fluxes after fertilization in spring have also been observed in fields cultivated with various crops and vegetables, including onion, adzuki bean, sugar beet, potato, cabbage, and carrot (Kusa, Sawamoto, and Hatano Citation2002; Koga et al. Citation2004; Nishimura et al. Citation2021). These observations in the previous and present studies indicate that the enhancement of N2O production via nitrification can be suppressed at low levels at low ambient temperatures in spring in cool-temperate regions such as Hokkaido. In addition, the soil water content remained low in this season, generally lower than 0.6 in WFPS after 14 May 2019 and from May 18 to 25 June 2020 (). Therefore, N2O production via denitrification may not have been enhanced.
Here, we summarize the results on N2O emission from soils used for winter wheat cultivation in Hokkaido, as reported in previous publications and in this study (). As for the N2O flux after basal fertilization in autumn, recognizable increases have been found in many previous and present studies. Similarly, most of the studies (except this study) have found recognizable increases in the N2O flux around the snowmelt period in early spring. In contrast, as for the N2O flux related to supplemental fertilization after the spring, recognizable increases have rarely been found in the previous and present studies. Given these observations in these previous and present studies, in the soils with winter wheat cultivation in Hokkaido, the N2O production can be frequently enhanced at the beginning of the cultivation in early autumn owing to the N supply provided by the basal fertilization combined with the relatively high ambient temperatures. On the other hand, the N2O production may not be largely enhanced in the next spring even after supplemental N fertilization presumably owing to the low ambient temperature except for an occasional marked increase around the snowmelt period.
Table 4. Presence of recognizable increase in N2O flux from soils with winter wheat cultivation in Hokkaido reported in previous and present studies
4.2. Effects of slow-release fertilizers on cumulative N2O emission
In this study, although the differences in the cumulative N2O emissions were not statistically significant in both the first and the second wheat cultivations, the emissions were consistently lower in the CC and the NN than in the U and CU treatments. In addition, the differences in the N2O emission in autumn of 2019 were near the significant level (P = 0.07) (). The differences in the N2O emissions were attributed mainly to the higher N2O fluxes in the U and CU treatments presumably owing to the additional N2O production via nitrification observed at the beginning of wheat cultivation (until October 10) in the autumn of 2019 (). In another previous study, we also found a similar occasional decrease in N2O emission following the application of coated calcium nitrate from soils in this region cultivated with carrot (Nishimura et al. Citation2021). On the basis of these results of the previous and present studies, the decrease in N2O emission following the application of coated calcium nitrate, with no N2O production via nitrification, may be expected to some extent in cool-temperate regions such as Hokkaido, although such decreases in the N2O flux have not always been observed and further studies are required in the future.
On the other hand, N2O emissions in the CU treatment were similar to those in the U treatment in both wheat cultivations. Our previous study also showed no significant decreases in N2O emission following the application of coated urea in a field cultivated with carrot (Nishimura et al. Citation2021). Although reductions in N2O emissions after the applications of slow-release urea and other ammonium fertilizers have been observed in many previous studies (e.g., Akiyama, Yan, and Yagi Citation2010), detailed seasonal variations in the N2O flux largely differ depending on various factors such as drainage characteristics of soils (Akiyama, Yan, and Yagi Citation2006) and local climate conditions. Nitrogen in the coated urea is gradually hydrolyzed and then nitrified in the soil, although the processes are decelerated compared with bare urea or other bare ammonium fertilizers. This indicates that the N2O production rate via nitrification is not always decreased by using coated urea.
4.3. Effects of slow-release fertilizers on wheat grain yield
Unlike other previous studies conducted in other regions in Japan (Yamaya et al. Citation1991; Takei and Ikeda Citation2004; Ishii Citation2009; Nakatsukasa, Kimura, and Ariyoshi Citation2010; Araki Citation2017; Hasukawa et al. Citation2017), wheat grain yield tended to decrease after the applications of slow-release fertilizers in this study. For the first wheat cultivation with all the N applied as basal fertilizations in the CU and CC treatments, wheat grain yields decreased significantly compared with that in the U treatment (decreases of 28 and 19%, respectively) (). Therefore, wheat cultivation with no supplemental fertilization (by the application of all the N in autumn) may be quite difficult in this region. On the other hand, as for the second wheat cultivation, although the wheat yields in the CU and CC treatments also decreased compared with that in the U treatment, the amounts of the decreases were small (7 and 11%, respectively) and were not statistically significant ().
On the basis of these results, we expect that winter wheat cultivation omitting supplemental fertilization around early spring and applying fertilizers twice, the first as the basal application in autumn and the second as the supplemental application around the next late spring, is possible in this region if suitable amounts of fast-acting and slow-release N are properly supplied to the soil at each fertilization. As described in the introduction, such omission of the first supplemental fertilization in early spring is highly valuable for farmers cultivating winter wheat in cool-temperate regions. Unfortunately, the amounts and types of fertilizer supplied in this study (CU and CC treatments) were found to be not the best to obtain optimal wheat grain yields even for the second cultivation experiment. In addition, the N content of the wheat grain, which is an important index of the quality of wheat flour, also tended to decrease in the CU and CC treatments in this study (). Furthermore, the results of this study are not consistent with those of previous studies (Central Agricultural Experiment Station, HRO Citation2013; Furudate et al. Citation2013; Kitami Agricultural Experiment Station, HRO Citation2018) in which wheat yields in treatments applied with slow-release fertilizers did not decrease compared with those applied with conventional fertilizers. Therefore, further intensive studies are still required to determine the optimum allocation levels of the conventional and slow-release fertilizers supplied as the basal and supplemental applications, respectively, in fields in various locations.
5. Conclusions
The results of this study indicate that reduction in N2O emission with no decrease in the wheat yield can be achieved by the basal application of slow-release nitrate fertilizer combined with the supplemental application of conventional fertilizer in winter wheat cultivation in Hokkaido. However, further intensive studies are still required to determine the optimum allocation levels of the basal and supplemental N applications to decrease N2O emission while maintaining wheat grain yield and quality.
Supplemental Material
Download MS Word (59.7 KB)Acknowledgments
The authors would like to thank Shigeto Sudo and Hiroko Akiyama of the Institute for Agro-Environmental Sciences, NARO for support in the N2O and NO analyses, and Atsushi Yagioka of HARC/NARO for support in the plant N and C analyses. The authors also thank Yumi Ito of HARC/NARO for support in the air sampling and the gas analysis with GC and NOx analyzer, and the staff of the experimental field management section of HARC/NARO for support in the field management. This work was supported by a grant under the project ‘Assessment and extension of technologies for mitigating greenhouse gas emissions from agricultural soil’ by the Ministry of Agriculture, Forestry and Fisheries, Japan, and JSPS KAKENHI Grant Number JP17 K08178. Any information on the experimental data shown in this article is available upon request to S. Nishimura.
Disclosure statement
No potential conflict of interest was reported by the author(s).
Supplementary material
Supplemental data for this article can be accessed here
Additional information
Funding
References
- Akiyama, H., and H. Tsuruta. 2002. “Effect of Chemical Fertilizer Form on N2O, NO and NO2 Fluxes from Andisol Field.” Nutrient Cycling in Agroecosystems 63: 219–230. doi:10.1023/A:1021102925159.
- Akiyama, H., X. Yan, and K. Yagi. 2006. “Estimations of Emission Factors for Fertilizer-induced Direct N2O Emissions from Agricultural Soils in Japan: Summary of Available Data.” Soil Science and Plant Nutrition 52: 774–787. doi:10.1111/j.1747-0765.2006.00097.x.
- Akiyama, H., X. Yan, and K. Yagi. 2010. “Evaluation of Effectiveness of Enhanced-efficiency Fertilizers as Mitigation Options for N2O and NO Emissions from Agricultural Soils: Metaanalysis.” Global Change Biology 16: 1837–1846. doi:10.1111/j.1365-2486.2009.02031.x.
- An, H., J. Owens, B. Beres, Y. Li, and X. Hao. 2021. “Nitrous Oxide Emissions with Enhanced Efficiency and Conventional Urea Fertilizers in Winter Wheat.” Nutrient Cycling in Agroecosystems 119: 307–322. doi:10.1007/s10705-021-10118-9.
- Araki, M. 2017. “Kankousei-hiryou wo Riyou Shita Fukuoka-’Rā-mugi’ no Shouryoku-sehi Gijutsu [Labor Saving Cultivation of Wheat Cultivar ‘Fukuoka-rā-mugi’ Using Slow-Release Fertilizer].“ Nougyou to Kagaku [Agriculture and Science] 696:6–9. Tokyo: JCAM AGRI. CO. ( in Japanese).
- Bateman, E. J., and E. M. Baggs. 2005. “Contributions of Nitrification and Denitrification to N2O Emissions from Soils at Different Water-filled Pore Space.” Biology and Fertility of Soils 41: 379–388. doi:10.1007/s00374-005-0858-3.
- Bouwman, A. F. 1990. “Exchange of Greenhouse Gases between Terrestrial Ecosystems and the Atmosphere.” In Soils and the Greenhouse Effect, edited by A. F. Bouwman, 61–127. Chichester: John Wiley & Sons.
- Central Agricultural Experiment Station, Hokkaido Research Organization. 2013. “Hifuku Nyouso Hiryou no Hatachi ni okeru Chisso Youshutsu Tokusei to Burokkorî oyobi Aki-maki Komugi ni taisuru Seyouhou [Elution Property of Coated Urea in Fields, and Methods of Coated Urea Applications in Broccoli and Winter Wheat Cultivations].” Fukyuu-shourei narabini Shidou-sankou Jikou [New Agricultural Technologies Recommended for Farmers in Hokkaido] 25:120–122. Sapporo: Hokkaido Government. ( in Japanese).
- Denman, K. L., G. Brasseur, A. Chidthaisong, P. Ciais, P. M. Cox, R. E. Dickinson, and D. Hauglustaine. 2007. “Couplings between Changes in the Climate System and Biogeochemistry.” In Climate Change 2007: The Physical Science Basis. Contribution of Working Group I to the Fourth Assessment Report of the Intergovernmental Panel on Climate Change, edited by S. Solomon, D. Qin, M. Manning, Z. Chen, M. Marquis, K. B. Averyt, M. Tignor, et al., 500–587. Cambridge: Cambridge University Press.
- Food and Agriculture Organization of the United Nations. 2021. FAOSTAT. Italy: Statistics Division Food and Agriculture Organization of the United Nations. Accessed 16 February 2022. http://www.fao.org/faostat/en/#home
- Furudate, A., M. Onodera, T. Suda, and Y. Hikasa. 2013. “Banshun-maki Burokkorî oyobi Aki-maki Komugi “Kitahonami” ni taisuru Hifuku Nyouso Hiryou wo Mochiita Shouryokuteki Sehihou [Effect of Coated Urea Fertilizer on Fertilization of Omission Split Dressing with Late Spring Sowing Broccoli and Winter Wheat “Kitahonami”.“Hokunou 80:391–397. Sapporo: Hokunoukai PIIF. ( in Japanese with English Title).
- Greenhouse Gas Inventory Office of Japan. 2021. “National Greenhouse Gas Inventory Report of JAPAN, 2021.” Tsukuba: Greenhouse Gas Inventory Office of Japan, Center for Global Environmental Research, National Institute for Environmental Studies. Accessed 16 February 2022. http://www.cger.nies.go.jp/en/activities/supporting/publications/report/index.html
- Hasukawa, H., S. Toritsuka, Y. Takahashi, S. Sudo, N. Ooura, K. Nishina, and T. Sano. 2017. “Effect of Controlled Release Fertilizer on Nitrous Oxide Emission from Gray Lowland Soil of a Wheat–Soybean Cropping System.” Japanese Journal of Soil Science and Plant Nutrition 88:109–119. in Japanese with English summary. doi:10.20710/dojo.88.2_109.
- Hatano, R., S. Hasegawa, and T. Sakuma. 1995. “Calibration for the Measurement of Soil Water Content Using Time Domain Reflectrometry (TDR).” Japanese Journal of Soil Science and Plant Nutrition 66:678–680. in Japanese with English title. doi:10.20710/dojo.66.6_678.
- Hokkaido Agricultural Association. 2021. “Hokkaido no Komugi-zukuri [Instruction Manual of Wheat Cultivation in Hokkaido].” Sapporo: Hokkaido Agricultural Association. (in Japanese). Accessed 16 February 2022. https://hokkaido-nosan.or.jp/products/wheat/data/page-2354/
- Hutchinson, G. L., and E. A. Davidson. 1993. “Processes for Production and Consumption of Gaseous Nitrogen Oxides in Soil.” In Agricultural Ecosystem Effects on Trace Gases and Global Climate Change, edited by D. E. Rolston, L. A. Harper, A. R. Mosier, and J. M. Duxbury, 79–93. Madison: ASA, CSSA, and SSSA.
- Ishii, H. 2009. “Single Basal Application Method with Slow-Releasing Nitrogen Fertilizer for Wheat.” Abstract of 2009 Annual Meeting of Kanto Branch, Crop Science Society of Japan, Tsuchiura city 24:44–45. (in Japanese with English title). doi:10.20768/jcskanto.24.0_44.
- Jiang, J., Z. Hu, W. Sun, and Y. Huang. 2010. “Nitrous Oxide Emissions from Chinese Cropland Fertilized with a Range of Slow-Release Nitrogen Compounds.” Agriculture, Ecosystems & Environment 135: 216–225. doi:10.1016/j.agee.2009.09.014.
- Kitami Agricultural Experiment Station, Hokkaido Research Organization. 2018. “Hikou-chousetsu-gata Hiryou wo Mochiita Aki-maki Komugi no Zenryou Kihi Seyouhou [Methods of Winter Wheat Cultivation with the All Fertilizer Applied as the Basal Dressing Using Controlled-release Fertilizer].” Fukyuu-shourei narabini Shidou-sankou Jikou [New Agricultural Technologies Recommended for Farmers in Hokkaido] 30: 89–92. Sapporo: Hokkaido Government. (in Japanese).
- Koga, N. 2013. “Nitrous Oxide Emissions under a Four-year Crop Rotation System in Northern Japan: Impacts of Reduced Tillage, Composted Cattle Manure Application and Increased Plant Residue Input.” Soil Science and Plant Nutrition 59: 56–68. doi:10.1080/00380768.2012.733870.
- Koga, N., H. Tsuruta, T. Sawamoto, S. Nishimura, and K. Yagi. 2004. “N2O Emission and CH4 Uptake in Arable Fields Managed under Conventional and Reduced Tillage Cropping Systems in Northern Japan.” Global Biogeochemical Cycles 18: GB4025. doi:10.1029/2004GB002260.
- Kusa, K., T. Sawamoto, and R. Hatano. 2002. “Nitrous Oxide Emissions for 6 Years from a Gray Lowland Soil Cultivated with Onions in Hokkaido, Japan.” Nutrient Cycling in Agroecosystems 63: 239–247. doi:10.1023/A:1021167202601.
- Linn, D. M., and W. Doran. 1984. “Effect of Water-filled Pore Space on Carbon Dioxide and Nitrous Oxide Production in Tilled and Nontilled Soils.” Soil Science Society of America Journal 48: 1267–1272. doi:10.2136/sssaj1984.03615995004800060013x.
- Lipschultz, F., O. C. Zafirou, S. C. Wofsy, M. B. McElroy, F. W. Valois, and S. W. Watson. 1981. “Production of NO and N2O by Soil Nitrifying Bacteria.” Nature 294: 641–643. doi:10.1038/294641a0.
- Medinets, S. U., H. Skiba, K. Rennenberg, and B. Butterbach. 2015. “A Review of Soil NO Transformation: Associated Processes and Possible Physiological Significance on Organisms.” Soil Biology & Biochemistry 80: 92–117. doi:10.1016/j.soilbio.2014.09.025.
- Ministry of Agriculture, Forestry and Fisheries of Japan. 2021. Sakkyou Chousa [Statistics of Crop Yield]. ( in Japanese). Accessed 16 February 2022. https://www.maff.go.jp/j/tokei/kouhyou/sakumotu/sakkyou_kome/index.html#r
- Myhre, G., D. Shindell, F. M. Bréon, W. Collins, J. Fuglestvedt, J. Huang, D. Koch, et al. 2013. “Anthropogenic and Natural Radiative Forcing.” In Climate Change 2013: The Physical Science Basis. Contribution of Working Group I to the Fifth Assessment Report of the Intergovernmental Panel on Climate Change, edited by T. F. Stocker, D. Qin, G. K. Plattner, M. Tignor, S. K. Allen, J. Boschung, A. Nauels, et al., Cambridge: Cambridge University Press. 659–740.
- Nagata, O., T. Sugito, S. Kobayashi, and R. Sameshima. 2009. “Nitrous Oxide Emissions following the Application of Wheat Residues and Fertilizer under Conventional-, Reduced-, and Zero-tillage Systems in Central Hokkaido, Japan.” Journal of Agricultural Meteorology 65: 151–159. doi:10.2480/agrmet.65.2.3.
- Nakatsukasa, M., K. Kimura, and M. Ariyoshi. 2010. “Method of Fertilizer Application to Save Labor in Wheat Cultivar “Nishinokaori” Cultivation.” Bulletin of the Yamaguchi Prefectural Technology Center for Agricultural and Forestry. 1. 56–70. in Japanese with English summary.
- Nishimura, S., T. Sugito, A. Nagatake, and N. Oka. 2021. “Nitrous Oxide Emission Reduced by Coated Nitrate Fertilizer in a Cool-Temperate Region.” Nutrient Cycling in Agroecosystems 119: 275–289. doi:10.1007/s10705-020-10116-3.
- Ohnishi, J. 2016. “Hikou-chousetsugata Hiryou wo Mochiita Koushitsu-komugi no Shouryoku-sehi-gijutsu [Labor Saving Cultivation of Hard Wheat Using Controlled-Release Fertilizer].“ Nougyou to Kagaku [Agriculture and Science] 681: 1–4. Tokyo: JCAM AGRI. CO. (in Japanese).
- Shi, Y., W. Wu, F. Meng, Z. Zhang, L. Zheng, and D. Wang. 2013. “Integrated Management Practices Significantly Affect N2O Emissions and Wheat–Maize Production at Field Scale in the North China Plain.” Nutrient Cycling in Agroecosystems 95: 203–218. doi:10.1007/s10705-013-9558-9.
- Shioaku, K., K. Niwa, M. Nakamura, S. Nishimura, Y. Kominami, O. Nagata, I. Kitagawa, and K. Kobayashi. 2019. “Effect of Soil Layer Improvement on Nitrous Oxide Emissions from Soil in Hokkaido Tokachi Farmland.” Japanese Journal of Soil Science and Plant Nutrition 90:47–54. in Japanese with English summary. doi:10.20710/dojo.90.1_47.
- Takei, M., and A. Ikeda. 2004. “Improvement of Grain Protein Content by the Non-Split Application of Fertilizer in Wheat Culture.” Research Bulletin of the Aichi Agricultural Research Center. 36. 1–6. in Japanese with English summary.
- Toma, Y., M. Onishi, Y. Shiratori, S. Sudo, S. Nishimura, and H. Ueno. 2018. “Effects of Controlled-Release Nitrogen Fertilizer on Soil Nitrous Oxide Emissions from Broccoli (Brassica Oleracea Var. Italica) Autumn-Cultivation Field.” Japanese Journal of Soil Science and Plant Nutrition 89:302–310. in Japanese with English summary. doi:10.20710/dojo.89.4_302.
- Yamaya, S., T. Kodama, Y. Kaneta, and H. Naganoma. 1991. “Teishitsu-juunendo ni okeru Komugi no Eiyou-shindan to Kouritsuteki Sehi [Effective Fertilization Based on Nutritional Diagnosis of Wheat Cultivated in Field with Wet Lowland Heavy Clay Soil].” Abstract of 1991 Annual Meeting, Japanese Society of Soil Science and Plant Nutrition, Nagoya city 37: 247. ( in Japanese). doi:10.20710/dohikouen.37.0_247_2.
- Yan, G., Z. Yao, X. Zheng, and C. Liu. 2015. “Characteristics of Annual Nitrous and Nitric Oxide Emissions from Major Cereal Crops in the North China Plain under Alternative Fertilizer Management.” Agriculture, Ecosystems & Environment 207: 67–78. doi:10.1016/j.agee.2015.03.030.
- Yanai, Y., T. Hirota, Y. Iwata, M. Nemoto, O. Nagata, and N. Koga. 2011. “Accumulation of Nitrous Oxide and Depletion of Oxygen in Seasonally Frozen Soils in Northern Japan – Snow Cover Manipulation Experiments.” Soil Biology & Biochemistry 43: 1779–1786. doi:10.1016/j.soilbio.2010.06.009.