
 ?Mathematical formulae have been encoded as MathML and are displayed in this HTML version using MathJax in order to improve their display. Uncheck the box to turn MathJax off. This feature requires Javascript. Click on a formula to zoom.
ABSTRACT
Paddy soil temperatures (Ts) are required to evaluate the mineralization patterns of organic fertilizers in rice paddies. We have developed an estimation method for Ts based on the heat balance model using Agro-Meteorological Grid Square Data (AMD) with a horizontal resolution of 1 km × 1 km. The paddy water temperature (Tw) (daily mean, assuming leaf area index LAI = 0) was first calculated from the AMD using the heat balance equation. Next, the daily mean Ts was evaluated using the empirical relationship between Ts and Tw. The value of Ts can be expressed as a linear function of a time series for Tw for up to 3 days prior. At five test sites in Niigata prefecture, Japan, the mean difference and root mean square errors between the estimated and measured Ts ranged from −0.54°C to 0.77°C (mean: 0.00°C) and from 0.53°C to 1.21°C (mean: 0.86°C), respectively. Overall, the results using the estimated Ts were found to agree with the observations for each field. Using the developed Ts estimation method and the nitrogen (N) mineralization parameters of organic fertilizers, we estimated the N mineralization patterns of four fertilizers at five test sites. The results show a good agreement with the measured values. This suggests that the proposed Ts estimation method in conjunction with the AMD can be utilized to estimate the N mineralization of organic fertilizers applied in paddy fields in Niigata prefecture.
1. Introduction
Soil temperature (Ts) affects the growth of crops via microbial activity, root growth, and decomposition of organic matter. In paddy fields, Ts affects the mineralization and immobilization of nitrogen (N) in the soil (Sugihara, Konno, and Ishii Citation1986; Takahashi and Yamamuro Citation1992), and the mineralization of organic N through the decomposition of rice residues such as straw and compost (Hioki, Kitamura, and Katou Citation2001). N elution from slow-release fertilizers such as coated urea, is also affected by Ts (Ishibashi, Konno, and Kimoto Citation1992). If an N mineralization pattern, i.e., the amount and timing of N mineralization, is not appropriate for the growth of paddy rice, the excess N uptake will eventually lead to lodging and an increase in the protein content of the rice grain, resulting in a significant decrease in both yield and quality (Kato et al. Citation2001). Hence, the rationalization of fertilizer applications based on the kinetic analysis of soil N mineralization has been recognized as important and is promoted in Japan (Moritsugu, Ishibashi, and Oya Citation2009). The accurate estimation of paddy Ts at an arbitrary point to predict the N mineralization of soil and organic fertilizers has a significant impact on rice cultivation. In particular, the Ts during the period from the transplant to the maximum tillering stage at the end of June is known to differ greatly from the air temperature in northern Japan, including in the Hokuriku region, and it is generally 3 − 4°C higher than the air temperature (Takami, Sugaya, and Toriyama Citation1989).
The estimation of paddy Ts based on meteorological data (air temperature, solar radiation, etc.) and the Leaf Area Index (LAI) of the paddy rice have previously been reported (Inoue Citation1985; Takami, Sugaya, and Toriyama Citation1989). However, the meteorological data required for the estimation of Ts at an arbitrary location must be based on the Automated Meteorological Data Acquisition System (AMeDAS) of the Japan Meteorological Agency (JMA), but the accuracy of Ts estimations when using this data may be lower at locations further from the AMeDAS observation points, which distributed with a mean distance of approximately 21 km.
In recent years, a system for estimating and distributing meteorological elements at approximately 1 km2 grid units, called Agro-Meteorological Grid Square Data (AMD), based on data from the AMeDAS observation points and Grid Point Value (GPV) of JMA has been established (Seino Citation1993; Ohno Citation2014). This provides data on factors such as air temperature, precipitation, sunshine duration, solar radiation, downward longwave radiation, relative humidity, wind speed, and snow depth at a grid scale of 1 km2. For air temperature (mean, maximum, and minimum temperatures), precipitation, and sunshine duration, historical and average values from 1980 and forecasts for up to 26 days ahead are available (Ohno Citation2014). The estimation accuracy is 0.66°C, 0.98°C, 1.10°C, and 5.9 mm for the root mean square error (RMSE) of the daily mean, maximum, and minimum air temperature, and daily accumulated precipitation, respectively, which is sufficient to provide the air temperatures for the locations at which no AMeDAS observations are available (Ohno et al. Citation2016).
On the other hand, it is necessary to consider the effect of paddy water temperature (Tw) due to water permeability as well as heat conduction from the water when estimating paddy Ts. Nishida et al. (Citation2017) presented an equation that can predict the amplitude of Ts at different soil depths using the heat conduction equation in the soil. Takami, Sugaya, and Toriyama (Citation1989) estimated Ts from the observational relationships between Ts and Tw where Tw is evaluated using a heat balance equation, but currently, there is no simple model for Ts that considers water percolation and heat conduction from paddy water.
The use of slow-release fertilizers and organic fertilizers has been increasing in paddy rice fields to promote environmentally friendly agriculture and certification of specially cultivated agricultural products (e.g., cultivation with less than 50% N delivered from chemical fertilizers) in Japan. The elution and mineralization of N components from organic fertilizers are temperature-dependent; therefore, the estimation and prediction of Ts is important to understand the elution and mineralization patterns of N and hence to select an appropriate fertilizer.
The purpose of this study was to develop a model for estimating Ts in a paddy field, considering empirically the water percolation and heat conduction from the paddy water. We also verified the accuracy using AMD to use this model at arbitrary place. The obtained Ts were then used to estimate the N mineralization pattern of organic fertilizers by using an adequate mineralization model when compared with the measured value.
2. Materials and Methods
2.1. Meteorological observation field and soil temperature measurements
Meteorological observations were made at the Niigata Agricultural Research Institute (NARI) at Niigata Prefecture, Japan (37.437°N, 138.873°E), and obtained data (air temperature, solar radiation, relative humidity, and wind speed) were used to develop the equation for estimating Ts described in Section 2.3. Paddy Ts was measured at hourly intervals at a point (approximately 3 m from the bund) that was not affected by the irrigated water temperature in the test field (1,000 m2) at NARI during the crop season, and it was used to determine the daily average Ts. A thermometer (TR-52, T&D co. LTD) was set at a depth of 5 cm, where most rice roots are distributed (Yuasa, Iwata, and Aoki Citation1986). Ts were measured for 9 years (2008 − 2016). Measured Ts during 2008−2015 were used for calibration and those in 2016 for validation. This field is classified as fine-grained Mottled Gley Lowland Soil according to the First Draft of the Comprehensive Soil Classification (Obara et al. Citation2011) and has been cropped with paddy rice (Oryza. sativa L. cv. Koshihikari) under almost identical management throughout the experiment. Flooding continued from May to late June. Transplanting was around May 10, the heading stage was in early August, and maturity was reached in mid-September. To verify the accuracy of the developed estimation formula over a wide area, Ts were measured at five paddy fields () in the same way as NARI in 2016.
Table 1. Outline of test fields
2.2. Agro-Meteorological Grid Square Data
In this study, the AMD was used to estimate the paddy Tw at five test sites in Niigata prefecture. The AMD are a seamless combination of past and forecasted meteorological data. The past AMD are made by combining the mesh climatic data (gridded normal value data) and the day-to-day meteorological data observed at AMeDAS. Observational facilities of AMeDAS are located in approximately 1,300 locations throughout Japan. The AMD are updated daily based on the latest observations and forecasts. According to the verification of the accuracy of AMD by Ohno et al. (Citation2016), the RMSE of the daily mean temperature (2008 − 2012) in Joetsu, Niigata prefecture, was 0.52°C. The RMSE of the daily mean temperature in Nagaoka and Seiro, Niigata prefectures, was 0.72°C and 0.12°C, respectively, according to the preliminary verification by the authors (1991 − 2010).
2.3. Estimation of soil temperature
Tw-model based on the heat balance of paddy water by Kuwagata, Hamasaki, and Watanabe (Citation2008) was used to estimate Tw. Although the validation of the Tw-model was not made in the present study, we had already found that the model can evaluate daily mean Tw with accuracies of RMSE = 0.7°C to 1.9°C (e.g., Kuwagata, Hamasaki, and Watanabe Citation2008; Kuwagata et al. Citation2011; unpublished data). Since we are interested in the early growth stage of rice, the leaf area index (LAI) = 0 are assumed for evaluating Tw. Ts were then estimated using multiple-regression analysis with Tw as an explanatory variable. First, Tw was estimated by substituting the observed meteorological data into the Tw-model. In order to estimate Tw for LAI = 0 using the Tw-model: daily mean air temperature (°C), solar radiation (MJ m−2 d−1), relative humidity (%), and wind speed (m s−1) are required. Tw was estimated from these four meteorological parameters observed at NARI from 2008 to 2015. When, considering water percolation and heat conduction, six regression equations were developed using the estimated Tw delivered from the target day to 5 days before as the explanatory variable to estimate Ts on the target day. The accuracy of each equation is examined by comparing the results with the measured Ts. Among the six estimation equations, the estimation equation with the largest adjusted coefficient of determination (R2) was judged to be optimal. The period for estimating Ts was from May 11 to June 30, assuming that the effect of LAI on Ts was relatively small until the maximum tillering stage (Takami, Sugaya, and Toriyama Citation1989).
To compare the accuracy of the Ts estimations from the developed equations with the previously developed methods, Ts was measured in 2016 in paddy fields at five sites in Niigata prefecture shown in , using the same manner as described in Section 2.1. The mean difference (bias) and the RMSE between the measured and estimated Ts were evaluated for the five sites. Here, AMD was used for estimating Ts. In this study, three models, Takami, Sugaya, and Toriyama (Citation1989), Nishida et al. (Citation2014), and Moritsugu et al. (Citation2016) were used to estimate paddy Ts. The details of each model are shown in . To estimate Ts, Takami, Sugaya, and Toriyama (Citation1989) employed the empirical relationship between Ts and Tw, where Tw was calculated from heat balance equation using mean air temperature, solar radiation, and humidity. Nishida et al. (Citation2014) estimated Ts by mean air temperature and maximum air temperature. Moritsugu et al. (Citation2016) used regression equation of mean air temperature and solar radiation for estimation of Ts. The regression coefficients of the Takami and Moritsugu models were calculated based on the meteorological data at NARI from 2008 to 2015.
Table 2. Details of the equations previously published for estimating soil temperature
2.4. Estimation of the nitrogen mineralization patterns for organic fertilizers and the effect of soil temperature
Four fertilizer (A, B, C, and D), with different organic N content were tested (). According to the analyzed data of the fertilizer company, the organic N content to total N components ranged from 48% for fertilizer B to 100% for fertilizer A. The organic component contained in each fertilizer is mainly derived from animal debris powder, plant by-products, and vegetable oil cake, while some also contain dried fungi and bone meal. Except for the organic N in the fertilizer, the N was contained in the chemical fertilizer. According to Fertilizer Control Law in Japan, fertilizer A (100% organic matter) is classified as an organic fertilizer (mixed organic fertilizer), and fertilizers B to D are classified as mixed fertilizers (chemical fertilizers). We have described all of them here as organic fertilizers for convenience.
Table 3. Source of organic materials in the fertilizers used for this study and the proportion of nitrogen in total nitrogen of the fertilizers
To estimate the N mineralization pattern of each fertilizer, incubation tests were conducted. Soil was collected from the plow layer of the paddy field at NARI, and the moisture content was adjusted to approximately 50% after passing through a 2.8 mm sieve. The equivalent of 10 mg of N was mixed with fresh paddy soil (20 g of dry soil equivalent), and the treated soil was incubated in a glass tube under anaerobic waterlogged conditions at 15°C, 20°C, and 25°C, respectively, with two replicates. After 3, 7, 14, 28, and 56 days of incubation, 2 M potassium chloride solution equivalent to 10 times the amount of dry soil was added, and the supernatant liquid was filtered after shaking for 30 minutes to determine the ammonium N using the indophenol method. The optimum N mineralization model was determined using the kinetic method (Sugihara, Konno, and Ishii Citation1986) based on the obtained N mineralization values, and the N mineralization characteristics of each fertilizer were determined. Three mineralization models, a simple type (one first-order reaction) model, a two-simple type (combination of two first-order reactions) model and a mineralization and immobilization model (simple-type mineralization combined with simple-type immobilization) were examined. Parameters of each model were calculated using a Simplex method and evaluated by Akaike’s Information criterion (AIC) (unpublished data) and was finally adopted as the optimal mineralization model.
The optimal N mineralization pattern of the fertilizers tested was determined, and the following simple N mineralization equation was fitted to all fertilizers:
where, Nm = amount of mineralized N (%), A = percentage of decomposable organic N (%), k = mineralization rate constant (day−1), DTS = days transformed to standard temperature at 25°C (day), b = constant derived by regression analysis (%), R = gas constant (8.318 J K−1 mol−1), T = incubation temperature (°C), and D = incubation duration (day). Decomposable N represents the inorganic N caused by the mineralization of organic N. The number of days transformed to 25°C (DTS) was calculated from the incubation temperature and the apparent activation energy (Ea) for the mineralization rate of decomposable organic N. Ea, k, and A were calculated to be the values that minimize the sum of the residual squares of the differences between the estimated and measured values using the solver function of MS-Excel®.
To examine the accuracy of the estimations for the N mineralization patterns of each fertilizer at an arbitrary point, fertilizers were treated in the same manner as in the forementioned incubation tests that were conducted in paddy fields (depth of 5 cm), i.e., the soil incubation experiment under field condition, at the five points in Niigata prefecture as shown in in 2016. Incubated fertilizers were collected 3–56 days later to measure the amount of N mineralization. The N mineralization of each fertilizer was estimated by substituting the Ts estimated from AMD into the optimal mineralization model given in the results and compared with the measured values.
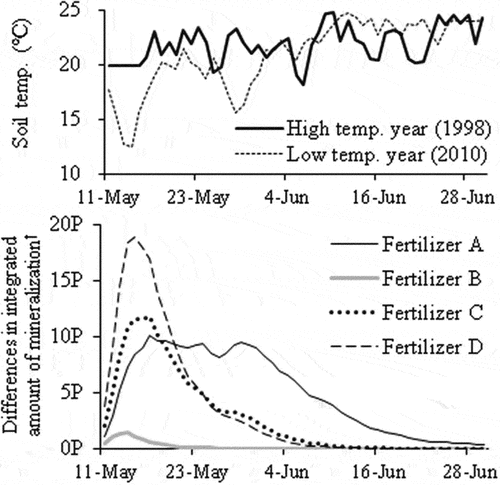
Furthermore, to clarify both the effects of the measured Ts and mineralization patterns on the N mineralization of organic fertilizers, the N mineralization for the fertilizers A to D from May 11 to June 30 at NARI were evaluated by the optimal model and compared between the 2 years at high (1998) and low (2010) temperatures.
3. Results
3.1. Estimation of soil temperature
The following six regression equations for estimating paddy Ts were developed by using the Tw in 8 years (n = 408), as calculated by the Tw-model developed by Kuwagata, Hamasaki, and Watanabe (Citation2008):
where Ts(d) is the estimated Ts of the target day, Tw(d) is the estimated Tw of the target day, and Tw(d-n) is the estimated Tw of n days before. EquationEq. (6)(6)
(6) gave the largest adjusted R2 among all equations.
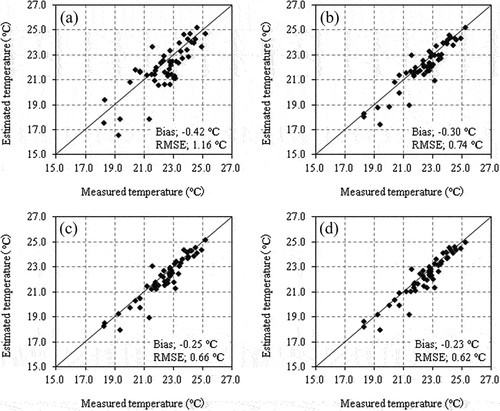
The relationship between the estimated and measured Ts at NARI in 2016 is presented in . The bias and RMSE of EquationEq. (4)(4)
(4) , (Equation5
(5)
(5) ), and (Equation6
(6)
(6) ) were smaller than those of EquationEq. (3)
(3)
(3) which is used only the Tw of the target day.
Figure 1. Comparison of measured and estimated soil temperature by regression of (A) EquationEquation (3)(3)
(3) , (B) EquationEquation (4)
(4)
(4) , (C) EquationEquation (5)
(5)
(5) , and (D) EquationEquation (6)
(6)
(6) in 2016 crop season.
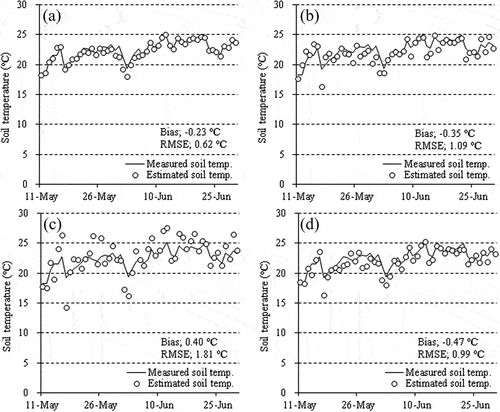
A comparison of the accuracy of EquationEq. (6)(6)
(6) and the three known methods (Takami model, Nishida model, and Moritsugu model) obtained using the measured meteorological data observed at NARI in 2016 is presented in . The accuracy of EquationEq. (6)
(6)
(6) is better than those of the three known models, and the bias and RMSE are as follows: EquationEq. (6)
(6)
(6) , −0.23°C, 0.62°C; Takami model, −0.35°C, 1.09°C; Nishida model, 0.40°C, 1.81°C; and Moritsugu model, −0.47°C, 0.99°C, respectively.
Figure 2. Comparison of measured and estimated soil temperature of (A) EquationEquation (6)(6)
(6) , (B) Takami model, (C) Nishida model, and (D) Moritsugu model.
The results of the comparison of the bias and RMSE between the estimated and measured Ts at five sites in Niigata prefecture () are shown in . The average bias and RMSE of the four equations were −0.19°C, 1.21°C for EquationEq. (3)(3)
(3) ; −0.07°C, 0.90°C for EquationEq. (4)
(4)
(4) ; −0.02°C, 0.88°C for EquationEq. (5)
(5)
(5) ; and 0.00°C, 0.86°C for EquationEq. (6
(6)
(6) ), respectively. The accuracy of EquationEq. (3)
(3)
(3) to EquationEq. (6)
(6)
(6) was better than that for the three known models for estimating Ts, except for the RMSE of EquationEq. (3)
(3)
(3) .
Table 4. Comparison of bias and RMSE between measured and estimated soil temperature at five test sites in Niigata pref. in 2016
3.2. Estimation of the N mineralization pattern of organic fertilizers
The mineralization characteristics of each fertilizer are shown in . shows the N mineralization pattern when the mineralization characteristic values were substituted into EquationEq. (1)(1)
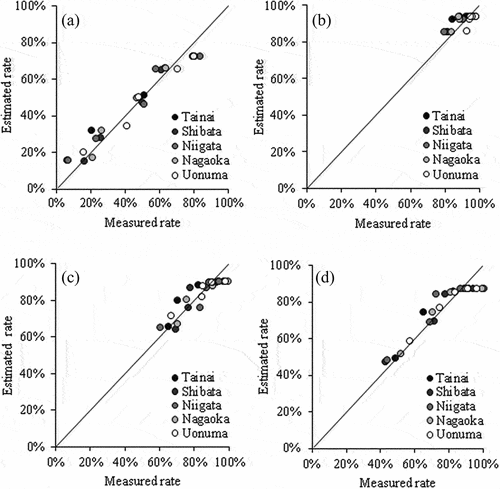
(1) with the measured amount of N mineralization in the incubation test. All of the fertilizers fit the simple type N mineralization estimation curve well, indicating the validity of the mineralization characteristic values of each fertilizer. The estimated amount of N mineralization using EquationEq. (6)
(6)
(6) and AMD generally agree with the measured values for all fertilizers, as shown in . It should be noted that some of the estimated values may be lower than the measured values in accordance with the increases of mineralization rate, but this is due to the characteristics of the simple model, as shown in .
Table 5. Mineralization characteristics of each fertilizer used in this study as shown by the calculated parameters
Figure 3. Measured and estimated rate of the nitrogen mineralization of fertilizer A (A), fertilizer B (B), fertilizer C (C), and fertilizer D (D) with a temperature index DTS (number of days transformed to standard temperature 25°C) under different incubation temperature 15, 20, and 25°C.
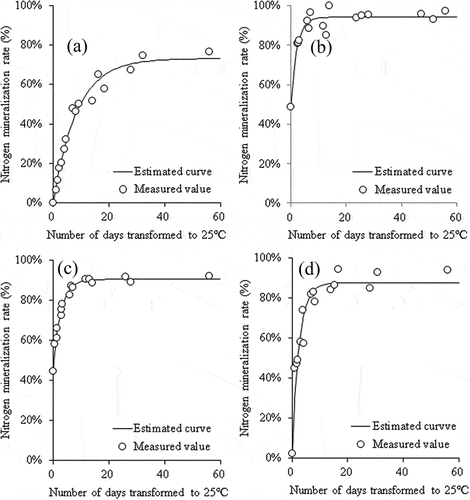
Figure 4. Measured and estimated rate of the nitrogen mineralization of fertilizer A (A), fertilizer B (B), fertilizer C (C), and fertilizer D (D) at five test sites including Tainai, Shibata, Niigata, Nagaoka, and Uonuma in Niigata prefecture in 2016.
The differences in the estimated N mineralization of organic fertilizers under different Ts conditions are shown in . The difference in Ts in the years with the high (1998) and low (2010) temperatures was largest during May, especially around May 14 and 28 with differences of 7.7°C and 7.5°C, respectively. The difference in the integrated amount of N mineralization with the organic fertilizer between the high and low Ts depended on the mineralization pattern of each fertilizer. The largest difference was observed for fertilizer D, with a difference of 19 points on May 15 (DTS = 2.8 day of high Ts and 1.5 days of low Ts, respectively), but the difference in the amount of N mineralization rapidly decreased thereafter. Fertilizer C also showed a difference of 10 points but then showed the same trend as fertilizer D. The difference for fertilizer B was only one point closer to that day (May 15). On the other hand, Fertilizer A, which contained 100% organic N, had a 10-point difference, but unlike the other three fertilizers, the effect of the difference in Ts on the integrated amount of N mineralization lasted until the end of May, and then converged gently.
Figure 5. Differences in integrated amount of mineralization of different type estimated in high and low temperature year at Nagaoka (NARI).
4. Discussion
4.1. Estimation of soil temperature
Several models have been proposed to estimate paddy Ts, however almost all of them use the meteorological data of the target day (Nishida et al. Citation2014; Moritsugu et al. Citation2016) or Tw estimated from the meteorological data of the target day (Takami, Sugaya, and Toriyama Citation1989) as explanatory variables. In paddy fields, the paddy water permeates into the lower layers with time so the estimation of paddy Ts under-waterlogged conditions requires to consider the heat advection downward due to water permeation in addition to the heat conduction in the soil (Nishida et al. Citation2017). Therefore, we developed EquationEq. (4(4)
(4) ) −EquationEq. (8)
(8)
(8) for estimating paddy Ts by adding past Tw (from the target day to 5 days before) as explanatory variables. As a result, the estimation accuracy of EquationEq. (4)
(4)
(4) to EquationEq. (8)
(8)
(8) was greatly improved compared to EquationEq. (3
(3)
(3) ), which uses only the Tw of the target day as an explanatory variable. EquationEq. (7)
(7)
(7) and EquationEq. (8
(8)
(8) ), however, were not appropriate as their coefficients of determination were lower than those of EquationEq. (6)
(6)
(6) which used Tw up to 3 days before. Especially on May 17, when a sudden drop in air temperature occurred (approximately 9°C lower than the previous day’s air temperature), the accuracy of the Ts estimation of EquationEq. (6)
(6)
(6) was much better than that of the other models, as it considered the water percolation and heat conduction from the paddy water (). The partial regression coefficients of EquationEq. (4)
(4)
(4) to EquationEq. (6)
(6)
(6) with past Tw as explanatory variables were higher in the following order: Tw of the target day > Tw of the previous day > Tw of 2 days before > Tw of 3 days before. It should be noted that the model developed in this study reflects the effects of water permeation and heat conduction from the paddy water via the multiple regression equation, considering the effect of Tw from the previous day to 3 days before, and does not treat the heat transfer of the physical model.
On the other hand, among the estimation accuracy of EquationEq. (3)(3)
(3) to EquationEq. (6)
(6)
(6) at the five sites in Niigata prefecture, EquationEq. (6
(6)
(6) ), which added Tw up to 3 days before to the explanatory variables, was the most accurate and EquationEq. (3)
(3)
(3) was the least accurate at Shibata, Niigata, and Nagaoka. In Tainai and Uonuma, however, EquationEq. (3
(3)
(3) ), which used the Tw of the target day only, had the lowest bias, and the bias increased as previous Tw was added as explanatory variables, though the RMSE decreased with adding previous Tw (). The difference in bias at these locations is thought to be due to differences in the permeability of the fields. In general, a water requirement of a depth of 2–4 cm day−1 is suitable for rice growth (Anzai Citation1998). In fields with high water permeability (e.g., water requirement in depth of 5 cm or more), heat transfer to the lower layers is faster due to the permeated water. Therefore, the effect of the Tw on the target day might be greater than that of the Tw of the previous day under high water permeability conditions. Takami, Sugaya, and Toriyama (Citation1989) reported that the coefficients of the equation for estimating Ts from Tw depend on the heat capacity and conductivity of the soil and soil type. They also mentioned that the estimation equation using Tw is hard to adapt to excessively percolable paddy fields. EquationEq. (3)
(3)
(3) to EquationEq. (6)
(6)
(6) were developed using data from a fine-grained gleyed lowland soil, based on the estimated Tw by the heat balance model (Kuwagata, Hamasaki, and Watanabe Citation2008), and the suitability of the equations developed would be restricted to different soil types. Thus, differences in permeability and soil type may affect the accuracy of the Ts estimation. Since the permeability of the field is not only determined by the soil type but also by the soil texture and compactness of the plow pan, and so on, the effect of permeability on Ts should be further investigated.
By comparing the estimated Ts by the newly developed methods with those by three other known methods at the five sites, the new methods using EquationEq.(3)(3)
(3) to EquationEq.(6)
(6)
(6) were all found to be more accurate than the three methods although there were some regional differences (). The average RMSE of estimated Ts from EquationEq. (4)
(4)
(4) to EquationEq. (6)
(6)
(6) at the five sites ranged from 0.86°C to 0.9°C, slightly higher than the RMSE of air temperatures of AMD (0.66°C), which is reasonable considering the process of estimating Tw and Ts from meteorological data. On the other hand, the Tw estimation model of Kuwagata, Hamasaki, and Watanabe (Citation2008) does not consider the permeability of the field, so the accuracy of the estimated Tw tends to be lower for excessively percolable paddy fields. Moreover, the accuracy of the AMD estimation is lower in some cases, owing to errors caused by differences in elevation and slope direction within the mesh area in mountainous areas, and errors caused by differences in land use in urban and suburban areas (Ohno 2016). In such cases, the accuracy of the estimation of Ts and fertilizer N mineralization patterns may become inaccurate. Therefore, regional characteristics and field conditions need to be considered in more detail to improve the accuracy of the estimation.
4.2. Estimation of the nitrogen mineralization pattern in organic fertilizers
Among the N mineralization patterns of organic matter generally classified as simple type, two-combined simple type, and simple type combined with immobilization (Sugihara, Konno, and Ishii Citation1986), the fertilizers tested in this study all showed a simple-type pattern. The results from five sites in Niigata prefecture showed that the method for estimating the N mineralization pattern of organic fertilizers using AMD is effective over a wide area.
The estimation of N mineralization patterns of various organic fertilizers, such as animal debris powders, plant by-products, plant oil cakes, dried fungi, and bone meal, has been reported previously, and shown that many fertilizers show simple or two-combined simple-type mineralization patterns (Osawa, Niizuma, and Morikuni Citation2001). However, few studies have estimated the mineralization patterns of mixed organic fertilizers and organic-containing compound fertilizers such as those tested in this study (). Moritsugu et al. (Citation2015) conducted incubation tests using mixed compost compound fertilizers and reported that the mineralization patterns were generally consistent with the combination of the N mineralization patterns estimated from the raw materials. Therefore, it would be effective to estimate the mineralization pattern of fertilizers mixed with organic materials without incubation tests if the mineralization patterns of the raw materials are known.
The effect of Ts on the N mineralization patterns of the four fertilizers differed depending on the N mineralization characteristics of each fertilizer. In particular, the difference in the amount of N mineralization was most pronounced around May 15, when the difference in Ts was remarkable between the high Ts year (1998) and the low Ts year (2010) (). The DTS of the high Ts year and low Ts year at May 15 for each fertilizer is as follows: 2.9 and 1.6 d for fertilizer A, 4.6 and 4.2 d for fertilizer B, 2.3 and 1.1 d for fertilizer C, and 2.8 and 1.5 d for fertilizer D, respectively. Fertilizer B had the lowest Ea value (temperature dependence of N mineralization rate) and the highest k value (N mineralization rate), suggesting that N mineralization proceeded rapidly soon after fertilizer application and that it was least affected by Ts. On the other hand, the difference in N mineralization with fertilizer D was large when the difference in Ts was the largest (around May 15). This was partly due to its high decomposable N content (parameter A in ) and high N mineralization rate, and was probably because the peak of N mineralization coincided with the DTS at 2.8 and 1.5 d, respectively, which was around May 15. Although fertilizer C had the highest Ea value, its effect was smaller than that of fertilizer D, because it contained less decomposable N than fertilizer D. Fertilizer A had a high decomposable N content but a lowest N mineralization rate, and the difference in the N mineralization rate continued until the end of May. The N mineralization patterns of fertilizers A and D differed greatly, although the organic N content was not significantly different, at 100% and 93%, respectively (). Thus, when using slow-release N fertilizers including organic fertilizers, it should be possible to select and apply the best fertilizer by paying attention to the N mineralization characteristics of the fertilizer and simulating the N mineralization pattern based on the estimated Ts using AMD.
5. Summary
(1) An accurate model for estimating paddy soil temperature (Ts) in the early growth stage was recently developed for evaluating the mineralization patterns of organic fertilizers in rice paddy. By considering the effect of water percolation and heat conduction from paddy water under the condition of leaf area index (LAI) = 0, Ts is expressed as a linear function of a time series for daily mean paddy water temperature (Tw) for up to 3 days prior.
(2) The calculation of Tw was done using the heat balance model (Kuwagata, Hamasaki, and Watanabe Citation2008) with four meteorological factors (daily mean air temperature, solar radiation, relative humidity, and wind speed) and the meteorological data was derived from the Agro-Meteorological Grid Square Data (AMD) in Japan. The accuracy of the present model for Ts is higher than those of the existing three simple models.
(3) Nitrogen (N) mineralization patterns of organic fertilizers can be estimated over a wide area by using estimated Ts based on AMD and the N mineralization characteristics of each organic fertilizer. Ts had a significant effect on the N mineralization patterns of organic fertilizers, as the results of simulations under different Ts conditions. It is a useful tool for improved rice crop management.
Acknowledgments
This study was carried out in collaboration with Niigata Agricultural Research Institute (NARI) and Institute for Agro-Environmental Sciences, NARO in the project ‘Elucidation of factors causing fluctuations in growth and quality of paddy rice plants using agricultural meteorological databases and development of a growth diagnosis and prediction system’ (2011–2013), the agricultural and food project ‘Development of an early warning and cultivation support system for high-temperature injury to rice plants (26072C)’(2014–2016),and the Project of the NARO Bio-oriented Technology Research Advancement Institution (Research program on development of innovative technology, 02014B). The authors are grateful to Hiroyuki Ohno for the technical help of AMD, Kazunobu Toriyama for helpful suggestions.
Disclosure statement
No potential conflict of interest was reported by the author(s).
Additional information
Funding
References
- Anzai, T. 1998. “Water requirement rate.“ In New Dictionary of Soil Fertilizer Terms, edited by Fujiwara, S., Anzai, T., Ogawa, Y., and Katou, T. 68. Tokyo: Rural Culture Association Press (in Japanese)
- Hioki, M., H. Kitamura, and T. Katou. 2001. “Nutritional Characteristics of Animal Manure Compost and Estimation of Amount of Nitrogen Mineralization in Paddy Soil Condition.” Japanese Journal of Soil Science and Plant Nutrition. 72. 684–688. (in Japanese).
- Inoue, K. 1985. “A Simulation Model for Micrometeorological Environment in Rice Field.” Journal of Agricultural Meteorology 40 (4): 353–360. in Japanese with English summary. doi:10.2480/agrmet.40.353.
- Ishibashi, E., T. Konno, and H. Kimoto. 1992. “Estimation of the Nitrogen Liquation of Coated Ureas by Kinetic Method.” Japanese Journal of Soil Science and Plant Nutrition. 63. 664–668. in Japanese with English abstract.
- Kato, M., H. Isshiki, T. Motobayashi, and S. Matsumura. 2001. “Growth and Yield of Paddy Rice in Relation to Organic Materials with Different Mineralization Patterns.” Abstracts of the Annual Meetings, Japanese Society of Soil Science and Plant Nutrition. 47. 321(in. Japanese).
- Kuwagata, T., T. Hamasaki, and T. Watanabe. 2008. “Modeling Water Temperature in a Rice Paddy for Agro-environmental Research.” Agricultural and Forest Meteorology 148 (11): 1754–1766. doi:10.1016/j.agrformet.2008.06.011.
- Kuwagata, T., M. Yoshimoto, Y. Ishigooka, T. Hasegawa, M. Utsumi, M. Nishmori, Y. Masaki, and O. Saito. 2011. “MeteoCrop DB: An Agro-meteorological Database Coupled with Crop Models for Studying Climate Change Impacts on Rice in Japan.” Journal of Agricultural Meteorology 67 (4): 297–306. doi:10.2480/agrmet.67.4.9.
- Moritsugu, S., E. Ishibashi, and R. Oya. 2009. “A Method of Selecting Sigmoid Releasing-types of Coated Urea Fertilizer that Considers the Sensitivity to Temperature of Rice Plant.” Japanese Journal of Soil Science and Plant Nutrition. 80. 49–53. in Japanese.
- Moritsugu, S., E. Ishibashi, S. Yamamoto, and K. Oki. 2016. “Accuracy of Estimated Amount of Nitrogen Release from Coated Urea by AMeDAS Mesh Data in Paddy Rice Culture.” Japanese Journal of Soil Science and Plant Nutrition. 87. 93–100. in Japanese with English abstract.
- Moritsugu, S., T. Washio, G. Mizuki, R. Oya, H. Fujiwara, and K. Takano. 2015. “Nitrogen Mineralization Characteristics of Mixed Compost Compound Fertilizers and Predictive Accuracy of Mineralization Based on Mixture Materials.” Abstracts of the Annual Meetings, Japanese Society of Soil Science and Plant Nutrition. 61. 139. in Japanese.
- Nishida, K., M. Mitsuyasu, S. Yoshida, and S. Shiozawa. 2017. “Relationship between Water Depth and Water and Soil Temperature in a Paddy Field during Rice Ripening Period.” Journal of Japanese Irrigation, Drainage and Rural Engineering. 305. 253–263. in Japanese with English abstract.
- Nishida, M., K. Yoshida, K. Tsuchiya, T. Takahashi, and S. Nakayama. 2014. “Accuracy Improvement of Nitrogen Release Simulation for Controlled Release Fertilizer Using Air Temperature.” Tohoku Agricultural Research. 67. 1–2. (in Japanese).
- Obara, H., T. Okura, Y. Takata, K. Kohyama, Y. Maejima, and T. Hamazaki. 2011. “Comprehensive Soil Classification System of Japan First Approximation.” Bulletin of the National Institute of Agro-Environmental Sciences. 29. 1–73. in Japanese with English summary.
- Ohno, H. 2014. “User’s Manual of the Agro-Meteorological Grid Square Data, NARO/ARC.” Miscellaneous Publication of the National Agricultural Research Center. 9. 1–77. (in Japanese).
- Ohno, H., K. Sasaki, G. Ohara, and K. Nakazono. 2016. “Development of Grid Square Air Temperature and Precipitation Data Compiled from Observed, Forecasted, and Climatic Normal Data.” Climate in Biosphere 16: 71–79. in Japanese with English abstract. doi:10.2480/cib.J-16-028.
- Osawa, M., S. Niizuma, and H. Morikuni. 2001. “Kinetic Analysis of Nitrogen Mineralization Characteristics of Organic Fertilizers: 2. Nitrogen Mineralization under Water Logged Condition.” Abstracts of the Annual Meetings, Japanese Society of Soil Science and Plant Nutrition. 47. 171. in Japanese.
- Seino, H. 1993. “An Estimation of Distribution of Meteorological Elements Using GIS and AMeDAS Data.” Journal of Agricultural Meteorology 48 (4): 379–383. in Japanese. doi:10.2480/agrmet.48.379.
- Sugihara, S., T. Konno, and K. Ishii. 1986. “Kinetics of Mineralization of Organic Nitrogen in Soil.” Bulletin of the National Institute of Agro-Environmental Sciences. 1. 127–166. in Japanese with English summary.
- Takahashi, S., and S. Yamamuro. 1992. “Relationship between Mineralization of Soil Organic Nitrogen and Soil Temperature under Submerged Soil Conditions.” Japanese Journal of Soil Science and Plant Nutrition. 63. 463–465. (in Japanese).
- Takami, S., H. Sugaya, and K. Toriyama. 1989. “A Simple Model for Water and Soil Temperature Estimate of an Irrigated Rice Field.” Journal of Agricultural Meteorology 45 (1): 43–47. (in Japanese). doi:10.2480/agrmet.45.43.
- Yuasa, K., T. Iwata, Aoki, K. 1986. “Effects of Embedding Side Row Application of Basal Dressing on Growth of Top and Root of Rice Plants.” Hokuriku Crop Science. 21. 65–67. (in Japanese).