
 ?Mathematical formulae have been encoded as MathML and are displayed in this HTML version using MathJax in order to improve their display. Uncheck the box to turn MathJax off. This feature requires Javascript. Click on a formula to zoom.
ABSTRACT
Enclosure is an effective strategy for enhancing soil carbon sequestration in the desert steppe. Soil organic carbon (SOC) and its stock during changes in the plant community influence soil fertility and the global carbon cycle. We studied changes in SOC and its stock along with six plant community types in the desert steppe of Inner Mongolia, northern China. The goal of this study was to explore differences in SOC and its stock among plant communities while accounting for the effects of environmental factors. We collected 336 soil samples at four soil depths (0–5 cm, 5–10 cm, 10–20 cm, and 20–30 cm) and vegetation attributes from 84 plots in the enclosure. The results revealed that plant community type and soil depth were the most influential factors for root biomass, SOC, and SOC stock. Total root biomass varied from 229.21 to 731.71 g·m−2 and was ranked as follows: Koeleria cristata > Leymus chinensis > Stipa krylovii >Allium mongolicum >Stipa breviflora > Convolvulus ammannii. Mean SOC and its stock of soils associated with K. cristata were 1.94 and 1.62 times higher than that measured for C. ammannii soils, respectively. Root biomass, SOC, and its stock gradually decreased with soil depth. Stratification ratios (SRs) of SOC increased with soil depth for different plant communities and showed better soil quality (except C. ammannii and A. mongolicum). Results from redundancy analysis (RDA) showed that root biomass, clay, coverage, and litter biomass had significant impacts on SOC and SOC stock. We conclude that the plant community had the greatest effect on improving SOC stock after enclosure, and plant root biomass contributed the most to SOC stock.
1. Introduction
Soils account for the largest carbon reservoir of the terrestrial ecosystem and are key components of the hydrosphere, atmosphere, lithosphere, and biosphere. Soil organic carbon stock (SOC stock) can act as a major source or sink in the carbon cycle (Chirinda et al. Citation2014). Estimates of surface SOC stock range from 1400 to 1500 Pg at the 1-m depth (Post et al. Citation1982), suggesting that SOC stock exceeds vegetation and atmospheric stock by a factor of 2 to 3 (Batjes Citation1996). Given the stock capacity, minor changes in soil organic carbon (SOC) may have a significant impact on the global carbon cycle and climate (Lal Citation2004). Nevertheless, differences between studies and regions occur due to differences in climate, soil properties and soil depth, landscape location, plant community composition, and management approaches (Feyisa et al. Citation2017; Mcsherry and Ritchie Citation2013; Zhao et al. Citation2017; Zhang et al. Citation2018; Li et al. Citation2017). Hence, accurately analyzing and assessing spatial SOC distributions and main influencing factors is an important step in evaluating the potential for soil carbon sequestration.
SOC, composed of humus, plant and animal residues, and soil microbial biomass (Murugan, Koch, and Joergensen Citation2014), is an efficient indicator of soil quality and ecological restoration. The accumulation of SOC in topsoil is especially important for carbon sequestration and improving soil quality. Because SOC has a significant influence in stabilizing the soil structure, increasing nutrient input can affect soil resistance to erosion (Lal Citation2004). Soil depth is an effective variable in the spatial SOC distribution because of the differences in the rates of input of litter and organic matter decomposition (Zhu et al. Citation2017). It is necessary to establish the relationship between soil properties and soil depths. Therefore, the stratification ratio (SR) was introduced by Franzluebbers (Citation2002). The SR, defined as the ratio of the SOC at the surface to that at depth, is an important indicator of SOC sequestration and soil quality. The index is not affected by soil types or climate conditions (Díaz-Zorita and Grove Citation2002). Values for SR > 2 indicate good soil quality (Franzluebbers Citation2002), and values >1.2 may mean that soil quality is improving (Wang et al. Citation2010). This metric is widely used to evaluate soil conditions of farmland and areas subjected to managed restoration (Figueiredo et al. Citation2013; Deng et al. Citation2016; Xu, Wang, and Zhao Citation2018). However, relatively little research has been done on grasslands.
Grasslands, as one of the three major terrestrial ecosystems, store about 80% of their ecosystem carbon (Cesarz et al. Citation2015). Grasslands cover about 4.0 × 10⁸ hm2 and account for more than 40% of the total area of China (Ding et al. Citation2016). However, more than 90% of China’s natural grassland has been degraded, with 20% of this caused by overgrazing. Overgrazing influences SOC and the decomposition of soil organic matter by modifying the magnitude of net primary productivity in soil and photosynthetic products in roots and shoots (Manaye, Negash, and Alebachew Citation2019). Grassland degradation leads to biodiversity loss, reductions in plant cover and biomass, soil structure deterioration, and losses of soil carbon (Feyisa et al. Citation2017). These changes have vital impacts on carbon stocks and ecosystem carbon cycles.
Enclosure measures have been implemented to improve the degraded grasslands (Fang et al. Citation2010; Ren et al. Citation2018), and this could help to restore grassland ecosystems through increased biomass via accumulation of plant litter on the ground surface and improvement of carbon sequestration of degraded grasslands (Hu et al. Citation2016; Wu et al. Citation2009; Xiong et al. Citation2019; Zhao et al. Citation2005; Wang, Fan, and Li Citation2019). Sustainable enclosure management of grasslands can improve soil carbon stocks. Ren et al. (Citation2018) reported that vegetation patterns are closely related to changes in soil characteristics and other environmental factors, including climatic and geomorphological conditions as well as geographical location. In addition, species differences will result in differences in the spatial distribution of roots (Ren et al. Citation2018). Hence, the variation of soil characteristics is closely related to the vegetation pattern.
In this study, we analyzed SOC at a 0–30 cm soil depth in different plant communities of Inner Mongolia. The results of this study will contribute to understanding the dynamics of SOC in the region and will improve current estimates of SOC stock. Therefore, we (1) estimated root biomass and explore root spatial patterns for different plant communities following enclosure, (2) explored SOC and SOC stock of different plant communities following enclosure, and (3) identified the relationships among SOC and SOC stock and vegetation-soil systems.
2. Materials and methods
2.1. Study area and vegetation types
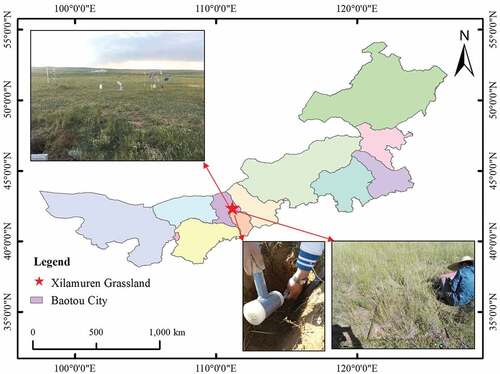
The study area (110°00’-110°20’E, 41°12’-41°31’N) is located within the desert steppe of northern Yinshan Mountain, Inner Mongolia (). The 1.33 km2 study area has been protected (enclosed) for 14 years. The area has a semi-arid continental monsoon climate, with an altitude of about 1640 m. The mean annual precipitation at the site is approximately 281 mm, 55% of which occurs from July to September. The annual average temperature is 2.5°C, and monthly mean temperature ranges from −12°C in January to 20°C in July. Sandstorms may occur in spring and winter and generally involve north and northwest winds, with an average annual wind speed of about 5.2 m/s. The soil type is Arenosols, with soil depth ranging from 60 to 80 cm. The plant structure type is simple and mostly consists of xerophytes and middle xerophytes. The dominant species of wild vegetation is Stipa krylovii, and common herbaceous species are Allium mongolicum, Convolvulus ammannii, Leymus chinensis, Koeleria cristata, and Stipa breviflora.
Figure 1. PNG.
2.2. Experimental design and methods
The 1.33 km2 study area of the Xilamuren grassland was enclosed in 2002 and has been protected (enclosed) for 14 years. Before the enclosure of the study sites, all plots were grazing areas historically and had the same initial conditions. The initial characteristics of the soil and vegetation in experimental sites are listed in .
Table 1. The steppe soil condition before enclosure
Data was collected from an enclosed area of the Xilamuren grassland in mid-August 2016. In the enclosed area, eleven 300-m-long sample lines were laid out in parallel (separated by 50 m) in an east–west direction. According to the changes of plant dominant species, we set seven to eight 1 m × 1 m standardized quadrats on each sample line. Fourteen replicates were set for each plant community type simultaneously for a total of 84 1 m × 1 m quadrats. In each quadrat, we investigated plant species and recorded average height and coverage. Subsequently, aboveground biomass per quadrat was cut by the harvest method involving the clipping of plants at ground level, and then the litter in the sample was collected and kept in sample bags for transport back to the laboratory ().
Table 2. Basic parameters for sample sites hosting different vegetation types
After harvesting the aboveground biomass, we then divided the sample site into four sub-square soil plots. Fine roots were collected with a steel root drill (10 cm diameter) to collect 30 cm soil layers and then gotten by washing the soil sample from the center of the sample site and four sub-square plots. We sampled the soil to 30 cm depth and then divided each soil core into 0–5, 5–10, 10–20, and 20–30 cm soil layers. Fine roots from the same soil layer were pooled to obtain the total fine root mass in each soil layer of each quadrat (Zhang et al. Citation2018). The fine roots were packed in a nylon mesh bag and transported to the laboratory. The fine roots were rinsed with distilled water in a 0.15 mm sieve. During the rinsing process, living roots were separated from dead root material and other detritus based on color and texture. Root samples were dried with absorbent paper. To determine the dry mass, the aboveground biomass, litter, and root samples were immediately oven-dried to constant weight at 60°C. Aboveground and litter biomass from the same sample plot were counted together as dry matter mass.
Soils and soil samples for bulk density of different depths (0–5, 5–10, 10–20, and 20–30 cm) were sampled from positions directly adjacent to those used for root biomass determination and were taken using a bucket auger with a diameter of 3.5 cm and stainless steel cylinders, respectively. After labeling, soil samples for bulk density and soil water content were transported to the laboratory and oven-dried to constant weight at 105°C. Soils were air-dried and stored in a dark place. After removal of impurities such as root material, soils were processed using a 2 mm mesh sieve. After grinding with a ball mill, SOC was measured using a potassium dichromate volumetric method with external heating. Some samples were subjected to mechanical composition determination. Soil particle size distributions (clay: <0.002 mm, silt: 0.002–0.05 mm and sand: 0.05–2 mm) were measured using a Malvern Mastersizer 3000. SOC was determined using a potassium dichromate oxidation-concentrated sulfuric acid external heating method (Batjes and Dijkshoorn Citation1999).
2.3. Data analysis
The formula for calculating the rate of change of soil organic carbon (SOC) by the time since enclosure for each soil profile at 0–5, 5–10, 10–20, and 20–30 cm depth intervals was as follows (Yang, Luo, and Finzi Citation2011):
where ΔX (g·kg-1) represents the change in SOC since enclosure, and Δt (year) represents the time of enclosure.
The formula for calculating soil organic carbon stock (SOC stock) for each soil profile at 0–5, 5–10, 10–20, and 20–30 cm depth intervals was as follows (Jiao et al. Citation2020)
where SOC stocki (kg·m−2) is the SOC stock for soil layer i; Ci (g·kg−1) is the SOC for soil layer i; Di (cm) is soil bulk density for soil layer i; Hi (cm) is the soil depth soil layer i; and Gi is the volume percent (%) of gravel (diameter >2 mm) in soil layer i. Because gravel content was 0, Gi was ignored in the present study.
Total SOC stock (kg·m−2) represented the sum of SOC stock for 0–10, 0–20, and 0–30 cm soil samples. The formula for calculating the total SOC stock (kg·m−2) for a given soil depth is (Falloon et al. Citation1998):
The stratification ratio (SR) for a given soil property is the ratio of its value at the soil surface to that at a lower depth. Following Fernandez-Romero, Lozano-Garcia, and Parras-Alcantara (Citation2014), SR is calculated as follows:
where SOC1 (g·kg−1) is SOC for the 0–5 cm soil layer, and SOCi is SOC for soil layer i = 5–10, 10–20, and 20–30 cm depth.
We used one-way analysis of variance (ANOVA) to compare root biomass and soil carbon characteristics in different plant communities. We used two-way ANOVA to compare the effects of plant community, soil depths, and their interactions on root biomass and soil properties. All of the analyses were carried out with SPSS 22.0 (IBM Corp., Armonk, NY, USA). Redundancy analysis (RDA) of the relationship between environmental factors and SOC and its stock was performed using Canoco 5.0 software. Figures were constructed in Origin 2017 (OriginLab Corporation, Northampton, MA, USA). Data were reported as mean values ± standard deviation.
3. Results
3.1. Variation of root biomass and soil properties with plant community and soil depth
A two-way ANOVA demonstrated that differences in the plant community, soil depth, and their interactions had significant effects on root biomass, rate of SOC change, SOC, and SOC stock.
3.2. Root distributions and spatial configuration of different plant communities
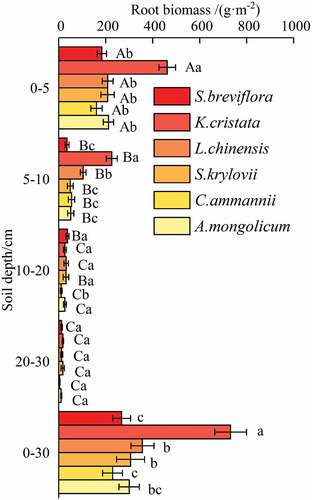
The enclosure led to a significant increase in the root biomass in each soil depth ( and ). The total biomass varied in the 0–30 cm soil depth among plant communities, and there were significant differences in root biomass because of vegetation type (). At soil depths of 0–5 cm and 5–10 cm, the root biomass of K. cristata was significantly higher than that of other plant communities (p > 0.05). The root biomass of K. cristata was higher than that of S. breviflora, L. chinensis, S. krylovii, C. ammannii, and A. mongolicum by factors of 2.52, 2.22, 2.22, 2.88, and 2.18, respectively, at 0–5 cm depth (p < 0.05). However, the differences among L. chinensis, S. krylovii, A. mongolicum, S. Breviflora, and C. ammannii were not statistically significant (p > 0.05). The root biomass of K. cristata was higher than those of S. breviflora, L. chinensis, S. krylovii, C. ammannii, and A. mongolicum by factors of 6.40, 2.17, 4.57, 4.13, and 4.41, respectively, at 5–10 cm depth (p < 0.05). However, root biomass among S. breviflora, S. krylovii, C. ammannii, and A. mongolicum did not differ significantly. At 10–20 cm soil depth, the root biomass of C. ammannii was significantly lower than that of other plant communities (p < 0.05). Root biomass did not differ among different plant communities at 20–30 cm soil depth (p > 0.05). The root biomass of plant communities showed large spatial variation and decreased gradually with increasing soil depth. Our study showed that the root biomass at 0–5 cm soil depth accounted for 58.41–70.70% of the total root biomass at 0–-30 cm soil depth under different plant communities.
Figure 2. Root biomass for different plant communities.
3.3. Soil SOC associated with different plant communities
The enclosure led to a significant increase in the SOC in each soil depth ( and ). The SOC varied widely among six plant communities, with mean SOC ranging from 6.07 to 11.75 g·kg−1. The SOCs showed large spatial variation and increased gradually with increasing soil depth ()), and SOC at each soil depth varied from 7.46 to 12.68 (0–5 cm), 5.74 to 14.26 (5–10 cm), 5.26 to 10.20 (10–20 cm), and 5.23 to 8.86 (20–30 cm), respectively. The SOC of K. cristata and L. chinensis were higher than that of other plant communities (p < 0.05) measured at the 0–5 cm soil depth. At the soil depth of 5–10 cm, the SOC values of K. cristata were 1.95, 1.77, 1.96, 2.48, and 2.32 times higher than those of S. breviflora, L. chinensis, S. krylovii, C. ammannii, and A. mongolicum, respectively (p < 0.05). At depths of 10–20 cm and 20–30 cm, compared with K. cristata, the SOC was significantly decreased by 30.19% to 94.41% and 19.52% to 95.71%, respectively (p < 0.05).
Figure 3. soil organic carbon (SOC) for different plant communities.
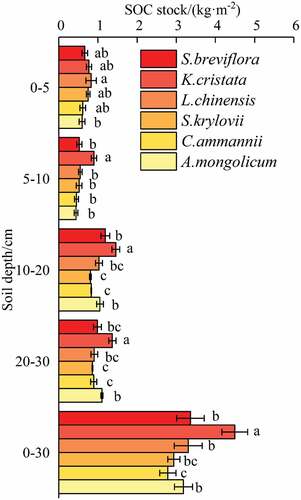
Figure 4. Soil organic carbon stock (SOC stock) values for soils associated with different plant communities.
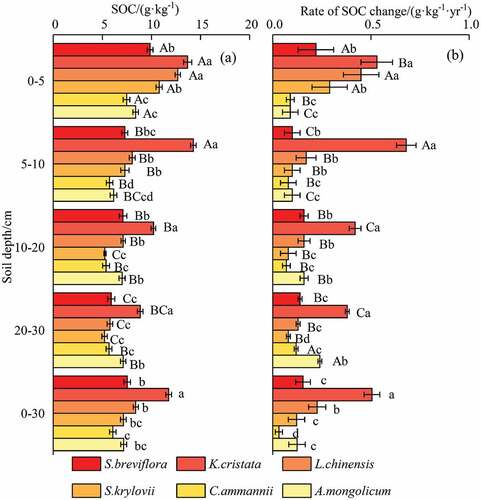
This study found that different plant communities exerted different influences on the rate of change of SOC at each soil depth ()). At a soil depth of 0–5 cm, K. cristata and L. chinensis had significantly higher rates of change of SOC compared with S. breviflora, S. krylovii, C. ammannii, and A. mongolicum. At soil depths of 5–10 cm, the rate of change of SOC in K. cristata was significantly higher than in other plant communities, although the difference between S. breviflora, L. chinensis and S. krylovii was not significant. At soil depth of 10–20 cm, the rate of change of SOC was in the following order: K. cristata > L. chinensis > S. breviflora > S. krylovii > A. mongolicum > C. ammannii, although S. breviflora, L. chinensis, and A. mongolicum were not significantly different. At soil depth of 20–30 cm, the rate of change of SOC was in the following order: K. cristata > A. mongolicum > S. breviflora> L. chinensis > C. ammannii > S. krylovii, although the difference between S. breviflora, L. chinensis, and C. ammannii was not significant. This result indicated that rate of change of SOC was less than 1.00 g·kg−1·yr−1, except for K. cristata ()).
3.4. SOC stock variation in soils associated with different plant communities
The total SOC stock of different plant communities (0–30 cm) varied from 2.78 to 4.49 kg·m−2, and the sequence remained K. cristata > S. breviflora > L. chinensis > A. mongolicum > S. krylovii > C. ammannii. The SOC stock showed large spatial variation and increased with increasing soil depth down to 30 cm. At a soil depth of 0–5 cm, the SOC stock of L. chinensis was 1.24, 1.07, 1.10, 1.35, and 1.39 times higher than those of S. breviflora, K. cristata, S. krylovii, C. ammannii, and A. mongolicum, respectively (p < 0.05). At the soil depth of 5–10 cm, the differences among S. breviflora, L. chinensis, S. krylovii, C. ammannii, and A. mongolicum were not statistically significant (p > 0.05). At depths of 10–20 cm and 20–30 cm, compared with K. cristata, the SOC was significantly decreased by 18.49% to 44.40% and 19.47% to 33.86%, respectively (p < 0.05).
The enclosure led to a significant increase in total SOC stock at each soil depth (), indicating that it was conducive to the increase of SOC stock. The total SOC stock at each soil depth varied from 1.03 to 1.67 (0–10 cm), 1.89 to 3.12 (0–20 cm), and 2.78 to 4.49 kg·m−2 (0–30 cm), and total SOC stock of K. cristata yielded the highest values (). At a soil depth of 0–10 cm, the total SOC stock of K. cristata was 1.31, 1.50, 1.65, and 1.49 times higher than those of S. breviflor, S. krylovii, C. ammanni, and A. mongolicum, respectively (p < 0.05). At soil depths of 0–20 cm and 0–30 cm, except for K. cristata, the differences among other plant communities were not statistically significant (p > 0.05).
Table 3. Two-way ANOVAs of the effects of plant community, soil depths and their interactions on root biomass and soil properties
Table 4. Total SOC stock measured over different soil intervals for each plant community
3.5. Stratification ratio of SOC in soils associated with different plant communities
The SR of SOC at each soil depth varied from 0.95 to 1.56 (5–10 cm), 1.33 to 2.00 (10–20 cm), and 1.06 to 2.20 kg·m−2 (20–30 cm). There was a difference between the plant communities concerning SR of SOC. The SR of SOC in S. breviflora, K. cristata, L. chinensis, and S. krylovii increased, and the SR of SOC in C. ammannii and A. mongolicum increased initially and then decreased with the increase of soil depth. The mean values of SR1, SR2, and SR3 of six plant communities were 1.34, 1.56, and 1.61, respectively. Compared with before enclosure, the respective values increased by 7.67%, 6.14%, and 6.78%. This indicated that enclosure was conducive to an increase in SR of SOC. Simultaneously, various plant communities at each soil depth showed relatively clear stratification characteristics. For SR1, L. chinensis was not significantly different from S. krylovii but was significantly different from S. breviflora, K. cristata, C. ammannii, and A. mongolicum. For SR2, S. breviflora, K. cristata, C. ammannii, and A. mongolicum showed no significant differences. For SR3, all plant types showed significant differences ().
Table 5. Stratification ratio (SR) of SOC values for different plant communities
3.6. Factors affecting SOC associated with different plant communities
The RDA indicated that SOC and the rate of change of SOC were significantly positively correlated with root biomass, clay, cover, and litter biomass. SOC stock was significantly positively correlated with litter biomass, aboveground biomass, cover, clay, and bulk density ()
Figure 5. RDA ordination diagram on the relationship between environmental factors and SOC, SOC stock.
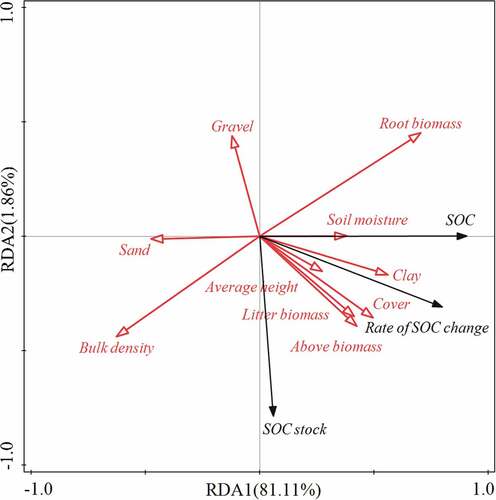
The order of importance of environmental factors to SOC and SOC stock was as follows: root biomass > clay content > cover > litter biomass > average height > aboveground biomass > sand content > gravel content > bulk density > soil moisture. Among these, root biomass, clay content, cover, and litter biomass were the main factors affecting SOC. Their contribution rates were 49.50%, 26.10%, 8.30%, and 7.30%, respectively. Thus, root biomass was the most important influence factor ().
Table 6. Significance order and significant-level test of environmental variables
4. Discussion
4.1. Changes in root biomass of different plant communities as a result of enclosure
Roots, as the link between plants and soil, determine the size range of the interaction between plants and the soil environment (Wang, Shao, and Liu Citation2013). Total root biomass from this study ranged from 229.21 to 731.71 g·m−2 with an average value of 365.09 g·m−2. This value exceeded values reported in studies by Ma et al. (Citation2008) (301.0 g·m−2). This study demonstrated that enclosure improved vegetation root biomass. Several mechanisms could explain the improvement in root biomass observed after enclosure. First, the enclosure may improve soil structure by reducing sheep hoof pressure. The decrease in bulk density and increases in macropores in combination with low hoof pressure would lead to loosened topsoil (Kolbl et al. Citation2011). Second, improvement of the soil structure had positive long-term effects on soil water content, root biomass, and the SOC; enclosure promoted a significant increase in vegetation coverage, plant height, and biomass of plant communities () and consequently increased the input of litter and SOC stock and thus grassland productivity (An, Gao, and Liu Citation2019; Zhao et al. Citation2007). Third, the enclosure also increased plant leaf area, carbon sequestration capacity, and photosynthetic transport capacity, thereby increasing plant root biomass (Gang, Zhang, and Li Citation2011). However, total root biomass values were not reported in studies by Ren et al. (Citation2018) or Wang et al. (Citation2017). This may have been due to differences in root sampling and processing methods, and overall estimates of root biomass also may have varied between this study and others. Our results also showed that different plant communities displayed differences in the depth distribution of roots. The reason for this pattern is related to these species having root depth distributions that are functions of plant physiology rather than local environmental factors, such as soil properties (Bardgett, Mommer, and De Vries Citation2014).
4.2. Changes in SOC and rate of SOC change of different plant communities as a result of enclosure
SOC in this study was significantly increased by 41.05% as a result of the enclosure. This is strong evidence that enclosure is an effective way to increase soil organic carbon fixation for desert grasslands in China (Zhang, Su, and Yang Citation2019). The differences in nutrient content, uptake efficiency, and root exudates among plant community types result in differences in SOC (Wu et al. Citation2010; Eisenhauer et al. Citation2017). In this study, the SOC in graminoids was higher than that in forbs; the root systems of forbs are usually shallower than those of graminoids, and this will limit their biomass production and thus reduce SOC accumulation (Li, Huang, and Zhang Citation2020). Our study found that SOC varied widely among six plant communities and decreased gradually with increasing soil depth, consistent with many other studies in grasslands (Fan et al. Citation2018; Hu et al. Citation2016). The increase in SOC in this study was mainly attributed to root biomass (), and root biomass contributed more to soil carbon sequestration (Li, Huang, and Zhang Citation2020). Consequently, the trend for changes in SOC of different plant communities was similar to that of root biomass. In addition, SOC accumulation was related to clay content, cover, and litter biomass (). The increasing fine-grained material favored the formation of soil agglomerated structures and improved soil water content and soil nutrient content (Feyisa et al. Citation2017). The increasing vegetation coverage and litter biomass can effectively reduce the wind speed and increase fine-grained materials at the surface, thereby enabling nutrients to easily adhere to the soil surface. Our study also found that for C. ammannii the variability in the rate of change of SOC was slower than the rate before enclosure ()), indicating that enclosed grassland cover showed patchiness because of the process of grassland succession, thus leading to sparse vegetation. C. ammannii can be used as an indicator for monitoring grassland degradation (Wang et al. Citation2017). The presence of C. ammannii increases carbon losses from wind erosion due to areas with little or no surface vegetation.
The magnitude and direction of the rate of change of SOC were influenced by various factors including climate, soil type, plant type, and nutrient management (Li, Niu, and Luo Citation2012; Hu et al. Citation2016). The rate of change of SOC in this study differed among plant communities, with the mean rate of change of SOC varying from 0.13 to 2.02 g·kg−1·yr−1 in the upper 0–30 cm of the soil horizon. These results were in line with those of Li, Niu, and Luo (Citation2012). In addition, the RDA in this study found that the rate of change of SOC was significantly and positively correlated with SOC, root biomass, cover, aboveground litter, and litter biomass. This was attributed to the enclosure, as it accelerated inputs of organic matter in the soil such as dead roots, litter, mycorrhizae, and exudates, and thus greater SOC accumulation (Han et al. Citation2008; Li, Okin, and Epstein Citation2009). In this study, except for A. mongolicum, the rate of change of SOC in other vegetation communities generally decreased with increasing soil depth; this was attributed to SOC accumulating more rapidly in the topsoil than in the subsoil because of the decomposition of leaves and roots in the topsoil (Jiao et al. Citation2020). Therefore, we conclude that the rate of change of SOC differs depending on SOC.
4.3. Changes in SOC stock of different plant communities as a result of enclosure
SOC stock can improve soil structure, plant productivity, and environmental quality (Banger et al. Citation2009). Mean SOC stock in this study significantly increased by 21.75% in subsoil (0–30 cm) since enclosure in 2002. Therefore, enclosure would be a promising practice for enhancing carbon sequestration, especially in arid and semi-arid grasslands of China (Feyisa et al. Citation2017). Furthermore, for the upper 0–30 cm of soil, total SOC stock values ranged from 2.78 to 4.49 kg·m−2. Soils associated with different vegetation types ranked as K. cristata > S. breviflora > L. chinensi s > A. mongolicum > S. krylovii > C. ammannii in terms of total SOC stock values. These results resembled trends observed in average SOC. This study detected considerable SOC stock variation among different plant communities. This was related to SOC and bulk density (). SOC and SOC reserves had the same driving factors.
4.4. Using the SRs of the SOC to evaluate soil quality as a result of enclosure
This study did not assess soil conditions before enclosure, but SRs of SOC can provide constraints on previous soil quality (Fernandez-Romero, Lozano-Garcia, and Parras-Alcantara Citation2014). In this study, compared with before enclosure, SR1, SR2, and SR3 of six plant communities increased by 7.67%, 6.14%, and 6.78% in the 0–5:5–10 cm, 0–5:10–20 cm, and 0–5:20–30 cm layers, respectively. This indicated that enclosure was conducive to increased SOC, especially in topsoil layers. Franzluebbers (Citation2002) stated that an SRs of SOC > 1.2 indicated an improved soil quality. Our findings revealed that values of the enclosure were mostly >1.2 for the SOC in the subsoil, reconfirming that enclosure was beneficial for the accumulation of surface soil. Additionally, plant communities and soil depth were the most influential factors for the SRs. In this study, the SRs of SOC in the 0–5:5–10 cm, 0–5:10–20 cm, and 0–5:20–30 cm layers significantly varied among different plant communities. This was driven by direct disturbance of environmental and topsoil nutrients (e.g., litter and roots) (Deng et al. Citation2016). The soils associated with S. breviflora, K. cristata, L. chinensis, and S. krylovii showed similar spatial trends in SRs. This was related to differences in SOC among different plant communities. In this study, we also found that soils associated with K. cristata yielded lower SR1 values than those measured from other plant communities. This was related to differences in SOC between 0–5 cm and 5–10 cm. In contrast, soils associated with C. ammannii yielded SR3 values <1.2. This value indicates a persistent state of degradation for this grassland (Fernandez-Romero, Lozano-Garcia, and Parras-Alcantara Citation2014). Hence, SRs is recommended as a good indicator to evaluate the quality of grassland soils.
5. Conclusions
The present study found that enclosure promoted root biomass, soil SOC, and SOC stock for the 14 protected grasslands in China. Soils associated with K. cristata contained the highest root biomass, SOC, and SOC stock. The SOC for the different plant communities gradually decreased with increasing soil depth, indicating that SOC derived primarily from root biomass and plant litter, and the rate of change of SOC was highest in the upper 0–10 cm of soil. Total SOC stock among the six plant communities ranged from 2.77 to 4.49 kg·m−2 in the upper 0–30 cm of soil. Results from RDA showed that root biomass, clay content, cover, and litter biomass were the main factors affecting SOC, SOC stock, and the rate of change of SOC. These results indicated that except for C. ammannii, plant communities improve soil quality. Enclosure, which supports the development of these plant communities, thus can improve soil quality and enhance SOC sequestration within desert-steppe environments. This study highlights the desirability of considering plant communities when assessing soil nutrient accumulation and suggests that SRs can be used as an indicator of grassland soil quality.
Acknowledgment
We are grateful to Dr. Mark Stanislaw Goettel from Canada for his help with language improvement and Paul Kretchmer at San Francisco Edit for improving the language in the paper.
Disclosure statement
No potential conflict of interest was reported by the author(s).
Additional information
Funding
References
- An, Y., Y. Gao, and X. H. Liu. 2019. “Interactions of Soil Moisture and Plant Community Properties in Meadows Restored from Abandoned Farmlands on the Sanjiang Plain China.” Community Ecology 20: 20–27. doi:10.1556/168.2019.20.1.3.
- Banger, K., S. S. Kukal, G. Toor, K. Sudhir, and T. H. Hanumanthraju. 2009. “Impact of Long-term Additions of Chemical Fertilizers and Farm Yard Manure on Carbon and Nitrogen Sequestration under Rice-cowpea Cropping System in Semi-arid Tropics.” Plant and Soil 318: 27–35. doi:10.1007/s11104-008-9813-z.
- Bardgett, R. D., L. Mommer, and F. T. De Vries. 2014. “Going Underground: Root Traits as Drivers of Ecosystem Processes.” Trends in Ecology&Evolution 29: 692–699. doi:10.1016/j.tree.2014.10.006.
- Batjes, N. H. 1996. “Total Carbon and Nitrogen in the Soils of the World.” European Journal of Soil Science 47: 151–163. doi:10.1111/ejss.12114_2.
- Batjes, N. H., and J. A. Dijkshoorn. 1999. “Carbon and Nitrogen Stocks in the Soils of the Amazon Region.” Geoderma 89: 273–286. doi:10.1016/S0016-7061(98)00086-X.
- Cesarz, S., P. B. Reich, S. Scheu, L. Ruess, M. Schaefer, and N. Eisenhauer. 2015. “Nematode Functional Guilds Not Trophic Groups, Reflect Shifts in Soil Food Webs and Processes in Response to Interacting Global Change Factors.” Pedobiologia 58: 23–32. doi:10.1016/j.pedobi.2015.01.001.
- Chirinda, N., S. D. Roncossek, G. Heckrath, L. Elsgaard, I. K. Thomsen, and J. E. Olesen. 2014. “Root and Soil Carbon Distribution at Shoulderslope and Footslope Positions of Temperate Toposequences Cropped to Winter Wheat.” Catena 123: 99–105. doi:10.1016/j.catena.2014.07.012.
- Deng, J., P. S. Sun, F. X. Zhao, X. H. Han, G. H. Yang, Y. Z. Feng, and G. X. Ren. 2016. “Soil C, N, P and Its Stratification Ratio Affected by Artificial Vegetation in Subsoil, Loess Plateau China.” Plos One 11: 1–18. doi:10.1371/journal.pone.0151446.
- Díaz-Zorita, M., and J. H. Grove. 2002. “Duration of Tillage Management Affects Carbon and Phosphorus Stratification in Phosphatic Paleudalfs.” Soil &Tillage Research 66 (2): 165–174. doi:10.1016/S0167-1987(02)00024-7.
- Ding, H., W. Pei, Z. Qiang, G. D. Han, and F. Tong. 2016. “Feature Extraction and Image Recognition of Typical Grassland Forage Based on Color Moment.” Transactions of the Chinese Society of Agricultural Engineering 32: 168–175. doi:10.11975/j.1002-6819.2016.23.023.
- Eisenhauer, N., A. Lanoue, T. Strecker, S. Scheu, K. Steinauer, M. P. Thakur, and L. Mommer. 2017. “Root Biomass and Exudates Link Plant Diversity with Soil Bacterial and Fungal Biomass.” Scientific Reports 7: 1–8. doi:10.1038/srep44641.
- Falloon, P. D., P. Smith, J. U. Smith, J. Szabó, K. Coleman, and S. Marshall. 1998. “Regional Estimates of Carbon Sequestration Potential: Linkingthe Rothamsted Carbon Model to GIS Databases.” Biology & Fertility of Soils 27: 236–241. doi:10.1007/s003740050426.
- Fan, H., W. W. Zhao, S. Daryanto, B. J. Fu, S. Wang, and Y. P. Wang. 2018. “Vertical Distribution of Doil Organic Carbon and Its Influencing Factors under Different Land Use Types in the Desert Riparian Zone of Downstream Heihe River Basin China.” Journal of Geophysical Research: Atmospheres 123: 7741–7753. doi:10.1029/2018JD028268.
- Fang, J. Y., Y. H. Yang, W. H. Ma, A. Mohammat, and H. H. Shen. 2010. “Ecosystem Carbon Stocks and Their Changes in China’s Grasslands.” Science China. Life Sciences 53: 757–765. doi:10.1007/s11427-010-4029-x>.
- Fernandez-Romero, M. L., B. Lozano-Garcia, and L. Parras-Alcantara. 2014. “Topography and Land Use Change Effects on the Soil Organic Carbon Stock of Forest Soils in Mediterranean Natural Areas.” Agriculture,Ecosystems and Environment 195: 1–9. doi:10.1016/j.agee.2014.05.015.
- Feyisa, K. S., A. Beyene, M. Y. Angassa, J. Said, D. Leeuw, A. Abebe, and B. Megersa. 2017. “Effects of Enclosure Management on Carbon Sequestration, Soil Properties and Vegetation Attributes in East African Range Lands.” Catena 159: 9–19. doi:10.1016/j.catena.2017.08.002.
- Figueiredo, C. C., D. V. S. Resck, M. A. C. Carneiro, M. L. G. Ramos, and J. C. M. Sa. 2013. “Stratification Ratio of Organic Matter Pools Influenced by Management Systems in a Weathered Oxisol from a Tropical Agro-ecoregion in Brazil.” Soil Research 51: 133–141. doi:10.1071/SR12186.
- Franzluebbers, A. J. 2002. “Soil Organic Matter Stratification Ratio as an Indicator of Soil Quality.” Soil and Tillage Research 66: 95–106. doi:10.1016/S0167-1987(02)00018-1.
- Gang, C. C., J. Zhang, and J. L. Li. 2011. “The Advances in the Carbon Source/sink Researches of Typical Grassland Ecosystem in China.” Procedia Environmental Sciences 10: 1646–1653. doi:10.1016/j.proenv.2011.09.259.
- Han, G. D., X. Y. Hao, M. L. Zhao, M. J. Wang, B. H. Ellert, W. Walter, and M. J. Wang. 2008. “Effect of Grazing Intensity on Carbon and Nitrogen in Soil and Vegetation in a Meadow Steppe in Inner Mongolia.” Agriculture Ecosystems&Environment 125: 21–32. doi:10.1016/j.agee.2007.11.009.
- Hu, Z. M., S. G. Li, Q. Guo, S. L. Niu, N. P. He, L. H. Li, and G. R. Yu. 2016. “A Synthesis of the Effect of Grazing Exclusion on Carbon Dynamics in Grasslands in China.” Global Change Biology 22: 1385–1393. doi:10.1111/gcb.13133.
- Jiao, C. X., G. H. Zheng, X. L. Xie, X. F. Cui, G. Shang, and C. Y. Zhao. 2020. “Rate of Soil Organic Carbon Sequestration in a Millennium Coastal Soil Chronosequence in Northern Jiangsu, China.” Catena 193: 1–9. doi:10.1016/j.catena.2020.104627.
- Kolbl, A., M. Steffens, M. Wiesmeier, C. Hoffmann, R. Funk, J. Krummelbein, A. Reszkowska, et al. 2011. “Grazing Changes Topography-controlled Topsoil Properties and Their Interaction on Different Spatial Scales in a Semi-arid Grassland of Inner Mongolia, P.R. China.” Plant and Soil 340: 35–58. doi:10.1007/s11104-010-0473-4.
- Lal, R. 2004. “Soil Carbon Sequestration Impacts on Global Climate Change and Food Security.” Science 304: 1623–1627. doi:10.1126/science.1097396.
- Li, X. B., Y. X. Bai, W. Y. Wen, H. Wang, R. H. Li, G. Q. Li, and H. Wang. 2017. “Effects of Grassland Degradation and Precipitation on Carbon Storage Distributions in a Semi-arid Temperate Grassland of Inner Mongolia, China.” Acta Oecologica-International Journal of Ecology 85: 44–52. doi:10.1016/j.actao.2017.09.008.
- Li, W. B., G. Z. Huang, and H. X. Zhang. 2020. “Enclosure Increases Nutrient Resorption from Senescing Leaves in a Subalpine Pasture.” Plant and Soil 457 (1–2): 269–278. doi:10.1007/s11104-020-04733-8.
- Li, D., S. Niu, and Y. Luo. 2012. “Global Patterns of the Dynamics of Soil Carbon and Nitrogen Stocks following Afforestation: A Meta-analysis.” New Phytologist 195: 1–10. doi:10.1111/j.1469-8137.2012.04150.x.
- Li, J. R., G. S. Okin, and H. E. Epstein. 2009. “Effects of Enhanced Wind Erosion on Surface Soil Texture and Characteristics of Windblown Sediments.” Journal of Geophysical Research-Biogeosciences 114: 1–8. doi:10.1029/2008JG000903.
- Ma, W. H., Y. H. Yang, J. S. He, H. Zeng, and J. Y. Fang. 2008. “Above- and Belowground Biomass in Relation to Environmental Factors in Temperate Grasslands, Inner Mongolia.” Science in China Series C-life Sciences 51: 263–270. doi:10.1007/s11427-008-0029-5.
- Manaye, A., M. Negash, and M. Alebachew. 2019. “Effect of Degraded Land Rehabilitation on Carbon Stocks and Biodiversity in Semi-arid Region of Northern Ethiopia.” Forest Science and Technology 15 (2): 70–79. doi:10.1080/21580103.2019.1592787.
- Mcsherry, M. E., and M. E. Ritchie. 2013. “Effects of Grazing on Grassland Soil Carbon: A Global Review.” Global Change Biology 19 (5): 1347–1357. doi:10.1111/gcb.12144.
- Murugan, R., H. J. Koch, and R. G. Joergensen. 2014. “Long-term Influence of Different Tillage Intensities on Soil Microbial Biomass, Residues and Community Structure at Different Depths.” Biology and Fertility of Soils 50 (3): 487–498. doi:10.1007/s00374-013-0871-x.
- Post, W. M., W. R. Emanuel, P. J. Zinke, and A. G. Stangenberger. 1982. “Soil Carbon Pools and World Life Zones.” Nature 298: 156–159. doi:10.1038/298156a0.
- Ren, G. H., C. X. Wang, K. H. Dong, H. S. Zhu, Y. C. Wang, and X. Zhao. 2018. “Effects of Grazing Exclusion on Soil-vegetation Relationships in a Semi-arid Grassland on the Loess Plateau, China.” Land Degradation & Development 29: 4071–4079. doi:10.1002/ldr.3164.
- Wang, H. Y., Z. Dong, J. Y. Guo, H. L. Li, J. R. Li, G. D. Han, and X. C. Chen. 2017a. “Effects of Grazing Intensity on Organic Carbon Stock Characteristics in Stipa Breviflora Desert Steppe Vegetation Soil Systems.” Rangeland Journal 39 (2): 169–177. doi:10.1071/RJ16007.
- Wang, S. Z., J. W. Fan, and Y. Z. Li. 2019. “Effects of Grazing Exclusion on Biomass Growth and Species Diversity among Various Grassland Types of the Tibetan Plateau.” Sustainability 11: 1–13. doi:10.3390/su11061705.
- Wang, Y. F., B. J. Fu, Y. H. Lu, C. J. Song, and Y. Luan. 2010. “Local-scale Spatial Variability of Soil Organic Carbon and Its Stock in the Hilly Area of the Loess Plateau, China.” Quaternary Research 73: 70–76. doi:10.1016/j.yqres.2008.11.006.
- Wang, Q., Z. J. Meng, J. Wang, X. H. Dang, X. N. Zhang, Z. Y. Wang, Q. Zhao, and J. X. Zhang. 2017b. “Response of the Vegetation Soil under Almost-natural Restoration in the Xilamuren Grassland.” Acta Ecologica Sinica 37 (4): 1159–1167. doi:10.5846/stxb201606151154.
- Wang, Y. Q., M. A. Shao, and Z. P. Liu. 2013. “Vertical Distribution and Influencing Factors of Soil Water Content within 21-m Profile on the Chinese Loess Plateau.” Geoderma 193: 300–310. doi:10.1016/j.geoderma.2012.10.011.
- Wu, G. L., G. Z. Du, Z. H. Liu, and S. Thirgood. 2009. “Effect of Fencing and Grazing on a Kobresia-dominated Meadow in the Qinghai-Tibetan Plateau.” Plant and Soil 319: 115–126. doi:10.1016/S0145-305X(00)00063-X.
- Wu, G. L., Z. H. Liu, L. Zhang, J. M. Chen, and T. M. Hu. 2010. “Long-term Fencing Improved Soil Properties and Soil Organic Carbon Storage in an Alpine Swamp Meadow of Western China.” Plant and Soil 332: 331–337. doi:10.1007/s11104-010-0299-0.
- Xiong, Y. W., B. Yu, M. T. Bai, X. Y. Zhang, G. H. Huang, and A. Furman. 2019. “Soil Properties and Plant Growth Response to Litter in a Prolonged Enclosed Grassland of Loess Plateau, China.” Journal of Earth Science 30: 1041–1048. doi:10.1007/s12583-019-1017-3.
- Xu, M. X., Z. Wang, and Y. G. Zhao. 2018. “Stratification Ratio of Soil Organic Carbon as an Indicator of Carbon Sequestration and Soil Quality in Ecological Restoration.” Restoration Ecology 26: 555–562. doi:10.1111/rec.12597.
- Yang, Y., Y. Luo, and A. C. Finzi. 2011. “Carbon and Nitrogen Dynamics during Forest Stand Development: A Global Synthesis.” New Phytologist 190 (4): 977–989. doi:10.1111/j.1469-8137.2011.03645.x.
- Zhang, M., X. B. Li, H. Wang, and Q. Huang. 2018. “Comprehensive Analysis of Grazing Intensity Impacts Soil Organic Carbon: A Case Study in Typical Steppe of Inner Mongolia, China.” Applied Soil Ecology 129: 1–12. doi:10.1016/j.apsoil.2018.03.008.
- Zhang, K., Y. Z. Su, and R. Yang. 2019. “Variation of Soil Organic Carbon, Nitrogen, and Phosphorus Stoichiometry and Biogeographic Factors across the Desert Ecosystem of Hexi Corridor, Northwestern China.” Journal of Soils and Sediments 19: 49–57. doi:10.1007/s11368-018-2007-2.
- Zhao, Y. Y., Y. Ding, X. Y. Hou, F. Y. Li, W. J. Hang, and X. J. Yun. 2017. “Effects of Temperature and Grazing on Soil Organic Carbon Storage in Grasslands along the Eurasian Steppe Eastern Transect.” Plos One 12: 1–16. doi:10.1371/journal.pone.0186980.
- Zhao, Y., S. Peth, J. Krummelbein, R. Horn, Z. Y. Wang, M. Steffens, C. Hoffmann, et al. 2007. “Spatial Variability of Soil Properties Affected by Grazing Intensity in Inner Mongolia Grassland.” Ecological Modelling 205: 241–254. doi:10.1016/j.ecolmodel.2007.02.019.
- Zhao, H. L., X. Y. Zhao, R. L. Zhou, T. H. Zhang, and S. Drake. 2005. “Desertification Processes Due to Heavy Grazing in Sandy Rangeland, Inner Mongolia.” Journal of Arid Environment 62: 309–319. doi:10.1016/j.jaridenv.2004.11.009.
- Zhu, M., Q. Feng, Y. Y. Qin, J. J. Cao, H. Y. Li, and Y. Zhao. 2017. “Soil Organic Carbon as Functions of Slope Aspects and Soil Depths in a Semiarid Alpine Region of Northwest China.” Catena 152: 94–102. doi:10.1016/j.catena.2017.01.011.