
ABSTRACT
In order to systematically identify the critical genes involved in the response to low inorganic phosphorus (Pi) in cotton, we performed RNA sequencing (RNA-seq) analyses of root, stem, and leaf from Gossypium hirsutum seedlings grown under both Pi replete and Pi deplete conditions. In total, 1679, 1611, and 841 differentially expressed genes (DEGs) were observed in the roots, stems, and leaves, respectively. Several Pi-starvation-induced genes homologous to Arabidopsis were identified, such as SPX, PHO1/2, and PHF1, as well as several members of the PHT1 family, which showed different expression levels in specific organs. Subsequently, 25 randomly selected DEGs were validated by quantitative real-time PCR, the result of which was consistent with the RNA sequencing data, indicating the reliability of RNA-seq data. By analyzing the differentially expressed transcription factors, we found that the MYB family was one of the three most abundant transcription factor families in all three tissues. Moreover, some phytohormone-related DEGs were also found in G. hirsutum seedlings in this study. In particular, some auxin-responsive genes, such as IAA24, IAA11/14/16, and IAA4/14/16/29 were differentially expressed in the roots, stems and leaves of G. hirsutum seedlings respectively. Finally, homologous genes for some important phosphatases such as PPCK1 and VTC4 were also found to be differentially expressed. On analyzing the protein interaction network of 121 shared DEGs, five interaction networks – two of which contained 10 and 6 DEGs, respectively – were identified. These findings provided a theoretical basis for studying the gene function of different cotton tissues in response to low Pi stress.
1. Introduction
Inorganic phosphorus (Pi) is one of the substrates required for the synthesis of nucleic acids and cellular membranes and for energy metabolism. Pi is involved in numerous physiological processes, such as enzyme regulation, carbohydrate metabolism, photosynthesis, respiration, and nitrogen fixation (Raghothama Citation1999; Vance, Uhde-Stone, and Allan Citation2003). The limited availability of Pi is a notable hindrance to high crop yield and global food security (Vance, Uhde-Stone, and Allan Citation2003; Cordell, Drangert J-O, and White Citation2009). Numerous studies have focused on regulatory networks of phosphate starvation response (PHR) genes at the molecular level. SYG1/PHO81/XPR1 (SPX) domain-containing proteins are involved in Pi transport and adaptation to Pi deficiency. Of special importance is SPX1, which is a Pi-dependent inhibitor of PHOSPHATE STARVATION RESPONSE 1 (PHR1) in Arabidopsis (Puga et al. Citation2014; Jung et al. Citation2018). Nine members of the PHOSPHATE TRANSPORTER 1 (PHT1) family are expressed in the plasma membrane and play a major role in Pi uptake from soil as well as in Pi re-mobilization from other organs (Nussaume et al. Citation2011). The members of the PHT2, PHT3, PHT4, and PHT5 families are expressed in the chloroplast envelop, mitochondria, plastid, and vacuoles and are Pi transporters that are used for Pi allocation and stress responses (Versaw and Harrison Citation2002; Guo et al. Citation2008; Zhu et al. Citation2012; Guo et al. Citation2013; Liu et al. Citation2016). miRNAs are used by plants to effectively monitor the Pi transporters and PHOSPHATE1 (PHO1) in the membrane system as they regulate the membrane-associated ubiquitin, and the miR399-PHOSPHATE2 (PHO2) and miR827-NITROGEN LIMITATION ADAPTATION (NLA) pathways have been thoroughly studied (Liu et al. Citation2014). Further, PHOSPHATE TRANSPORTER TRAFFIC FACILITATOR1 (PHF1) is an endoplasmic reticulum-localized protein and is one of the downstream components of PHO2 in Arabidopsis (González et al. Citation2005; Huang et al. Citation2013).
Numerous transcriptome analyses have been performed in model plants s such as Arabidopsis thaliana (Misson et al. Citation2005; Woo et al. Citation2012) and Brachypodium distachyon (Zhao, Wang, and Yin Citation2018), as well as in several crop plants, such as rice (Oryza sativa; Secco et al. Citation2013), soybean (Zeng et al. Citation2016), common bean (Phaseolus vulgaris L.; Silva et al. Citation2019), and oilseed rape (Zhang et al. Citation2019). These studies have broadened our knowledge on the mechanisms involved in responses to low Pi levels and helped us characterize the functions of several phosphate response genes, including SPXs, PHR1, PHOSPHATE TRANSPORTERS (PHTs), and phosphatase genes. In addition, it is known that some phytohormones, such as auxin, ethylene, gibberellin, cytokinin, abscisic acid (ABA), and strigolactones, are also involved in the response of plants to Pi deficiency (Chiou and Lin Citation2011; Zhang, Liao, and Lucas Citation2014). Auxin plays an important role in root development under Pi deficiency. Primary root, lateral root and root hair were all affected in response to exogenous auxin, which is similar with low Pi treatment (Zhang, Liao, and Lucas Citation2014). Some key genes such as a small ubiquitin-related modifier E3 ligase (SAP AND MIZ1 DOMAIN-CONTAINING LIGASE1, SIZ1), the auxin receptor TRANSPORT INHIBITOR RESPONSE 1 (TIR1), auxin response factor 19 (ARF19), and other ARFs have been found to be involved in both auxin-dependent (auxin transport or auxin sensitivity) and auxin-independent processes in the root system (Zhang, Liao, and Lucas Citation2014).
Cotton is one of the largest commercial crops worldwide, and it is the most common source of renewable natural fiber for the global textile industry (Wendel and Cronn Citation2003). Pi deficiency impairs cotton growth and development owing to decreased leaf expansion, photosynthetic capacity, and biomass accumulation (Singh et al. Citation2013). In agriculture practice, large amounts of fertilizers are usually applied to improve the yield of cotton, which caused negative effects on environment. Dissecting the physiological and molecular response of cotton to Pi starvation, and identifying the critical regulatory genes involved in this process are of vital importance for sustainable agriculture as well as for creating high Pi-efficient cotton germplasm. However, the physiological characteristics and gene network changes occurring in cotton plants in response to Pi deficiency are largely unknown. To this end, this study aimed to examine the physiological and transcriptomic changes of Gossypium hirsutum roots, stems, and leaves in response to Pi deficiency and uncover the key differentially expressed genes (DEGs).
2. Results
2.1. Physiological response to Pi deficiency
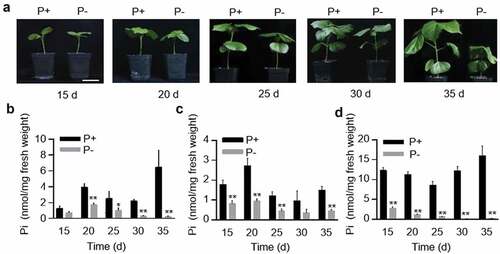
In order to detect the effect of Pi deficiency on G. hirsutum seedlings, G. hirsutum seeds were cultured in half Hoagland medium; some seeds were placed in medium with sufficient Pi for 35 d, while the others were placed in medium deficient in Pi for the same period. The first true leave, the stem between root and cotyledon node, all the roots were chosen as the representative of each organ. The Pi and total phosphorus concentration were measured every 5 d, and the phenotype was photographed at the same time ( and Supplemental Fig. 1). Compared with G. hirsutum seedlings grown in Pi-sufficient conditions, seedlings grown under Pi-deficient conditions showed slower growth, which were significantly shorter in height and had smaller leaves but more delicate stems. At 30 d, the old leaves of seedlings grown under Pi-deficient conditions gradually became dry and appeared gray–green along the edges. The Pi concentration in all tissues was lower in seedlings grown under Pi-deficient conditions than that under Pi-sufficient conditions at 20 d, 25 d and 35 d. Interestingly, the Pi concentration in the roots and stems reached peak levels at 20 d and decreased subsequently, while that in leaves decreased continuously from day 15 onwards under Pi-deficient conditions (). The changing trend of total phosphorus concentration in each tissue was similar to the Pi concentration (Supplemental Fig. 1C-E).
Figure 1. The phenotype and Pi concentrations of Gossypium hirsutum plants to low Pi treatments. (a) Phenotypes of G. hirsutum seedlings after 15, 20, 25, 30 and 35 days (d) growth in Pi replete (P+) and Pi deplete (P-) media. Bar = 5 cm. (b-d) Pi concentration in the roots (b), stems (c) and leaves (d) of seedlings grown for 15, 20, 25, 30 and 35 days under P+ and P- conditions. The SD (n = 3) is represented by error bars. Asterisks indicate a significant difference compared with the corresponding control (**P < 0.01, *P < 0.05, Student’s t-test).
2.2. Transcriptome response to Pi deficiency
Phenotype analyses revealed that G. hirsutum seedlings were sensitive to Pi deficiency. The low Pi responses were obvious gradually after 30 d treatment, thus 30 d was chosen as the cutoff date for RNA sequencing (RNA-seq). RNA-seq of root, stem, and leaf tissues was performed to further elucidate the molecular basis for Pi starvation responses in cotton. A total of 388.529 million clean reads were obtained (average no. of reads per sample, 21.58 million). The average alignment rate between the samples and the genome was 97.19%, and that between the sample and the gene set was 75.30%. Moreover, Q30 was not less than 90.16%. Together, this indicated the reliable quality of the RNA-seq results (Supplemental Table 1).
2.3. Differentially expressed genes under low-Pi treatment
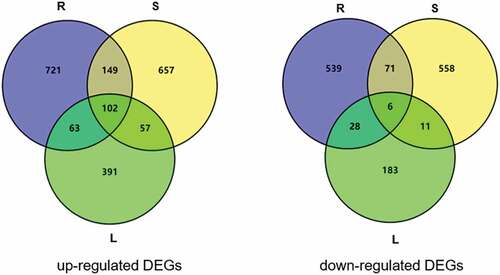
Altogether 65,867 genes were identified in the RNA-seq analysis. A total of 1679 (1035 up-regulated and 644 down-regulated), 1611 (965 up-regulated genes and 646 down-regulated), and 841 (613 up-regulated and 228 down-regulated) DEGs were identified in the root, stem, and leaf tissues under Pi deficient conditions, respectively ( and Supplemental Table 2). Among these genes, 102 up-regulated and 6 down-regulated DEGs were common to all three tissue types.
Figure 2. RNA sequence analyses of differentially expressed genes (DEGs) in roots, stems and leaves of G. hirsutum seedlings after growing on Pi repleteand Pi deplete medium for 30 days. Diagram showing the up-regulate and down-regulated DEGs under Pi deficiency condition in G. hirsutum seedlings.
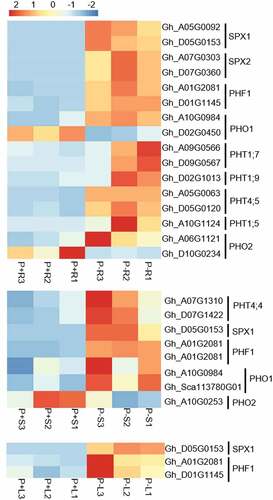
Some homologs of Arabidopsis Pi deficiency-induced marker genes such as SPX1, SPX2, PHF1, PHO1, PHO2, PHT1 genes (PHT1;5, PHT1;7, and PHT1;9), and PHT4;5 were observed in the different tissues ( and Supplemental Table 3). The expression of SPX genes SPX1 and SPX2 was significantly higher in roots; SPX1 expression was most enhanced in stem tissue and showed slight elevations in the leaves of G. hirsutum seedlings. One of the PHO1/2 homolog genes was slightly up-regulated in the roots, and the other showed downregulation. Two of the PHO1 homolog genes showed up-regulation in the stems but the gene expression of PHO2 was decreased ( and Supplemental Table 3). PHT1;5, PHT1;7, and PHT1;9 were solely found to be differentially expressed in the roots.
Figure 3. Heatmap display of Pi deficiency-induced marker homolog DEGs in roots (upper heatmap), stems (middle heatmap) and leaves (lower heatmap) of G. hirsutum seedlings respectively. P + R/P + S/P + L represent root/stem/leaf sample under Pi replete condition, P-R/P-S/P-L represent root/stem/leaf sample under Pi deplete condition. The red color indicates a high level of expression while blue indicates low expression.
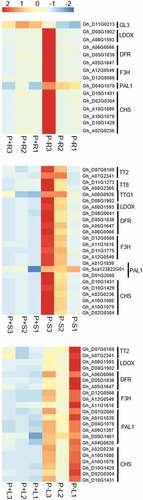
Anthocyanin accumulation is one of the primary characteristics of the response to low-Pi stress in plants. Flavonoid biosynthesis leads to the synthesis of molecules from its structural subclasses, including anthocyanins. The transcriptional control of flavonoid biosynthesis has been intensively studied (Broun Citation2005). In our study, flavonoid biosynthesis genes and regulatory genes were found to be differentially expressed under low-Pi conditions ( and Supplemental Table 4). Homologs of the Arabidopsis genes TRANSPARENT TESTA18 (TT18), dihydroflavonol reductase (DFR), flavonoid 3′-hydroxylase (F3ʹH), PHE ammonia lyase 1 (PAL1), and CHALCONE SYNTHASE (CHS) were found in all tissues.
Figure 4. Heatmap display of flavonoid biosynthetic and regulatory DEGs in roots (upper heatmap), stems (middle heatmap) and leaves (lower heatmap) of G. hirsutum seedlings respectively. P + R/ P + S/ P + L represent root/stem/leaf sample under Pi replete condition, P-R/ P-S/ P-L represent root/stem/leaf sample under Pi deplete condition. The red color indicates a high level of expression while blue indicates low expression.
2.3. DEGs: transcription factors
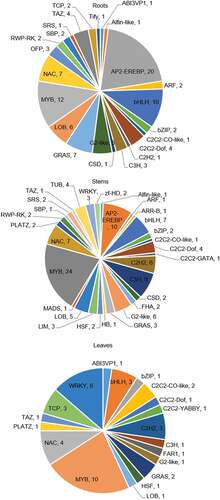
Overall, 258 transcription factor genes showed differential expression under Pi-deficient conditions (44 DEGs in root tissue, 98 in stem tissue, and 116 in leaf tissue) ( and Supplemental Table 5). The transcription factor families showing the highest enrichment differed among the three tissues. The three transcription factors families with most differential expression genes were as follows: (a) roots: AP2-EREBP, MYB, and basic helix-loop-helix (bHLH) families, which had 20, 12, and 10 members, respectively; (b) leaves: MYB, WRKY, and NAC families, having 10, 6, and 4 members, respectively; and (c) stems: MYB, AP2-EREBP, and C3H families, with 24, 10, and 9 members, respectively. Among these differentially expressed transcription factors, only Gh_A11G2875 – a member of the MYB transcription factor family – was found to be differentially expressed in all three tissues. It showed a slight higher fold change in the stem (2.53-fold) than in the leaves (2.11-fold) and roots (1.06-fold).
Figure 5. Fan diagram display of DEGs related to transcription factors in roots (upper diagram), stems (middle diagram) and leaves (lower diagram) of G. hirsutum seedlings respectively.
2.4. GO enrichment analysis of DEGs
GO terms were assigned to the complete set of genes differentially expressed under Pi-deficient conditions. The 1679 DEGs in root tissue, 1611 DEGs in stem tissue, and 841 DEGs in leaf tissue were categorized by 44, 39, and 37 GO terms, respectively, based on biological processes, cellular components, and molecular function (Supplemental Figs. 2–4 and Supplemental Table 6). Under the biological process category, metabolic process (351 genes, 20.91% of the 1679 DEGs in roots; 348 genes, 21.60% of the 1611 DEGs in stems; 212 genes, 25.21% of the 841 DEGs in leaves) and cellular process (310 genes, 18.46% in roots; 334 genes, 20.73% in stems; 181 genes, 21.52% in leaves) were the most enriched subcategories. In the cellular component category, the most abundant subcategories were membrane (374 genes, 22.28% in roots; 348 genes, 21.60% in stems; 231 genes, 27.47% in leaves) and membrane parts (363 genes, 21.62% in roots; 335 genes, 20.79% in stems; 221 genes, 26.28% in leaves). Finally, in the molecular function category, most genes were sorted into the catalytic activity (632 genes, 37.64% in roots; 556 genes, 34.51% in stems; 362 genes, 43.04% in leaves) and binding subcategories (530 genes, 31.57% in roots; 516 genes, 32.03% in stems; 282 genes, 33.53% in leaves).
In the GO analysis, 13 and 11 DEGs from the roots and leaves of G. hirsutum seedlings, respectively, were tagged to GO:0009733, meaning that they were involved in a response to auxin stimuli (Supplemental Table 7). Meanwhile, 5 DEGs from the stems of G. hirsutum seedlings were tagged to GO:0071365, which includes genes involved in the cellular response to auxin stimuli. Most of these genes belonged to the SAUR-like auxin-responsive protein family or were indoleacetic acid-induced proteins or auxin response factors such as ARF18 and IAA14/11/16/29. Among the DEGs in the roots of G. hirsutum seedlings, the homolog to the Arabidopsis gene ATOSM34 and eukaryotic aspartyl protease family protein genes were assigned the GO terms for a response to ethylene and abscisic acid, respectively. Among the DEGs in the stems, FASCICLIN-like arabinogalactan-protein 12/9 (FLA 12/9) and xyloglucan endotransglucosylase/hydrolase 7 (XTH7) were linked to the GO terms for a response to gibberellin. In addition, FLA 12/9 genes were also tagged to the GO terms for the response to cytokinins and abscisic acid. Transducin/WD40 repeat-like superfamily protein and XTH7 genes were tagged to the GO categories for response to ethylene and brassinosteroid, respectively.
Protein phosphorylation and dephosphorylation are involved in the regulation of Pi deficiency responses (Lan, Li, and Schmidt Citation2012, Citation2013). A subset of Arabidopsis homolog kinase and phosphatase genes were found in the list of DEGs (Supplemental Table 8). There were 59 and 42 DEGs associated with protein kinase activity in the roots and stems of G. hirsutum seedlings, respectively, whereas there were 64 such DEGs in the leaves. Kinase genes included members of various subfamilies; phosphoenolpyruvate carboxylase kinase 1 (PPCK1) and CBL-interacting protein kinase (CIPK) members were found to be differentially expressed in all tissues. Phosphoenolpyruvate carboxylase 3 and 4 were found to show differential expression in the roots of G. hirsutum seedlings.
Under Pi deficiency, plants generate more acid phosphatases (APases) to mobilize internal and external organic phosphorus. The genes encoding the members of the most important class of acid phosphatases, purple acid phosphatases (PAPs), were also found to be differentially expressed in all three tissues (Supplemental Table 9). PAP18 was differentially expressed in all tissues, and the homologs of the Arabidopsis genes PAP3/10/26 were found to be differentially expressed in the roots, stems, and leaves, respectively. In addition, the phosphatase 2C (PP2C) gene was found to be differentially expressed in G. hirsutum seedlings. Finally, the homolog of the inositol-1-monophosphatase gene (vitamin c4, VTC4) showed higher expression under Pi deficiency in the roots and leaves of G. hirsutum seedlings.
2.5. Validation of DEGs using qRT-PCR
The reliability of RNA-seq data was validated using quantitative real-time PCR (qRT-PCR). Thirty DEGs from the roots, stems, and leaves of G. hirsutum seedlings were chosen. These included Pi deficiency-induced marker homolog genes (Gh_A07G0303, Gh_D09G0567, Gh_A10G1124, and Gh_A01G2081 in roots, Gh_A10G0984, Gh_A01G2081, Gh_A07G0303, and Gh_D07G0416 in stems, and Gh_A01G2081 and Gh_A07G0303 in leaves), some vital phosphatases and kinases (Gh_D01G1328, Gh_D13G0199, Gh_D11G2549, and Gh_D01G2339 in roots, Gh_D01G1328 and Gh_A10G0080 in stems, and Gh_A05G0066, Gh_D05G1806, and Gh_D01G1328 in leaves), hormone-related genes (Gh_D07G2498 in roots and Gh_A09G2394 in stems), and other randomly selected genes. Except for Gh_D05G3607 and Gh_D11G2540, the expression patterns of the other genes were all consistent with the results of the transcriptome analysis (Supplemental Fig. 5), confirming the reliability of the RNA-seq results.
2.6. Protein interaction network of 121 shared DEGs
In order to further analyze the 121 DEGs shared among all three tissues, a protein interaction network map was made based on the STRING database. Five interaction networks were obtained, two of which contained 10 and 6 DEGs, respectively; the other groups each contained 2 DEGs (Supplemental Fig. 6). In the interaction group with 10 DEGs, 6 genes were found to be related to flavonoid metabolism (Gh_A05G1412, Gh_A10G1079, Gh_D02G0304, Gh_D05G1596, Gh_D05G1836, and Gh_D12G1686). In addition, the sulfide synthesis-related gene Gh_D05G0429, the NAD(P) binding protein Gh_A08G0826, phosphodiesterase Gh_D10G0773, and aquaporin Gh_D01G2085 were also identified. The homologs of Gh_D05G0429 and Gh_D10G0773 in Arabidopsis thaliana are AtSQD1 and AtSRG3, respectively.
In the second interaction network with 6 DEGs, all genes were related to anthocyanin biosynthesis. The third group had Gh_A01G0774 and Gh_D02G1012, which encode phosphoglycerate kinase and phosphofructose kinase, respectively, both of which are part of the glucose metabolism pathway. The upregulation of these two genes may indicate a decrease in the concentration of related metabolites in the glycolysis and gluconeogenesis pathways in cotton plants under Pi deficiency. The fourth group consisted of Gh_A01G0928 and Gh_A05G3807, which encode ubiquitin-binding enzyme and a protein containing the BRIC-a-brac (BTB) domain, respectively. Finally, the fifth group contained Gh_D05G1825 and Gh_D11G2549, which encode mitogen-activated protein kinase homolog (NTF3) and phosphoenolpyruvate carboxylase kinase (PPCK), respectively.
3. Discussion
In this study, roots, stems, and leaves of G. hirsutum seedlings were chosen to examine the changes in the transcriptome profile of upland cotton after 30 d of treatment in Pi sufficient and deficient conditions. In total, 1679, 1611, and 841 DEGs were identified in the roots, stems, and leaves, respectively under Pi-deficient conditions ( and Supplemental Table 2).
As several of the tissue differentially expressed Arabidopsis low-Pi response marker homolog genes we observed belonged to the SPX, PHO1/2, PHF1, and PHT1 families, expression pattern analysis could enhance our understanding of their regulation in response to low Pi levels in G. hirsutum seedlings. Most of the genes of PHT1 family that are expressed in roots are upregulated in response to low Pi stress. They play roles in both Pi uptake from soil and its translocation within plants (Poirier and Jung Citation2015). For example, the functions of nine out of thirteen PHT1 genes in rice (OsPT1/2/4/6/8/9/10/11/13) have been confirmed (Wang et al. Citation2018). In maize, five genes encoding Pht1 phosphate transporters were identified (Nagy et al. Citation2006). Here, our results showed that 3 out of the 9 PHT1 genes (PHT1;5, PHT1;7, and PHT1;9) showed increased expression in roots ( and Supplementary Table 3), indicating that homologous Pi transporters are also mainly expressed in the roots of G. hirsutum. It is known that PHT1;5 and PHT1;9 might regulate Pi uptake and Pi translocation into the xylem respectively in Arabidopsis (Młodzińska and Zboińska Citation2016). In addition, the expression of PHT4;5 and PHT4;4 increased respectively in roots and stems. This expression pattern is different from Arabidopsis, which is predominantly expressed in leaves (Guo et al. Citation2008). The different PHT1/4 tissue-specific expression patterns might affect the different Pi concentration variations in the roots, stems, and leaves of G. hirsutum seedlings.
The production, sensitivity, and transport of phytohormone show changes in order to regulate the expression of PHR genes and the root system architecture (Chiou and Lin Citation2011). Some phytohormone-related DEGs showed tissue specific expression in G. hirsutum seedlings in this study (Supplemental Table 7). In particular, some auxin-responsive genes, such as IAA24, IAA11/14/16 and IAA4/14/16/29, were observed in the roots, stems and leaves of G. hirsutum seedlings respectively. It is recognized that the low-Pi induced expression of TIR 1 promotes the degradation of AUX/IAA proteins (especially IAA14). Subsequently, some auxin response factors activate or repress genes involved in lateral root development (Pérez‐Torres et al. Citation2008). In this study, the results indicated the presence of a conserved connection between low Pi levels and auxin signaling in G. hirsutum, which warrants further research.
Besides the tissue specific expression DEGs were found in this RNA-seq, the common expressed transcription factor was also identified. The MYB family was one of the three most abundant transcription factor families in all three tissues in our study (Supplemental Table 5). A member of MYB family, Gh_A11G2875 was found to be differentially expressed in all three tissues but showed higher expression in stems and leaves. Its homologous Arabidopsis gene AtMYBD modulates anthocyanin biosynthesis in a circadian clock-related manner (Nguyen and Lee Citation2016). It suggests that Gh_A11G2875 may also be involved in low Pi responses such as anthocyanin accumulation in aboveground parts. Previous work has shown that the PHR protein family contains the MYB and coiled-coil domains. The most widely studied PHR protein family members, such as AtPHR1 in Arabidopsis thaliana (Nilsson, Müller, and Nielsen Citation2007) and OsPHR2 in Oryza sativa (Zhou et al. Citation2008), may activate the gene expression of a wide range of PSI genes by binding to PHR1 binding sequence (P1BS) elements in a Pi-dependent manner (Nilsson, Müller, and Nielsen Citation2007; Liu et al. Citation2010). The AtPHR1/OsPHR2 signaling pathway has been intensively studied in recent years (Sega and Pacak Citation2019). The results presented in the present study may offer new insights into the role of the MYB family in response to Pi deplete stress in G. hirsutum seedlings.
All the characteristic DEGs mentioned above are summarized in , and . According to the DEGs analysis, 121 DEGs shared among all three tissues, which includes many Arabidopsis homologue genes such as PHF1, VTC4, DRF and etc. (Supplemental Fig. 6). The expression of VTC4 was found to be increased in the roots and leaves of G. hirsutum seedlings under Pi deficiency in this study. This suggests that many conserved genes are common between cotton and Arabidopsis in response to low Pi stress. It was reported that PPCK genes are rapidly induced by Pi starvation, leading to increased phosphorylation of phosphoenolpyruvate carboxylase (Chen et al. Citation2007). In this study, PPCK1 was activated in all tissues of G. hirsutum seedlings. Protein interaction network analysis of 121 common DEGs revealed some novel genes (such as AtSQD1 and AtSRG3 homologous DEGs) in cotton under Pi deplete condition. Previous studies have shown that both AtSQD1 and AtSRG3 are activated by low Pi levels in Arabidopsis thaliana (Wang, Secco, and Poirier Citation2008; Müller et al. Citation2007). AtSQD1 is one of the enzymes involved in the synthesis of sulfonated lipid 6-sulfonyl-α-quinolone diacylglycerol (SQDG). SQDG maintains the charge balance in the thylakoid membrane by substituting phosphatidylglycerol under conditions of Pi deficiency (Sanda et al. Citation2001). AtSRG3 is involved in the hydrolysis of glycerol phosphate, glycerol phosphocholine, and glycerol phosphate ethanolamine, and releases phosphate to maintain intracellular phosphorus balance through the lipid metabolic pathway during low-Pi stress (Cheng et al. Citation2011).
Table 1-1. The summary of characteristic DEGs in roots in this study.
Table 1-2. The summary of characteristic DEGs in stems in this study.
Table 1-3. The summary of characteristic DEGs in leaves in this study.
In summary, this study presents a transcriptome profile of root, stem and leaf tissues of Gossypium hirsutum in response to low Pi stress and identifies several Pi-starvation induced homologous genes such as SPX, PHO1/2, and PHF1, as well as several members of the PHT1 family from DEGs. Among the expressed transcription factors, MYB family is the most differential expression in the DEGs list. Some auxin-responsive DEGs showed different expression patterns in different tissues. In addition, 121 DEGs shared among all three tissues were also identified. The results presented herein might provide insights into the importance of some key genes in G. hirsutum seedlings in conditions of Pi deficiency.
4. Materials and methods
4.1. Plant materials and growth conditions
The standard line of upland cotton (G. hirsutum; TM-1) was used in this study. After being soaked in unionized water for 5–8 h, cotton seeds were placed on wet filter papers for 12–24 h. After the roots grew to 3–4 cm, they were transferred to half Hoagland medium (2 mM Ca(NO3)2, 2.5 mM KNO3, 0.5 mM NH4NO3, 0.5 mM KH2PO4, 1 mM MgSO4, 12.5 μM Fe (as Fe-EDTA), 12.5 nM KI, 250 nM H3BO3, 250 nM MnSO4, 92.5 nM ZnSO4, 3 nM Na2MoO4, 0.25 nM CuSO4, and 0.25 nM CoCl2, pH 6.2–6.3) and allowed to grow. Half of the seeds were placed in a Pi replete medium (P+), and the other half were placed in medium not containing KH2PO4 (P-). The half Hoagland medium was changed every two days. The seeds of G. hirsutum were grown in hydroponic tank with pebbles at 24°C/20°C day/night temperatures with a photoperiod of 14 h light and 10 h dark for 30–35 days and a relative humidity of 60%. The height of stem was measured, the dry weight of each tissue was weight and root-shoot ratio was determined. The first true leaf, the stem between the root and cotyledon node, and all the roots were collected for RNA extraction after 30 d, when the cotton material grew. Each tissue sample was examined in triplicate.
4.2. Total RNA extraction, cDNA library construction, and RNA-seq
Total RNA extraction, cDNA library construction, and RNA-seq were conducted by Shenzhen Huada Gene Science and Technology Service Co., Ltd. Total RNA samples treated with DNase I were enriched by oligo dT-attached magnetic beads. Then the enriched mRNA was fragmented. The fragmented mRNA was synthesized into cDNA using random primers. Subsequently, the amplified cDNA fragments were added to a single ‘A’ base at the terminal and ligated by bubble adapter. The ligation products then underwent PCR reaction. A single strand DNA circle library was made after the recycle of PCR products and cyclization. Next, DNA nanoballs (DNBs) were generated with the ssDNA circle by rolling circle replication. The DNBs were loaded into the patterned nanoarrays and sequenced using BGISEQ-500 platform, the average output for each sample was 21.58 million reads. All the original data generated were uploaded to the NCBI Short Read Archive, the accession number is PRJNA771715.
4.3. Bioinformatic analysis of transcriptome data
The Cotton reference Genome (Gossypium hirsutum [AD1] Genome NAU-NBI Assembly v1.1 & Annotation v1.1) was downloaded from the CottonGen Database (Yu et al. Citation2014). SOAPnuke, a filtering software developed by Huada, was used for statistical analysis. The adapter sequence (Forward filter, AAGTCGGAGGCCAAGCGGTCTTAGGAAGACAA. Reverse filter: AAGTCGGATCGTAGCCATGTCGTTCTGTGAGCCAAGGAGTTG) was used to remove the adapter of raw data. After got the clean reads, HISAT2 (the version is v2.0.4; Kim, Langmead, and Salzberg Citation2015) was used to compare the clean reads with the reference genome sequence. RSEM (the version is v1.2.8; Li and Dewey Citation2011) was used to calculate the expression level of the genes and transcripts. Using DEGseq (Wang et al. Citation2010), we identified the genes differentially expressed between the control and treatment groups. Subsequently, P-values were calculated considering a normal distribution, and then, P-values were corrected to Q-values. In order to improve accuracy, genes with more than twice the difference in expression (fold change ≥ 2), a FPKM ≥ 3, and an adjusted Q-value ≤ 0.001 were screened as DEGs. The GO analysis of these DEGs were performed online using the Huada Gene Interactive reporting system (https://biosys.bgi.com/). The interaction between common DEG-encoded proteins was analyzed by STRING (version 11.0) database. The input gene set was set as common DEGs in three tissues.
4.4. Real-time quantitative PCR
The RNA prep Pure Plant Kit (Polysaccharides and Polyphenolics-rich) (TIANGEN, Beijing, China) was used to extract the total RNA from the control and low-Pi treatment samples. The total RNA was reverse transcribed to cDNA using the HiScript II QRT SuperMix for qPCR (Vazyme, Nanjing, China). The ChamQ SYBR Color qPCR Master Mix (Vazyme, Nanjing, China) was used to perform qRT-RCR analysis on a LightCycler 480II system (Roche, USA). The relative gene expression level was calculated using the 2−ΔΔCt method. Twenty-five selected DEGs were analyzed using three biological and technical replicates. GhUBQ7 was employed as the internal control. The primer sequences used are listed in Supplemental Table S10.
4.5. Determination of inorganic phosphorus and total phosphorus concentration
The method was slightly modified from that used by Lei et al. (Citation2016) and Lv et al. (Citation2021). For the inorganic phosphorus concentration assay, fresh tissue samples (0.03 g) were placed in a 1.5-ml centrifuge tube, and 50 μl water was added. The sample was ground into homogenate, and then, 125 μl of water was added. The mixture was centrifuged at 3000 × g for 4 min. For the total phosphorus assay, the plant tissues were dried at 70°C for 48 h and digested with the mixture of nitric acid using an optimized microwave vacuum tissue processing system (MARS, CEM, USA). Then, 10 μl of above treated supernatant was added to a 96-well plate, followed by 15 μl water, 100 μl of 1 M HCl, and 100 μl of dye (4.2% [w/v] H8MoN2O4 [dissolved in 5 N HCl], 0.2% [w/v] Malachite Green = 1:3). After 15 min at room temperature, 100 μl 1.5% (v/v) Tween-20 was added to the plate. After another 15 min, the absorbance was measured at a wavelength of 660 nm and the concentration of Pi or total phosphorus was calculated using the standard curve obtained with KH2PO4.
4.6. Statistical analysis
All values are expressed as arithmetic mean ±SD. Statistical analyses were carried out using GraphPad Prism 6 software. Student’ s t-test was used in analyzing the significant differences with Pi replete condition. It was used in the analysis of height of stem, root-shoot ratio and Pi/total phosphorus concentrations experimental data. P < 0.05 was considered as statistical significance.
Supplemental Material
Download Zip (3.9 MB)Disclosure statement
No potential conflict of interest was reported by the author(s).
Supplementary material
Supplemental data for this article can be accessed online at https://doi.org/10.1080/00380768.2022.2098533.
Additional information
Funding
References
- Broun, P. 2005. “Transcriptional Control of Flavonoid Biosynthesis: A Complex Network of Conserved Regulators Involved in Multiple Aspects of Differentiation in Arabidopsis.” Current Opinion in Plant Biology 8 (3): 272–279. doi:10.1016/j.pbi.2005.03.006.
- Chen, Z. H., G. A. Nimmo, G. I. Jenkins, and H. G. Nimmo. 2007. “BHLH32 Modulates Several Biochemical and Morphological Processes that Respond to Pi Starvation in Arabidopsis.” Biochemical Journal 405 (7): 191–198. doi:10.1042/BJ20070102.
- Cheng, Y. X., W. B. Zhou, N. I. Sheery, C. Peters, M. Y. Li, X. M. Wang, and J. R. Huang. 2011. “Characterization of the Arabidopsis Glycerophosphodiester Phosphodiesterase (GDPD) Family Reveals a Role of the plastid–localized AtGDPD1 in Maintaining Cellular Phosphate Homeostasis under Phosphate Starvation.” The Plant Journal 66 (5): 781–795. doi:10.1111/j.1365-313X.2011.04538.x.
- Chiou, T. J., and S. I. Lin. 2011. “Signaling Network in Sensing Phosphate Availability in Plants.” Annual Review of Plant Biology 62 (1): 185–206. doi:10.1146/annurev-arplant-042110-103849.
- Cordell, D., W. S. Drangert J-O, and S. White. 2009. “The Story of Phosphorus: Global Food Security and Food for Thought.” Global Environmental Change 19 (2): 292–305. doi:10.1016/j.gloenvcha.2008.10.009.
- González, E., R. Solano, V. Rubio, A. Leyva, and J. Paz-Ares. 2005. “Phosphate Transporter Traffic Facilitator1 Is a Plant-Specific SEC12-Related Protein that Enables the Endoplasmic Reticulum Exit of a High-Affinity PHOSPHATE TRANSPORTER in Arabidopsis [W].” The Plant Cell 17 (12): 3500–3512. doi:10.1105/tpc.105.036640.
- Guo, B., S. Irigoyen, T. B. Fowler, and W. K. Versaw. 2008. “Differential Expression and Phylogenetic Analysis Suggest Specialization of plastid-localized Members of the PHT4 Phosphate Transporter Family for Photosynthetic and Heterotrophic Tissues.” Plant Signaling & Behavior 3 (10): 784–790. doi:10.4161/psb.3.10.6666.
- Guo, C., X. Zhao, X. Liu, L. Zhang, J. Gu, X. Li, W. Lu, and K. Xiao. 2013. “Function of Wheat Phosphate Transporter Gene TaPHT2;1 in Pi Translocation and Plant Growth Regulation under Replete and Limited Pi Supply Conditions.” Planta 237 (4): 1163–1178. doi:10.1007/s00425-012-1836-2.
- Huang, T. K., C. L. Han, S. I. Lin, Y. J. Chen, Y. C. Tsai, Y. R. Chen, J. W. Chen, et al. 2013. “Identification of Downstream Components of Ubiquitin-Conjugating Enzyme PHOSPHATE2 by Quantitative Membrane Proteomics in Arabidopsis Roots.” The Plant Cell 25 (10): 4044–4060. doi:10.1105/tpc.113.115998.
- Jung, J. Y., M. K. Ried, M. Hothorn, and Y. Poirier. 2018. “Control of Plant Phosphate Homeostasis by Inositol Pyrophosphates and the SPX Domain.” Current Opinion in Biotechnology 49: 156–162. doi:10.1016/j.copbio.2017.08.012.
- Kim, D., B. Langmead, and S. L. Salzberg. 2015. “HISAT: A Fast Spliced Aligner with Low Memory Requirements.” Nature Methods 12 (4): 357–360. doi:10.1038/nmeth.3317.
- Lan, P., W. Li, and W. Schmidt. 2012. “Complementary Proteome and Transcriptome Profiling in phosphate-deficient Arabidopsis Roots Reveals Multiple Levels of Gene Regulation.” Molecular & Cellular Proteomics 11 (11): 1156–1166. doi:10.1074/mcp.M112.020461.
- Lan, P., W. Li, and W. Schmidt. 2013. “Genome-wide co-expression Analysis Predicts Protein Kinases as Important Regulators of Phosphate deficiency-induced Root Hair Remodeling in Arabidopsis.” BMC Genomics 14 (1): 210. doi:10.1186/1471-2164-14-210.
- Lei, K. J., Y. M. Lin, J. Ren, L. Bai, Y. C. Miao, G. Y. An, and C. P. Song. 2016. “Modulation of the phosphate-deficient Responses by microRNA156 and Its Targeted SQUAMOSA PROMOTER BINDING PROTEIN-LIKE 3 in Arabidopsis.” Plant and Cell Physiology 57 (1): 192–203. doi:10.1093/pcp/pcv197.
- Li, B., and C. N. Dewey. 2011. “RSEM: Accurate Transcript Quantification from RNA-Seq Data with or without a Reference Genome.” BMC Bioinformatics 12 (1): 323. doi:10.1186/1471-2105-12-323.
- Liu, F., Z. Wang, H. Ren, C. Shen, Y. Li, H. Q. Ling, C. Wu, X. Lian, and P. Wu. 2010. “OsSPX1 Suppresses the Function of OsPHR2 in the Regulation of Expression of OsPT2 and Phosphate Homeostasis in Shoots of Rice.” The Plant Journal: for Cell and Molecular Biology 62 (3): 508–517. doi:10.1111/j.1365-313X.2010.04170.x.
- Liu, T. Y., W. Y. Lin, T. K. Huang, and T. J. Chiou. 2014. “MicroRNA-mediated Surveillance of Phosphate Transporters on the Move.” Trends in Plant Science 19 (10): 647–655. doi:10.1016/j.tplants.2014.06.004.
- Liu, T. Y., T. K. Huang, S. Y. Yang, Y. T. Hong, S. M. Huang, F. N. Wang, S. F. Chiang, S. Y. Tsai, W. C. Lu, and T. J. Chiou. 2016. “Identification of Plant Vacuolar Transporters Mediating Phosphate Storage.” Nature Communications 7 (1): 11095. doi:10.1038/ncomms11095.
- Lv, S., D. Wang, P. Jiang, W. Jia, and Y. Li. 2021. “Variation of PHT Families Adapts Salt Cress to Phosphate Limitation under Salinity.” Plant, Cell & Environment 44 (5): 1549–1564. doi:10.1111/pce.14027.
- Misson, J., K. G. Raghothama, A. Jain, J. Jouhet, M. A. Block, R. Bligny, P. Ortet, et al. 2005. “A genome-wide Transcriptional Analysis Using Arabidopsis Thaliana Affymetrix Gene Chips Determined Plant Responses to Phosphate Deprivation.” Proceedings of the National Academy of Sciences 102 (33): 11934–11939. doi:10.1073/pnas.0505266102.
- Młodzińska, E., and M. Zboińska. 2016. “Phosphate Uptake and Allocation - A Closer Look at Arabidopsis Thaliana L. and Oryza Sativa L.” Frontiers in Plant Science 7: 1198. doi:10.3389/fpls.2016.01198.
- Müller, R., M. Morant, H. Jarmer, L. Nilsson, and T. H. Nielsen. 2007. “Genome-wide Analysis of the Arabidopsis Leaf Transcriptome Reveals Interaction of Phosphate and Sugar Metabolism.” Plant Physiology 143 (1): 156–171. doi:10.1104/pp.106.090167.
- Nagy, R., M. J. Vasconcelos, S. Zhao, J. McElver, W. Bruce, N. Amrhein, K. G. Raghothama, and M. Bucher. 2006. “Differential Regulation of Five Pht1 Phosphate Transporters from Maize (Zea Mays L.).” Plant Biology 8 (2): 186–197. doi:10.1055/s-2005-873052.
- Nguyen, N. H., and H. Lee. 2016. “MYB-related Transcription Factors Function as Regulators of the Circadian Clock and Anthocyanin Biosynthesis in Arabidopsis.” Plant Signaling & Behavior 11 (3): e1139278. doi:10.1080/15592324.2016.1139278.
- Nilsson, L., R. Müller, and T. H. Nielsen. 2007. “Increased Expression of the MYB-related Transcription Factor, PHR1, Leads to Enhanced Phosphate Uptake in Arabidopsis Thaliana.” Plant, Cell & Environment 30 (12): 1499–1512. doi:10.1111/j.1365-3040.2007.01734.x.
- Nussaume, L., S. Kanno, H. Javot, E. Marin, N. Pochon, A. Ayadi, T. M. Nakanishi, and M. C. Thibaud. 2011. “Phosphate Import in Plants: Focus on the PHT1 Transporters.” Frontiers in Plant Science 2: 83. doi:10.3389/fpls.2011.00083.
- Pérez‐Torres, C. A., J. López‐Bucio, A. Cruz‐Ramírez, E. Ibarra‐Laclette, S. Dharmasiri, M. Estelle, and L. Herrera‐Estrella. 2008. “Phosphate Availability Alters Lateral Root Development in Arabidopsis by Modulating Auxin Sensitivity via a Mechanism Involving the TIR1 Auxin Receptor.” The Plant Cell 20 (12): 3258–3272. doi:10.1105/tpc.108.058719.
- Poirier, Y., and J. Y. Jung. 2015. “Phosphate Transporters.” Annual Plant Reviews 48: 125–158.
- Puga, M. I., I. Mateos, R. Charukesi, Z. Wang, J. M. Franco-Zorrilla, L. de Lorenzo, M. L. Irigoyen, et al. 2014. “SPX1 Is a PHOSPHATE-dependent Inhibitor of PHOSPHATE STARVATION RESPONSE 1 in Arabidopsis.” Proceedings of the National Academy of Sciences 111 (41): 14947–14952. doi:10.1073/pnas.1404654111.
- Raghothama, K. G. 1999. “Phosphate Acquisition.” Annual Review of Plant Physiology and Plant Molecular Biology 50 (1): 665–693. doi:10.1146/annurev.arplant.50.1.665.
- Sanda, S., T. Leustek, M. J. Theisen, R. M. Garavito, and C. Benning. 2001. “Recombinant Arabidopsis SQD1 Converts UDP-glucose and Sulfite to the Sulfolipid Head Group Precursor UDP-sulfoquinovose in Vitro.” Journal of Biological Chemistry 276 (6): 3941–3946. doi:10.1074/jbc.M008200200.
- Secco, D., M. Jabnoune, H. Walker, H. Shou, P. Wu, Y. Poirier, and J. Whelan. 2013. “Spatio-temporal Transcript Profiling of Rice Roots and Shoots in Response to Phosphate Starvation and Recovery.” The Plant Cell 25 (11): 4285–4304. doi:10.1105/tpc.113.117325.
- Sega, P., and A. Pacak. 2019. “Plant PHR Transcription Factors: Put on A Map.” Genes 10 (12): 1018. doi:10.3390/genes10121018.
- Silva, D. A. D., S. M. Tsai, A. F. Chiorato, S. C. da Silva Andrade, J. A. F. Esteves, G. H. Recchia, and S. A. Morais Carbonell. 2019. “Analysis of the Common Bean (Phaseolus Vulgaris L.) Transcriptome regarding Efficiency of Phosphorus Use.” PLoS One 14 (1): e0210428. doi:10.1371/journal.pone.0210428.
- Singh, S. K., G. Badgujar, V. R. Reddy, D. H. Fleisher, and J. A. Bunce. 2013. “Carbon Dioxide Diffusion across Stomata and Mesophyll and photo-biochemical Processes as Affected by Growth CO2 and Phosphorus Nutrition in Cotton.” Journal of Plant Physiology 170 (9): 801–813. doi:10.1016/j.jplph.2013.01.001.
- Vance, C. P., C. Uhde-Stone, and D. L. Allan. 2003. “Phosphorus Acquisition and Use: Critical Adaptations by Plants for Securing a Nonrenewable Resource.” New Phytologist 157 (3): 423–447. doi:10.1046/j.1469-8137.2003.00695.x.
- Versaw, W. K., and M. J. Harrison. 2002. “A Chloroplast Phosphate Transporter, PHT2;1, Influences Allocation of Phosphate within the Plant and phosphate-starvation Responses.” The Plant Cell 14 (8): 1751–1766. doi:10.1105/tpc.002220.
- Wang, Y., D. Secco, and Y. Poirier. 2008. “Characterization of the PHO1 Gene Family and the Responses to Phosphate Deficiency of Physcomitrella Patens.” Plant Physiology 146 (2): 646–656. doi:10.1104/pp.107.108548.
- Wang, L. K., Z. X. Feng, X. Wang, X. W. Wand, and X. G. Zhang. 2010. “DEGseq: An R Package for Identifying Differentially Expressed Genes from RNA-seq Data.” Bioinformatics 26 (1): 136–138. doi:10.1093/bioinformatics/btp612.
- Wang, F., M. Deng, J. Xu, X. Zhu, and C. Mao. 2018. “Molecular Mechanisms of Phosphate Transport and Signaling in Higher Plants.” Seminars in Cell & Developmental Biology 74: 114–122. doi:10.1016/j.semcdb.2017.06.013.
- Wendel, J. F., and R. C. Cronn. 2003. “Polyploidy and the Evolutionary History of Cotton.” Advances in Agronomy 78: 139–186.
- Woo, J., C. R. MacPherson, J. Liu, H. Wang, T. Kiba, M. A. Hannah, X. J. Wang, V. B. Bajic, and N. H. Chua. 2012. “The Response and Recovery of the Arabidopsis Thaliana Transcriptome to Phosphate Starvation.” BMC Plant Biology 12 (1): 62. doi:10.1186/1471-2229-12-62.
- Yu, J., S. Jung, C. H. Cheng, S. P. Ficklin, T. Lee, P. Zheng, D. Jones, R. G. Percy, and D. Main. 2014. “CottonGen: A Genomics, Genetics and Breeding Database for Cotton Research.” Nucleic Acids Research 42 (D1): D1229–1236. doi:10.1093/nar/gkt1064.
- Zeng, H. Q., G. P. Wang, Y. Q. Zhang, X. Y. Hu, E. X. Pi, Y. Y. Zhu, H. Z. Wang, and L. Q. Du. 2016. “Genome-wide Identification of phosphate-deficiency-responsive Genes in Soybean Roots by high-throughput Sequencing.” Plant and Soil 398 (1–2): 207–227. doi:10.1007/s11104-015-2657-4.
- Zhang, Z., H. Liao, and W. J. Lucas. 2014. “Molecular Mechanisms Underlying Phosphate Sensing, Signaling, and Adaptation in Plants.” Journal of Integrative Plant Biology 56 (3): 192–220. doi:10.1111/jipb.12163.
- Zhang, Z. W., L. Y. Feng, J. H. Wang, Y. F. Fu, X. Cai, C. Q. Wang, J. B. Du, et al. 2019. “Two-factor ANOVA of SSH and RNA-seq Analysis Reveal development-associated Pi-starvation Genes in Oilseed Rape.” Planta 250 (4): 1073–1088. doi:10.1007/s00425-019-03201-7.
- Zhao, P., L. Wang, and H. Yin. 2018. “Transcriptional Responses to Phosphate Starvation in Brachypodium Distachyon Roots.” Plant Physiology and Biochemistry 122: 113–120. doi:10.1016/j.plaphy.2017.11.010.
- Zhou, J., F. Jiao, Z. Wu, Y. Li, X. Wang, X. He, W. Zhong, and P. Wu. 2008. “OsPHR2 Is Involved in Phosphate-Starvation Signaling and Excessive Phosphate Accumulation in Shoots of Plants.” Plant Physiology 146 (4): 1673–1686. doi:10.1104/pp.107.111443.
- Zhu, W., Q. Miao, D. Sun, G. Yang, C. Wu, J. Huang, and C. Zheng. 2012. “The Mitochondrial Phosphate Transporters Modulate Plant Responses to Salt Stress via Affecting ATP and Gibberellin Metabolism in Arabidopsis Thaliana.” PLoS One 7 (8): e43530. doi:10.1371/journal.pone.0043530.