
ABSTRACT
Most phosphorus is stored as phytic acid in plant seed, although it is considered an anti-nutrient compound that reduces the bioavailability of minerals in monogastric animals. Low-phytic acid (LP) crops improve mineral bioavailability in monogastric animals, which can decrease environmental pollution due to phosphorus. Recently, we reported a newly developed LP soybean line by crossing the LP line CX1834 and Japanese normal phytic acid cultivar Natto-kotsubu (Natto), which showed superior traits in seedling emergence, growth, and yield compared with CX1834. The molecular mechanism underlying the LP trait in the LP line remains unclear. The LP line was used for a de novo RNA-Seq analysis, and we illustrated the aberrant RNA splicing of the phytic acid synthase gene inositol-1,3,4 trisphosphate 5/6-kinase 3 (GmITPK3) in the LP line. The expression level of phytic acid biosynthesis-related genes and inositol phosphate isomer concentrations were investigated. A de novo RNA-Seq analysis revealed that the intron retention (IR) transcript of GmITPK3 is highly expressed in the leaves of the LP line. Although expressed in both, the relative abundances of multiple IR transcripts were significantly higher in the LP line than that in the Natto cultivar. The IR transcripts of GmITPK3 encoding truncated proteins were missing an essential domain for their activity, while one possibly contained an abnormal ligand binding site. The relative abundance of IR transcripts was 1.9- to 5.4-times higher in the LP line than that in the Natto cultivar during seed development; accordingly, the production of phytic acid and its precursors in the developing seeds was lower in the LP line than that in the Natto cultivar. No mutation was detected at the exon–intron junction, where a splicing error occurs in GmITPK3 of the LP line, implying that a splicing error is attributed to unknown splicing factor genes involved in the splicing regulation of GmITPK3. Our results provide insights into the possible involvement of splicing errors in GmITPK3 for the trait of low phytic acid production in the LP line.
1. Introduction
Phytic acid (inositol 1,2,3,4,5,6-hexakisphosphate, InsP6) is an abundant natural inositol phosphate found extensively in eukaryotes (Raboy Citation2009). In plants, phytic acid accumulates in seeds, roots, turions, tubers, and pollen (Raboy Citation2003). A portion of phosphorus (P) is translocated to developing seeds, 75% (±10%) of which is used to synthesize phytic acid (Raboy Citation2009). Monogastric animals cannot utilize phytic acid efficiently due to low phytase activity in their digestive system. Consequently, a large amount of phytic acid-derived P in animal feces is lost to arable regions, causing environmental pollution and eutrophication (Sun et al. Citation2007). Phytic acid can chelate zinc, iron, magnesium, and calcium to form phytate or phytin, which reduces the bioavailability of mineral nutrients (Raboy Citation2009). Furthermore, P feeding additives and P fertilizer are applied in the agriculture industry, which could contribute to the depletion of P sources (Lott et al. Citation2000; Cordell, Drangert, and White Citation2009). To reduce the adverse effects of phytic acid, several low-phytic acid (LP) crops, such as maize (Raboy et al. Citation2000), barley (Larson et al. Citation1998), soybean (Wilcox et al. Citation2000), wheat (Guttieri et al. Citation2004), and rice (Larson et al. Citation2000), have been developed. Nutritional surveys in humans have demonstrated that LP crops can increase the bioavailability of iron, zinc, and calcium, remarkably increase P digestibility, and reduce excreted P from feces (Mendoza et al. Citation1998; Hambidge et al. Citation2004, Citation2005; Powers et al. Citation2006; Hill, Sutton, and Richert Citation2009). However, breeding and developing crops with reduced phytic acid content in seeds is challenging as LP lines or hybrids often have lower seedling emergence and yields than their normal phytic acid counterparts (Ertl, Young, and Raboy Citation1998; Meis, Fehr, and Schnebly Citation2003; Liu et al. Citation2007).
The phytic acid biosynthetic pathway is either lipid-dependent or lipid-independent (Raboy Citation2003). In most eukaryotic cells in plants, the lipid-dependent pathway is the major route of phytic acid formation; however, the lipid-independent pathway might be more important in seeds (Raboy Citation2009). Glucose-6-phosphate is converted to myo-inositol-1-phosphate (MIP) by myo-inositol-1-phosphate synthase (MIPS) during the initial step in phytic acid biosynthesis. The lower inositol phosphate isomers Ins(3,4,6)P3 and Ins(1,4,5)P3 are subsequently phosphorylated by inositol 1,3,4 triphosphate 5/6-kinase (ITPK) and inositol 1,4,5 multiphosphate 3/6 kinase (IPK2), respectively, to Ins(1,3,4,5,6)P5. After Ins(1,3,4,5,6)P5 is converted to Ins(1,2,3,4,5,6)P6 (phytic acid) by inositol 1,3,4,5,6 pentakisphosphate 2-kinase (IPK1), phytic acid is sequestered into vacuoles by multidrug resistance protein (MRP) (Supplementary Figure 1). Introducing mutations or knockouts in the key enzyme genes involved in phytic acid biosynthesis can significantly reduce seed phytic acid content. For example, Hitz et al. (Citation2002) reported that MIPS knockout could reduce phytic acid. The downregulation of OsITPK-1 expression in rice and TaIPK1 expression in wheat reduces seed phytic acid content by approximately half (Aggarwal et al. Citation2018; Karmakar et al. Citation2020). Further, the MRP gene has been identified as a candidate for yielding low phytic acid crops (Shi et al. Citation2007; Gillman, Pantalone, and Bilyeu Citation2009).
Previously, an LP soybean line CX1834 was isolated from the EMS mutagenized population (Wilcox et al. Citation2000). However, Demers et al. (Citation2021) reported that the CX1834 line and their bred LP line had lower seedling emergence and indicated the necessity to improve the emergence trait. We previously established the Japanese domestic LP soybean line by crossing the LP line CX1834 and Japanese normal phytic acid cultivar Natto-kotsubu (Natto), and reported that the phytic acid content decreased by more than 50% in the new bred LP line compared with that in normal phytic acid soybean (Qin et al. Citation2020). This new LP line does not show poor seedling emergence and has similar, or superior, productivity and physiological characteristics to those of other commercial Japanese cultivars (Taliman et al. Citation2019) and normal-phytic acid counterpart lines obtained during the crossbreeding process (Dong et al. Citation2020; Dong and Saneoka Citation2020), suggesting our LP line as a suitable soybean line for agricultural application. During analyzing the RNA-sequencing data (RNA-Seq) in our LP line, aberrant RNA splicing was discovered in GmITPK3, which encodes the key enzyme of phytic acid synthesis, in this LP line. The GmITPK3 in the LP line did not contain any mutation at splicing sites, suggesting the presence of an unknown gene responsible for the splicing regulation of GmITPK3. Characterization of the GmITPK3 in the LP line will contribute to understanding the phytic acid metabolism in plants and may provide a foundation for developing low phytate crops.
2. Materials and methods
2.1. Plant materials
A parent cultivar Natto-kotsubu (Natto), as well as NP and LP lines of soybean [Glycine max (L.) Merrill] were used in this study. The NP and LP lines were generated in August 2004 by crossing the LP soybean mutant CX1834 (Wilcox et al. Citation2000) with a Japanese commercial cultivar widely grown in western Japan. The CX1834 was obtained from the National Small Grains Germplasm Research Center, Agricultural Research Service (USDA), Aberdeen, Idaho, which was isolated from M153 (Wilcox et al. Citation2000) after chemical mutagenesis. During the summer of 2005, the parental and F1 progeny were grown in an experimental field at the Graduate School of Biosphere Science, Hiroshima University, Higashi-Hiroshima, Japan. The NP and LP lines were then selected by determining the annual inorganic, phytic acid, and total phosphorus contents. The seeds of NP and LP lines from the F12 progeny and the parent Natto cultivar were used for this study, and the proportions of phytic acid P and inorganic P were previously reported (Qin et al. Citation2020).
2.2. RNA isolation and RNA-Seq
The LP and NP lines and Natto cultivar were sown in pots containing vermiculite, and three plants were cultivated in every pot. Plants were constantly supplied with nutrient solution (OAT house numbers 1 and 2; OAT Agrio Co., Ltd., Japan) and grown in a greenhouse under natural light. The final concentration of minerals in the nutrient solution was N: 260 ppm, P2O5: 120 ppm, K2O: 405 ppm, CaO: 230, MgO: 60 ppm, MnO: 1.5 ppm, B2O3: 1.5 ppm, Fe: 2.7 ppm, Cu: 0.03 ppm, Zn: 0.09 ppm, and Mo: 0.03 ppm. The leaves of 21-day-old plants for RNA-Seq were removed, immediately frozen in liquid nitrogen, and stored at −80°C. Four plant samples were pooled into two biological replicates for each line or cultivar. Total RNA was extracted from frozen leaves using a FavoPrep Plant Total RNA Mini Kit (Favorgen Biotech Co., Taiwan), treated with DNase I (Takara Bio Inc., Japan), and cleaned using RNAClean XP (Beckman Coulter Inc., USA). The quality of RNA samples was determined using a spectrophotometer and BioAnalyzer (Agilent Technologies Inc., USA). The isolation of poly-A mRNA and construction of cDNA libraries for strand-specific RNA-Seq were performed using the NEBNext Poly(A) mRNA Magnetic Isolation Module and NEBnext Ultra RNA Library Prep Kit for Illumina (New England Biolabs Inc.), respectively. Libraries were sequenced using 150-bp paired ends on the NovaSeq platform (Illumina Inc.). Raw sequence data were cleaned using Trimmomatic 0.32 (http://www.usadellab.org/cms/?page=trimmomatic) with the following default parameter settings: ILLUMINACLIP: adapters/TruSeq3-PE.fa: 2:30:10, LEADING: 3, TRAILING: 3, SLIDINGWINDOW: 4:15, and MINLEN: 36. The RNA-Seq reads were aligned with Glycine max (v2.1). The reference genome sequence (FASTA file) and gene annotation data (GTF file) of soybean (Glycine max v2.1) were downloaded from the Ensembl server (https://plants.ensembl.org/Glycine_max/Info/Index). Sequence reads were mapped to the reference genome using TOPHAT 2.0.11 (Kim et al. Citation2013). This step was performed independently for each biological replicate.
2.3. Identification and quantification of splicing variant of GmITPK3 using RNA-Seq data
The detailed procedure for the identification and quantification of mRNA transcripts containing an unannotated exon-exon structure has been described earlier (Nishida et al. Citation2017). A single read alignment file was constructed using libraries of biological replicates for each genotype and used for transcript assembly using CUFFLINKS 2.2.1, with the following parameters: -min-isoform-fraction/-F = 0.1, -pre-mrna-fraction/-j = 0, and -no-length-correlation (Trapnell et al. Citation2010). The resulting three output files and the reference GTF file were merged into a single transcriptome file using CUFFCOMPARE (with the C option for output of all reference transcripts) in the CUFFLINKS package. Quantification of transcript abundance in each library was performed using CUFFQUANT (with no length correlation) in the CUFFLINKS package. Library normalization across six libraries (three genotypes × two biological replicates) was performed using the R package edgeR 3.20.9 (McCarthy, Chen, and Smyth Citation2012) and a 0.01 CPM value, which was less than one-tenth of the minimum CPM value. Relative abundance values, which represent the proportion (%) of each mRNA transcript, were then calculated for GmITPK3.
2.4. Sequencing the genomic DNA and splicing variants of GmITPK3
DNA was extracted from young leaves using a DNeasy Plant Mini Kit (QIAGEN) following the manufacturer’s protocol. The GmITPK3 fragment was then cloned from genomic DNA using oligonucleotide primers (5′-ACATTTCCCTTGAGCTTCTAT-3′ and 5′-TCTACA GCTCAGCATCACAT-3′), DNA polymerase (KOD Plus Neo; TOYOBO Co., Ltd.), and a thermal cycler (Takara Bio Inc.) via PCR. Successfully amplified GmITPK3 products were evaluated using a 0.8% agarose gel and were sequenced at Eurofins Genomics (Tokyo, Japan). Total RNA was extracted from frozen younger leaves using the RNeasy Plant Mini Kit (QIAGEN), and genomic DNA was digested using an RNase-Free DNase Set (QIAGEN) following the manufacturer’s instructions. The quality and quantity of RNA samples were determined using a spectrophotometer (Thermo Scientific). Then, cDNA was synthesized from total RNA using PrimeScript™ RT Master Mix (Takara Bio Inc., Japan), and the alternative spliced region (exons 5 to 7) of GmITPK3 was amplified from cDNA using oligonucleotide primers (5′- AATGAAAACCGCCTAACGAC-3′ and 5′- AGAGAGACGCATTAGCCATC-3′) via PCR. The amplified products were evaluated on a 2% agarose gel. Multiple splice variants were extracted from the agarose gel using the QIAquick Gel Extraction Kit (QIAGEN) and were sequenced at Eurofins Genomics.
2.5. Prediction of protein primary structure and enzymatic active site
The amino acid sequences encoded by GmITPK3 splicing variants were predicted using the Expasy amino acid translate tool (https://web.expasy.org/translate/). The amino acid sequences were imported into the FunFold2 server (Roche, Buenavista, and McGuffin Citation2013) (http://www.reading.ac.uk/bioinf/FunFOLD/) for binding site prediction and ligand binding residue analysis.
2.6. Determination of gene expression and proportions of GmITPK3 splicing variants in developing seeds
Seeds of the LP line and Natto cultivar were sown in pots containing soil (sand: vermiculite = 1:1) and three plants were cultivated in every pot. The plants were constantly applied with nutrient solution (OAT house numbers 1 and 2; OAT Agrio Co., Ltd.) and grown in a greenhouse under natural light. Nutrient solution was applied once a week during the vegetative stage and every two days during the reproductive stages. The leaves of 21-day-old plants at the vegetative stage were sampled in triplicates (three to five leaves per replicate). During the reproductive stages, the developing seeds between beginning seed stage and beginning maturity stage were sampled in triplicates and separated based on the seed lengths as follows: 2–4 mm (ten seeds/replicate), 4–6 mm (ten seeds/replicate), 6–8 mm (ten seeds/replicate), 8–10 mm (five seeds/replicate), 10–12 mm (five seeds/replicate), and 12–14 mm (three seeds/replicate). The leaves of 21-days-old plants and developing seeds were immediately frozen in liquid nitrogen and stored at −80°C. Total RNA was extracted using the RNeasy Plant Mini Kit (QIAGEN) and cDNA was synthesized from total RNA using the PrimeScript™ RT Master Mix (Takara Bio Inc., Japan) following the manufacturer’s protocol. The quality and quantity of the RNA samples were determined using a spectrophotometer (Thermo Scientific). The primer pairs used for qRT-PCR are listed in Supplementary Table 1, and the β‒tubulin gene (Glyma.15G132200; Gene ID: 547,917) was used as an internal control. qRT-PCR analysis was performed using 0.5 μg of cDNA, THUNDERBIRD® Next SYBR® qPCR Mix (TOYOBO Co., Ltd., Japan), and the StepOne™ Applied Biosystems (Thermo Scientific), following the manufacturers’ protocol. The qRT-PCR thermal cycling conditions were as follows: 95°C for 60s followed by 40 cycles of 95°C for 15s, 58°C for 15s, and 72°C for 60s.
To determine the proportion of each splice variant of GmITPK3 in the developing seeds, the alternative spliced region (exons 5 to 7) was amplified from cDNA using the primers mentioned previously. PCR was performed using 0.1 μg of cDNA from each stage of seed development, DNA polymerase (KOD One PCR Master Mix, TOYOBO Co., Ltd., Japan), and a thermal cycler (Takara Bio Inc., Japan). The amplified products were evaluated using electrophoresis on a 2% agarose gel, and the gel images were recorded using a gel imaging system (ATTO Co., Ltd., Japan). The relative abundance (%) of each splice variant was calculated using the gel analysis function in ImageJ (https://imagej.nih.gov/ij/).
2.7. Inositol phosphate isomer concentration determination in developing seeds
The polyacrylamide gel electrophoresis method was used to determine the inositol phosphate isomer content of developing seeds (Raboy et al. Citation2020). The developing seeds from 2–4 mm to 12–14 mm and mature seeds were dried using a vacuum freeze dryer (TOKYO RIKAKIKAI Co., Ltd., Japan). The dried samples were ground in a 1.5 mL microtube using a micro grinder (TOMY MEDICO Ltd., Japan). Aliquots of the samples (approx. 100 mg) were extracted using 1 mL 0.2 M HCl (5% Na2SO4) for 16 h at 4°C with shaking. The resulting mixture was centrifuged at 12,000 × g for 20 min at 4°C. The supernatant was stored at −20°C until further analysis. Aliquots (20 μL) of the supernatant were mixed with 5 μL of 6 × Loading Buffer Orange G (NIPPON GENE Co., Ltd., Japan), and samples were fractionated on a 34% polyacrylamide gel (20 × 20 × 0.15 cm; 42.4 mL 40% acrylamide/bis-acrylamide (19:1); 5 mL 10 × TBE buffer; 1.72 mL ddH2O; 451 μL 10% APS; 49 μL TEMED) in 0.5 × TBE buffer using the PROTEAN® II xi Cell (BIO-RAD). The gel was pre-run for 30 min at 300 V at 4°C. After sample loading, the gel was run at 300 V at 4°C for 18‒22 h until the orange G had migrated for 7‒8 cm. The gel was then stained with toluidine blue solution (20% methanol, 2% glycerol, and 0.05% toluidine blue) for 30 min and then de-stained for 30 min with two changes of the washing solution (20% methanol and 2% glycerol). Gel images were captured in white light and recorded using a gel imaging system (ATTO Co., Ltd.). The following standards were used for inositol phosphate isomers: 10 μg/μL IP6 prepared using phytic acid sodium salt hydrate from rice or IP6 (Sigma); 0.5 μg/μL D-myo-inositol 1,3,4,5,6-pentakisphosphate pentapotassium salt or IP5 (ChemCruz); 0.5 μg/μL D-myo-inositol-1,3,4,5-tetraphosphate sodium salt or IP4 (Cayman); and 1 μg/μL D-myo-inositol-1,4,5-triphosphate sodium salt or IP3 (Cayman). The sample bands were identified by comparing them with the standards, and the amount of inositol phosphate isomers on the gel was calculated using the gel analysis function in ImageJ.
2.8. Data availability
The RNA-Seq raw data used in this study have been submitted to the NCBI Sequence Reach Archive (SRA), and are available under the SRA accession number PRJNA802889 (https://www.ncbi.nlm.nih.gov/bioproject/PRJNA802889/).
2.9. Statistical analysis
All statistical analyses were performed using SPSS version 21 (IBM Inc., Chicago, IL, USA). Tukey’s test and a Student’s t-test were used to identify significant differences (p < 0.05).
3. Results
3.1. Discovery of aberrant splicing of GmITPK3 in a low-phytic acid line by RNA-Seq
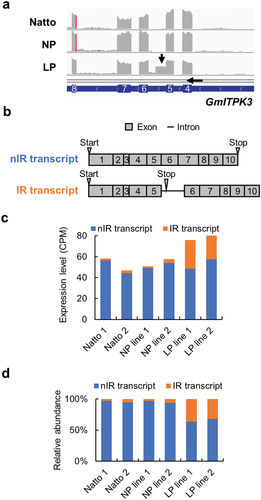
To determine the mechanism underlying the reduction in the phytic acid levels in our LP line, the LP line and two normal phytic acid content soybeans, Natto-kotsubu (Natto) cultivar and normal-phytic acid counterpart (NP) line obtained during the crossbreeding process (Dong et al. Citation2020), were grown for 21 days; young leaves were used for RNA-Seq analysis (Novaseq 6000). The spliced read alignments of phytic acid biosynthesis related genes in Natto cultivar, NP, and LP lines were visualized using the Integrated Genome Viewer (IGV) browser (Supplementary Figure 2). A splicing error was detected between exons 5 and 6 in GmITPK3 (Glyma.06G089800) of the LP line compared with those in the reference transcript (). Then, de novo transcriptome assembly was performed to detect the splicing variant of GmITPK3 expressed in the LP line. An intron retention transcript of GmITPK3 was assembled in LP line in addition to the non-intron retention (nIR) transcript (). The expression level and relative abundance of IR transcript level were higher in the leaves of the LP line than in those of the other two control lines ().
Figure 1. Characterization of the intron retention transcript of GmITPK3. (a) Alignment of RNA-Seq short reads on the GmITPK3 of Natto-kotsubu (Natto) cultivar, normal-phytic acid (NP) line, and low-phytic acid (LP) line. Splicing error between exons 5 and 6 in GmITPK3 of LP line is indicated by an arrow. (b) Transcripts of the non-intron retention (nIR) and intron retention (IR). Gray boxes indicate the exon; thick black lines indicate introns; number indicates the exon number; triangles indicate the positions of in-frame start and stop codons. (c) Expression level (CPM) of the nIR and IR splicing transcript of Natto cultivar, NP line, and LP line leaves. (d) Relative abundance of the nIR and IR splicing transcript of Natto cultivar, NP line, and LP line leaves.
The IR transcript was predicted to have a stop codon in the retaining intron between exons 5 and 6 and encode a truncated protein missing by 155 amino acid residues (; Supplementary Figure 3). The genomic sequences of GmITPK3 in Natto cultivar, NP line, and LP line were determined via Sanger sequencing. No nonsynonymous single nucleotide polymorphism was observed in the genomic GmITPK3 exon region of the LP line compared with that in the Natto cultivar and NP line (Supplementary Figure 4a), and no mutation was found at the junctions between exons 5 and 6 and the intron (Supplementary Figure 5).
The splicing pattern of GmITPK3 in the LP line was further investigated using semi quantitative PCR, with the primer pairs shown in . The PCR amplification of exons 5–7 of GmITPK3 from the cDNA of leaves revealed three splicing variants in the Natto cultivar and NP line, and four variants in the LP line ( and Supplementary Figure 6). The IR transcripts from LP line were named LP‒IR1, LP‒IR2, and LP‒IR3, while the IR transcripts from Natto cultivar were named Natto‒IR1 and Natto‒IR2. The abundance of the nIR transcript was obviously lower in the LP line than that in the other two control lines, and the abundances of IR2 and IR3 accordingly increased in the LP line ().
Figure 2. Alternative splicing at the region of exons 5–7 of GmITPK3. (a) Location of primers hybridized for detecting the alternative splicing. (b) Intron retention (IR) transcripts and non-intron retention (nIR) transcripts amplified from cDNA of the Natto-kotsubu (Natto) cultivar, normal phytic acid (NP) line, and low-phytic acid (LP) line leaves (at 27, 31, and 35 cycles of PCR). (c) Schematic representation showing the splicing variants at the region between exons 5‒7 of GmITPK3 according to the cDNA sequencing analysis. The Natto cultivar and NP line gave rise to three transcripts (Natto-IR1, Natto-IR2, and Natto-nIR), whereas LP line showed four transcripts (LP-IR1, LP-IR2, LP-IR3, and LP-nIR). (d) PyMOL generated image of ligand binding residues of each splice variant in the Natto cultivar and LP line predicted by FunFold Server 2. No binding sites were predicted in GmITPK3 translated from Natto-IR1, Natto-IR2, LP-IR1, and LP-IR3. The most likely predicted ligand type of GmITPK3 translated from nIR in the Natto cultivar and LP line was ADP (indicated by red arrow), displaying the ligand binding residues E217, F218, V219, and I321. Meanwhile, the most likely ligand type of truncated protein translated from LP-IR2 was ADP-dependent (indicated by red arrow) and contained F215 as a ligand binding residue. Gray boxes, thick black lines, and numbers indicate exons, retained introns, and exon number, respectively.
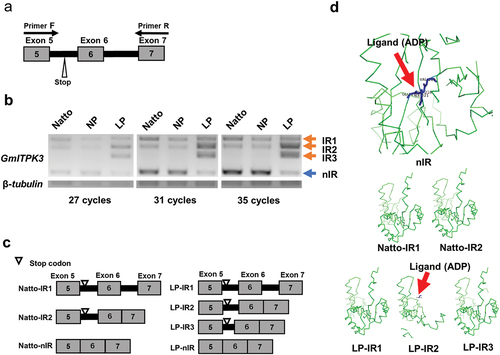
To investigate the exon and intron constituents of each transcript in GmITPK3, each PCR product was extracted from the gel and sequenced. The splicing pattern based on the sequencing data (Supplementary Figure 4b) is shown in . The IR transcript assembled in the RNA-Seq analysis corresponded to LP-IR1. As all IR transcripts contained a stop codon between exon 5 and 6, IR transcripts were predicted to encode shorter amino acid sequences than nIR transcripts (354 aa). According to Krishnan et al. (Citation2019), the most conserved ligand in GmITPKs is ADP. The prediction of ligand binding sites showed that the GmITPK3 protein encoded by the nIR transcript contained E217, F218, V219, and I321 as ADP binding residues (). The ligand binding structure was missing in truncated proteins translated from Natto‒IR1, Natto‒IR2, LP‒IR1, and LP‒IR3 (). The truncated protein translated from LP-IR2 was predicted to have an abnormal ADP biding site at F215 ().
3.2. Splicing pattern of GmITPK3 during seed development
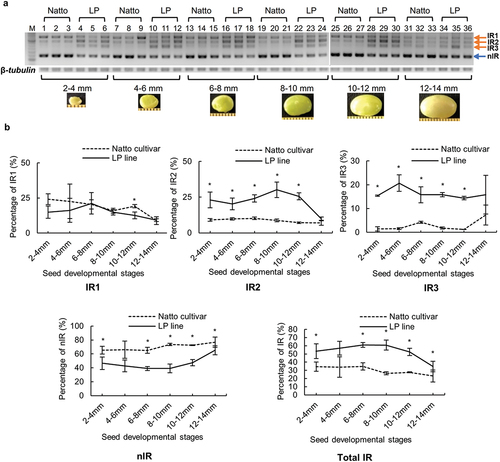
The spicing pattern of GmITPK3 in developing seeds was investigated in different developmental stages. The splicing pattern showed that both the Natto cultivar and LP line had four splice variants (). Regarding the percentage of each splice variant, IR1 showed no significant difference between the LP line and Natto cultivar in all stages of seed development except in 10‒12 mm developing seeds (). The percentage of IR2 in the LP line was 1.4 to 3.6 times higher than that in the Natto cultivar and showed a significant difference from 2‒4 mm to 10‒12 mm developing seeds. The percentage of IR3 in the LP line was 2.2–13.3 times higher than that in the Natto cultivar and showed a significant difference in all development stages except in 12‒14 mm developing seeds. The total IR and nIR transcripts were constantly higher and lower, respectively, in the LP line than in the Natto cultivar during seed development. The percentage of total IR transcripts changed from 23% to 35% in Natto cultivar and from 35% to 61% in the LP line. A decrease in total IR in the LP line was caused by the reduction of IR2 at the mature stage of seed development.
Figure 3. Splicing pattern of GmITPK3 during seed development of the Natto-kotsubu (Natto) cultivar and low-phytic acid (LP) line. (a) Visualization of splicing pattern of developing seed samples in 2% agarose gel. Lane nos. 1‒6 (2‒4 mm), 7‒12 (4‒6 mm), 13‒18 (6‒8 mm), 19‒24 (8‒10 mm), 25‒30 (10‒12 mm), and 31‒36 (12‒14 mm). Each seed length was investigated in triplicate. M indicates the molecular weight marker (50-bp ladder). There were three intron retention transcripts (IR1, IR2, and IR3) and non-intron retention (nIR) in both the Natto cultivar and LP line. (b) The percentage of each transcript in the same lane was calculated from the gel band using ImageJ. The total IR indicate the sum of IR1, IR2, and IR3. Values are presented as means of triplicates and error bars indicate standard deviation. Asterisk indicates significance at p ˂ 0.05 based on the Student’s t-test between the Natto cultivar and LP line at the same seed length.
3.3. Expression profiling of phytic acid biosynthesis-related genes during seed development
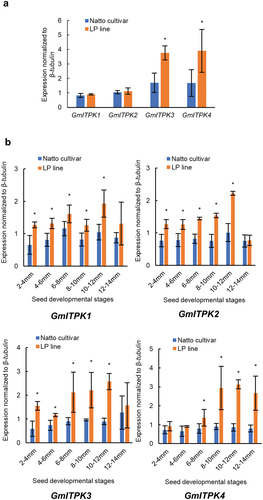
To investigate the effect of splicing errors of GmITPK3 on the expression of genes involved in phytic acid biosynthesis and storage, the expression levels of ITPKs, MIPS, IPKs, and MRPs were determined in the LP line and Natto cultivar. Soybean has four GmITPKs family genes, namely GmITPK1, GmITPK2, GmITPK3, and GmITPK4. The hybridization sites of the qRT-PCR primers developed to amplify GmITPK1, 2, 3 and 4 shown in Supplementary Figure 7. The expression levels of GmITPK1 and GmITPK2 in the leaves did not differ between the LP line and Natto cultivar; however, both GmITPK3 and GmITPK4 were two-fold higher in the LP line than in the Natto cultivar (). In the developing seed, when the seed length was shorter than 12‒14 mm, GmITPK1, GmITPK2, and GmITPK3 expression levels in the LP line were significantly higher than those in the Natto cultivar. (). GmITPK4 expression increased significantly in the developing seeds of the LP line at 6‒8 mm compared with those in the Natto cultivar. Regarding the expression profiles of other phytic acid biosynthesis-related genes, GmMIPS, GmIPK1, and GmIPK2 showed no specific changes with seed development (Supplementary Figure 8). The vacuole phytic acid transporter gene, GmMRP3 (Glyma.03g167800; GeneID: 100790550), was significantly downregulated in the LP line seeds, except for those at 12‒14 mm, compared with the Natto cultivar (Supplementary Figure 8). However, the homologous genes GmMRP19 (Glyma.19g169000; GeneID: 100814850) and 13 (Glyma.13g127500; GeneID: 100781010) showed a similar or higher expression level in the LP line compared with that in the Natto cultivar during seed development.
Figure 4. Gene expression level of the inositol 1,3,4 triphosphate 5/6-kinase (GmITPK) family in (a) 21-day leaves and (b) during seed development of the Natto-kotsubu (Natto) cultivar and low-phytic acid (LP) line. Values are presented as the means of triplicates, and error bars indicate standard deviations. Asterisk indicates significance at p ˂ 0.05 based on the Student’s t-test between the Natto cultivar and LP line at the same seed length.
3.4. Inositol phosphate isomer concentrations in developing seeds
To investigate the relationship between the splicing errors of GmITPK3 and lower accumulation of phytic acid in the LP line, the concentrations of phosphate isomers, namely InsP3, InsP4, InsP5, and InsP6, were determined in developing and mature seeds via polyacrylamide gel electrophoresis. The concentrations of the phosphate isomers were lower in the LP line than those in the Natto cultivar at almost all seed developmental stages (). Significant differences were observed in InsP5 and InsP6 at the final seed developmental stages: the concentrations of InsP5 and InsP6 in the LP line were less than half of those in the Natto cultivar, suggesting that the biosynthesis of InsP5 is mediated by ITPKs, and the downstream isomer InsP6 is disrupted in the LP line.
Figure 5. Concentrations of inositol phosphate isomers (InsP6, InsP5, InsP4, and InsP3) during seed development in the Natto-kotsubu (Natto) cultivar and low-phytic acid (LP) line. Values are presented as the means of triplicates, and error bars indicate standard deviations. Asterisk indicates significance at p ˂ 0.05 based on the Student’s t-test between the Natto cultivar and LP line at the same seed length.
4. Discussion
ITPKs are essential enzymes for phytic acid biosynthesis; hence, the loss-of-function of ITPKs reduces phytic acid accumulation in plants (Karmakar et al. Citation2020). Among GmITPKs, GmITPK3 is most abundantly expressed in seeds (Stiles et al. Citation2008). This study illustrated that a splicing error occurs in the region between exons 5 and 6 of GmITPK3 in the LP line, probably inherited from the parent LP line CX1834. No investigation was conducted for the splicing pattern of GmITPK3 in CX1834 in this study as we did not have access to CX1834. Further analyses showed that both normal and low-phytic acid lines expressed the IR transcripts of GmITPK3. However, the relative abundance of IR transcripts was significantly higher in the LP line than that in the Natto cultivar. The resulting IR transcripts of GmITPK3 encoding the truncated proteins were missing the essential domain for its activity. We assume that the increased IR transcripts of GmITPK3 are involved in the reduction of phytic acid in the LP line.
Expression levels of GmITPKs, including GmITPK3 in developing seeds, were significantly higher in the LP line than those in the Natto cultivar. The increased expression of GmITPKs in the LP line may partially compensate for the reduction in phytic acid biosynthesis activity. In accordance with the increased expression of GmITPK3, the abundance of nIR transcripts of GmITPK3 in the LP line increased to the same level with or higher level than that in the Natto cultivar in seeds (, Supplementary Figure 9). Nevertheless, the accumulation of InsP isomers was not elevated in the LP line. One possible hypothesis is that the abundant IR transcripts of GmITPK3 negatively affect phytic acid biosynthesis in the LP line. Generally, IR transcripts rapidly degrade via nonsense-mediated decay; however, some IR transcripts encode protein isoforms and serve as competing endogenous factors (Vanichkina et al. Citation2018). In rats, an IR transcript produced from an inositol-3-phosphate synthase gene has been shown to encode a small subunit and negatively modulate the normal subunit activity, possibly by competing for NAD+ molecules (Seelan et al. Citation2009). A truncated protein encoded by the IR2 of GmITPK3 was predicted to have an abnormal ligand (ADP) biding site. We assume that the truncated protein translated form the IR transcripts of GmITPK3, especially the IR2, inhibits phytic acid biosynthesis by competing with the functional ITPK proteins.
In the LP line, the IR2 of GmITPK3 decreased at the mature stage; accordingly, InsP5 and InsP6 levels were elevated compared with those in the immature stages, supporting our assumption above. Nonetheless, how IR transcripts affect phytic acid biosynthesis remains to be determined.
In many cases, a splicing error in a gene is caused by a mutation at an exon-intron junction. A previous study reported that a mutation at the exon-intron junction of GmIPK1 induces a splicing error that disrupts the IPK1 function and decreases the phytic acid level in soybeans (Yuan et al. Citation2012). Meanwhile, in our LP line, the exon–intron junctions between exons 5 and 6 of GmITPK3 did not harbor any mutation, suggesting that the splicing error was not caused by a mutation in GmITPK3, but rather caused by a mutation in an unknown splicing factor gene. In addition, the decrease in the IR2 level and increase in nIR level in the mature seeds of the LP line suggest another splicing factor. Alternative splicing has also been observed in the IPK1 (ZmIPK1) of a wild-type maize plant (Sun et al. Citation2007). The splicing pattern of ZmIPK1 is altered in a tissue-dependent manner, and the splicing regulation of ZmIPK1 may control the phytic acid biosynthesis activity in each tissue. Lu et al. (Citation2016) also reported that the splicing variants of OsLpa1, which is involved in phytic acid biosynthesis, were expressed differentially in tissue- and development-dependent manners in the wild-type rice plant. An unknown splicing factor might regulate the abundances of IR transcripts of phytic acid biosynthesis genes and adjust the production of phytic acid during plant grown and seed development. Elucidating the cause of the splicing error of GmITPK3 in the LP line could explain how alternative splicing controls phytic acid biosynthesis.
There are three homologs of vacuole phytic acid transporter genes, GmMRP3, GmMRP13, and GmMRP19 in the soybean genome (Panzeri et al. Citation2011; Sparvoli and Cominelli Citation2015), which share a high degree of homology (93% between GmMRP3 and GmMRP19, and 86% between GmMRP13 and GmMRP19) (Panzeri et al. Citation2011). CX1834 has mutations in GmMRP3 (R894STOP) and GmMRP19 (R1039K), which have been considered as candidates causing the reduction in the phytic acid level in CX1834 (Gillman, Pantalone, and Bilyeu Citation2009). We confirmed that the mutations in GmMRP3 and GmMRP19 were inherited by our LP line (Supplementary Figure 10). However, the expression level of GmMRP3 decreased in the LP line, and instead the expression of GmMRP13 was elevated. Gene redundancy in GmMRPs might partially compensate for the mutations of the homologs. We suggest that the splicing error in GmITPK3 should be considered as an additional contributor to the low phytic acid trait in the LP line.
Supplemental Material
Download MS Word (987.6 KB)Acknowledgments
The authors would like to thank Mrs. Hosokawa T., Masaoka K., Yorizane H., Natsume Y., Futamura Y. Okamoto Y., Wakabayashi K. Ms. Fukuda Y., Tatsukawa E., Kakizawa H., Kumagai M. Hara Y., and Ogawa M. for their contribution in breeding low-phytic acid soybean lines.
Disclosure statement
No potential conflict of interest was reported by the author(s)
Supplementary material
Supplemental data for this article can be accessed online at https://doi.org/10.1080/00380768.2022.2111191
Additional information
Funding
References
- Aggarwal, S., A. Kumar, K. K. Bhati, G. Kaur, V. Shukla, S. Tiwari, and A. K. Pandey. 2018. “RNAi-mediated Downregulation of Inositol Pentakisphosphate Kinase (IPK1) in Wheat Grains Decreases Phytic Acid Levels and Increases Fe and Zn Accumulation.” Frontiers in Plant Science 9: 259. doi:10.3389/fpls.2018.00259.
- Cordell, D., J.-O. Drangert, and S. White. 2009. “The Story of Phosphorus: Global Food Security and Food for Thought.” Global Environmental Change 19 (2): 292–305. doi:10.1016/j.gloenvcha.2008.10.009.
- Demers, L. C., V. Raboy, S. Li, and M. A. Saghai Maroof. 2021. “Network Inference of Transcriptional Regulation in Germinating Low Phytic Acid Soybean Seeds.” Frontiers in Plant Science 12: 708286. doi:10.3389/fpls.2021.708286.
- Dong, Q., K. Echigo, V. Raboy, and H. Saneoka. 2020. “Seedling Growth, Physiological Characteristics, Nitrogen Fixation, and Root and Nodule Phytase and Phosphatase Activity of a low-phytate Soybean Line.” Plant Physiology and Biochemistry 149: 225–232. doi:10.1016/j.plaphy.2020.02.015.
- Dong, Q., and H. Saneoka. 2020. “Physiological Characteristics, Phytase Activity, and Mineral Bioavailability of a low-phytate Soybean Line during Germination.” Plant Foods for Human Nutrition 75 (3): 383–389. doi:10.1007/s11130-020-00827-x.
- Ertl, D., K. Young, and V. Raboy. 1998. “Plant Genetic Approaches to Phosphorus Management in Agricultural Production.” Journal of Environmental Quality 27 (2): 299–304. doi:10.2134/JEQ1998.00472425002700020008X.
- Gillman, J. D., V. R. Pantalone, and K. Bilyeu. 2009. “The Low Phytic Acid Phenotype in Soybean Line CX1834 Is Due to Mutations in Two Homologs of the Maize Low Phytic Acid Gene.” The Plant Genome 2 (2): 179–190. doi:10.3835/plantgenome2008.03.0013.
- Guttieri, M., D. Bowen, J. A. Dorsch, V. Raboy, and E. Souza. 2004. “Identification and Characterization of a Low Phytic Acid Wheat.” Crop Science 44: 418–424. doi:10.2135/cropsci2004.4180.
- Hambidge, K. M., J. W. Huffer, V. Raboy, G. K. Grunwald, J. L. Westcott, L. Sian, L. V. Miller, J. A. Dorsch, and N. F. Krebs. 2004. “Zinc Absorption from low-phytate Hybrids of Maize and Their wild-type Isohybrids.” The American Journal of Clinical Nutrition 79 (6): 1053–1059. doi:10.1093/ajcn/79.6.1053.
- Hambidge, K. M., N. F. Krebs, J. L. Westcott, L. Sian, L. V. Miller, K. L. Peterson, and V. Raboy. 2005. “Absorption of Calcium from Tortilla Meals Prepared from low-phytate Maize.” The American Journal of Clinical Nutrition 82 (1): 84–87. doi:10.1093/ajcn.82.1.84.
- Hill, B. E., A. L. Sutton, and B. T. Richert. 2009. “Effects of low-phytic Acid Corn, low-phytic Acid Soybean Meal, and Phytase on Nutrient Digestibility and Excretion in Growing Pigs.” Journal of Animal Science 87 (4): 1518–1527. doi:10.2527/jas.2008-1219.
- Hitz, W. D., T. J. Carlson, P. S. Kerr, and S. A. Sebastian. 2002. “Biochemical and Molecular Characterization of a Mutation that Confers a Decreased Raffinosaccharide and Phytic Acid Phenotype on Soybean Seeds.” Plant Physiology 128 (2): 650–660. doi:10.1104/pp.010585.
- Karmakar, A., S. Bhattacharya, S. Sengupta, N. Ali, S. N. Sarkar, K. Datta, and S. K. Datta. 2020. “RNAi-mediated Silencing of ITPK Gene Reduces Phytic Acid Content, Alters Transcripts of Phytic Acid Biosynthetic Genes, and Modulates Mineral Distribution in Rice Seeds.” Rice Science 27 (4): 315–328. doi:10.1016/j.rsci.2020.05.007.
- Kim, D., G. Pertea, C. Trapnell, H. Pimentel, R. Kelley, and S. L. Salzberg. 2013. “TopHat2: Accurate Alignment of Transcriptomes in the Presence of Insertions, Deletions and Gene Fusions.” Genome Biology 14 (4): 1–13. doi:10.1186/gb-2013-14-4-r36.
- Krishnan, V., A. Hada, A. Marathe, B. K. Palaka, D. R. Ampasala, S. Praveen, M. Manickavasagam, and A. Sachdev. 2019. “Functional Characterization of Gm ITPK (myo-inositol: 1, 3, 4 Tris Phosphate 5/6 Kinase) Isoforms—‘so Different yet so Similar.’” Journal of Plant Biochemistry and Biotechnology 28 (4): 389–396. doi:10.1007/s13205-017-1076-z.
- Larson, S. R., J. N. Rutger, K. A. Young, and V. Raboy. 2000. “Isolation and Genetic Mapping of a non-lethal Rice (Oryza Sativa L.) Low Phytic Acid 1 Mutation.” Crop Science 40 (5): 1397–1405. doi:10.2135/cropsci2000.4051397x.
- Larson, S. R., K. A. Young, A. Cook, T. K. Blake, and V. Raboy. 1998. “Linkage Mapping of Two Mutations that Reduce Phytic Acid Content of Barley Grain.” Theoretical and Applied Genetic 97 (1): 141–146. doi:10.1007/s001220050878.
- Liu, Q.-L., X.-H. Xu, X.-L. Ren, H.-W. Fu, D.-X. Wu, and Q.-Y. Shu. 2007. “Generation and Characterization of Low Phytic Acid Germplasm in Rice (Oryza Sativa L.).” Theoretical and Applied Geneti 114 (5): 803–814. doi:10.1007/s00122-006-0478-9.
- Lott, J. N., I. Ockenden, V. Raboy, and G. D. Batten. 2000. “Phytic Acid and Phosphorus in Crop Seeds and Fruits: A Global Estimate.” Seed Science Research 10: 11–33. doi:10.1017/S0960258500000039.
- Lu, H. P., W. Q. Pang, W. X. Li, Y. Y. Tan, Q. Wang, H. J. Zhao, and Q. Y. Shu. 2016. “Tissue-specific Expression, Developmentally and Spatially Regulated Alternative Splicing, and Protein Subcellular Localization of OsLpa Rice.” Journal of Zhejiang University-SCIENCE B 17 (2): 100–109. doi:10.1631/jzus.B1500205.
- McCarthy, D. J., Y. Chen, and G. K. Smyth. 2012. “Differential Expression Analysis of Multifactor RNA-Seq Experiments with respect to Biological Variation.” Nucleic Acids Research 40 (10): 4288–4297. doi:10.1093/nar/gks042.
- Meis, S. J., W. R. Fehr, and S. R. Schnebly. 2003. “Seed Source Effect on Field Emergence of Soybean Lines with Reduced Phytate and Raffinose Saccharides.” Crop Science 43 (4): 1336–1339. doi:10.2135/cropsci2003.1336.
- Mendoza, C., F. E. Viteri, B. Lönnerdal, K. A. Young, V. Raboy, and K. H. Brown. 1998. “Effect of Genetically Modified, low-phytic Acid Maize on Absorption of Iron from Tortillas.” The American Journal of Clinical Nutrition 68 (5): 1123–1127. doi:10.1093/ajcn/68.5.1123.
- Nishida, S., Y. Kakei, Y. Shimada, and T. Fujiwara. 2017. “Genome‐wide Analysis of Specific Alterations in Transcript Structure and Accumulation Caused by Nutrient Deficiencies in Arabidopsis Thaliana.” The Plant Journal 91 (4): 741–753. doi:10.1111/tpj.13606.
- Panzeri, D., E. Cassani, E. Doria, G. Tagliabue, L. Forti, B. Campion, R. Bollini, et al. 2011. “A Defective ABC Transporter of the MRP Family, Responsible for the Bean lpa1 Mutation, Affects the Regulation of the Phytic Acid Pathway, Reduces Seed myo-inositol and Alters ABA Sensitivity.” New Phytologist 191 (1): 70–83. doi:10.1111/j.1469-8137.2011.03666.x.
- Powers, W., E. Fritz, W. Fehr, and R. Angel. 2006. “Total and water-soluble Phosphorus Excretion from Swine Fed low-phytate Soybeans.” Journal of Animal Science 84: 1907–1915. doi:10.2527/jas.2005-656.
- Qin, D., Y. Hara, V. Raboy, and H. Saneoka. 2020. “Characteristics and Quality of Japanese Traditional Fermented Soybean (Natto) from a low-phytate Line.” Plant Foods for Human Nutrition 75 (4): 651–655. doi:10.1007/s11130-020-00865-5.
- Raboy, V. 2003. “myo-Inositol-1,2,3,4,5,6-hexakisphosphate.” Phytochemistry 64 (6): 1033–1043. doi:10.1016/s0031-9422(03)00446-1.
- Raboy, V. 2009. “Approaches and Challenges to Engineering Seed Phytate and Total Phosphorus.” Plant Science 177 (4): 281–296. doi:10.1016/j.plantsci.2009.06.012.
- Raboy, V., P. F. Gerbasi, K. A. Young, S. D. Stoneberg, S. G. Ickett, A. T. Bauman, P. P. Murthy, W. F. Sheridan, and D. S. Ertl. 2000. “Origin and Seed Phenotype of Maize Low Phytic Acid 1-1 and Low Phytic Acid 2-1.” Plant Physiology 124 (1): 355–368. doi:10.1104/pp.124.1.355.
- Raboy, V., R. S. Gibson, K. B. Bailey, and J. C. King. 2020. “Comparison of Four Methods for Phytate Analysis in plant-based Foods.” Journal of Food Composition and Analysis 90: 103481. doi:10.1016/j.jfca.2020.103481.
- Roche, D. B., M. T. Buenavista, and L. J. McGuffin. 2013. “The FunFOLD2 Server for the Prediction of protein-ligand Interactions.” Nucleic Acids Research 41 (W1): W303–W307. doi:10.1093/nar/gkt498.
- Seelan, R. S., J. Lakshmanan, M. F. Casanova, and R. N. Parthasarathy. 2009. “Identification of myo-inositol-3-phosphate Synthase Isoforms.” Journal of Biological Chemistry 284 (14): 9443–9457. doi:10.1074/jbc.M900206200.
- Shi, J., H. Wang, K. Schellin, B. Li, M. Faller, J. M. Stoop, R. B. Meeley, D. S. Ertl, J. P. Ranch, and K. Glassman. 2007. “Embryo-specific Silencing of a Transporter Reduces Phytic Acid Content of Maize and Soybean Seeds.” Nature Biotechnology 25 (8): 930–937. doi:10.1038/nbt1322.
- Sparvoli, F., and E. Cominelli. 2015. “Seed Biofortification and Phytic Acid Reduction: A Conflict of Interest for the Plant?” Plants 4 (4): 728–755. doi:10.3390/plants4040728.
- Stiles, A. R., X. Qian, S. B. Shears, and E. A. Grabau. 2008. “Metabolic and Signaling Properties of an Itpk Gene Family in Glycine Max.” FEBS Letters 582 (13): 1853–1858. doi:10.1016/j.febslet.2008.04.054.
- Sun, Y., M. Thompson, G. Lin, H. Butler, Z. Gao, S. Thornburgh, K. Yau, D. A. Smith, and V. K. Shukla. 2007. “Inositol 1, 3, 4, 5, 6-pentakisphosphate 2-kinase from Maize: Molecular and Biochemical Characterization.” Plant Physiology 144 (3): 1278–1291. doi:10.1104/pp.107.095455.
- Taliman, N. A., Q. Dong, K. Echigo, V. Raboy, and H. Saneoka. 2019. “Effect of Phosphorus Fertilization on the Growth, Photosynthesis, Nitrogen Fixation, Mineral Accumulation, Seed Yield, and Seed Quality of a Soybean low-phytate Line.” Plants (Basel) 8 (5): 119. doi:10.3390/plants8050119.
- Trapnell, C., B. A. Williams, G. Pertea, A. Mortazavi, G. Kwan, M. J. Van Baren, S. L. Salzberg, B. J. Wold, and L. Pachter. 2010. “Transcript Assembly and Quantification by RNA-Seq Reveals Unannotated Transcripts and Isoform Switching during Cell Differentiation.” Nature Biotechnology 2 (5): 511–515. doi:10.1038/nbt.1621.
- Vanichkina, D. P., U. Schmitz, J. J. L. Wong, and J. E. Rasko. 2018. “Challenges in Defining the Role of Intron Retention in Normal Biology and Disease.” Seminars in Cell & Developmental Biology 75: 40–49. doi:10.1016/j.semcdb.2017.07.030.
- Wilcox, J. R., G. S. Premachandra, K. A. Young, and V. Raboy. 2000. “Isolation of High Seed Inorganic P, low-phytate Soybean Mutants.” Crop Science 40 (6): 1601–1605. doi:10.2135/cropsci2000.4061601x.
- Yuan, F. J., D. H. Zhu, Y. Y. Tan, D. K. Dong, X. J. Fu, S. L. Zhu, B. Q. Li, and Q. Y. Shu. 2012. “Identification and Characterization of the Soybean IPK1 Ortholog of a Low Phytic Acid Mutant Reveals an exon-excluding splice-site Mutation.” Theoretical and Applied Genetics 125 (7): 1413–1423. doi:10.1007/s00122-012-1922-7.