
 ?Mathematical formulae have been encoded as MathML and are displayed in this HTML version using MathJax in order to improve their display. Uncheck the box to turn MathJax off. This feature requires Javascript. Click on a formula to zoom.
ABSTRACT
Historical depletion of agricultural soils must be remedied to maintain their long-term food production function, including soils in intensive vineyards traditionally kept without plant cover to limit resource competition. This paper reports on the impact of five contrasting soil management regimes on indicators of soil quality such as soil organic carbon, nitrogen and their indices. We exposed sandy loam Rendzic Leptosol under a vineyard in Nitra-Dražovce (Slovakia, central Europe) to the following five treatments for 14 years: no-till sward, no-till sward+NPK100, no-till sward+NPK125, plowed tillage and (5) plowed tillage+manure. We found that grass swards continuously increased the total soil organic carbon in the topsoil, but plowed tillage resulted in no change. The availability of potentially mineralizable nitrogen was also increased by grass cover; but was not modified by manure but by mineral fertilizer addition. We tested the usefulness of carbon and management indices as indicators of changing soil C and N status and found them no better than tracking total and labile forms of both elements. In conclusion, the recovery of degraded vineyard soils under no-till grass sward cover is detectable within 14 years and is not affected by fertilization or manure addition.
1. Introduction
Soil is one of the critical natural resources needed to sustain human life on Earth. Healthy soil supports biological productivity, maintains environmental quality, and promotes plant productivity (Brevik and Sauer Citation2015). Conversion of soils to agricultural use typically involves removing and replacing original vegetation, and in the case of arable agriculture, continuous soil manipulation to make it suitable for crop growth (Guo and Gifford Citation2002; Lettens et al. Citation2005). Much literature indicates that exploitative soil management practices typical of modern agriculture are likely to severely degrade the global soil resource (Lal Citation2004a; Minasny, Sulaeman, and Mcbratney Citation2011).
When colonizing the landscape, humans first establish arable agriculture on the most fertile and pliable soils (Montgomery Citation2012), leaving less suitable locations for pasture or crops that do not demand intensive soil management. Compared to other crops, vineyards are usually established on slopes characterized by less fertile and stony soils (Šimanský and Polláková Citation2016). The soil under every vineyard is a critical production system component, determining the grape’s quantity and quality (White Citation2015). The most common soil management under vineyards is repeated tillage to remove competition for soil resources (Novara et al. Citation2011). Depending on the type of production system, the soil may be intensively fertilized prior to vine establishment. Manure or mineral fertilizers are applied deeper into the soil profile than standard crops; soil pH may also be adjusted (Conradie, Van Zyl, and Myburgh Citation1996). As a result, some soils historically used for vine cultivation have been transformed into Anthrosols (WRB Citation2014). Soil management practices are thus directly relevant to the environmental and economic sustainability of viticulture (Torre, Morano, and Tajani Citation2017).
Soil organic matter (SOM) is one of the most important soil characteristics (Garousi et al. Citation2021) and one of the crucial determinants of soil fertility (Benbi, Kiranvir, and Sharma Citation2015). The role of soil carbon in the current rapid climate change is well understood (Horák et al. Citation2021). In addition, SOM content in agricultural soils has become increasingly important in sustaining the functioning of ecosystems and the socio-economic development of many regions of the world (Komatsuzaki and Ohta Citation2007). Organic matter in the soil is a heterogeneous and dynamic substance that varies in its C and N content (Tong et al. Citation2014). Soil organic carbon (SOC) and total nitrogen (Ntotal) are closely associated with a wide range of physical, chemical, and biological properties; their content is a key driver of soil health (Brevik and Sauer Citation2015). SOC is a useful indicator of soil quality and forms the basis of soil fertility (de Moraes et al. Citation2018). Typically, SOM stores and releases nutrients for plant growth, promotes the soil’s structural, biological, and physical health, and is a buffer against harmful substrates (Abrol and Peeyush Citation2019; Wang et al. Citation2021). Nitrogen is the nutrient most frequently limiting growth in terrestrial ecosystems, including agricultural systems (Garousi et al. Citation2021).
SOC, particularly its labile forms, are sensitive to crop management and changes in agricultural management (Benbi, Kiranvir, and Sharma Citation2015). Their content in productive soils is reported as absolute values but also as indices: carbon lability, carbon lability index, carbon pool index, and carbon management index (Blair, Lefroy, and Lisle Citation1995; Šimanský and Polláková Citation2016; Vieira et al. Citation2007). Soil N content is equally, if not more, sensitive to crop growth and soil management, and soil N availability is a key component of all agricultural systems. Šimanský et al. (Citation2018) used a set of similar indices to describe N dynamics in the soil. The usefulness of these two sets of indices (C and N) in a productive system has been debated, it is not clear how valuable they are when evaluating the effects of different soil management practices in field experiments.
The vine requires specific soil and environmental conditions for optimal growth and development (White Citation2015). The practice of growing vines has been modified on many occasions: intensive plowed tillage of vineyards was first introduced and then limited, terracing and chemical protection against pests and weeds are applied in some systems, and certain vineyards are irrigated or fertigated (White Citation2015), while others use organic or hybrid systems (Fecenko and Ložek Citation2000). Studies from different wine-growing regions recommend numerous ways of treating the soil within and between vine rows: regulated chemical control of weeds between vine rows, mulching or permanent grass cover, or the cultivation of intercrops in deep-soil vineyards (Bordoni et al. Citation2019; Celette, Gaudin, and Gary Citation2008; López-Vicente et al. Citation2020; Novara, Cerdà, and Gristina Citation2018; Šimanský and Polláková Citation2016). The sustainability of agricultural soils features prominently in the EU New Soil Strategy (European Commission Citation2021), one of its key challenges is the increase of SOM in agricultural soils and the restoration of carbon-rich ecosystems.
Many intensive agricultural practices in vineyards negatively impact soil quality, speeding up soil erosion in vine-growing regions (López-Vicente et al. Citation2020; Obia et al. Citation2016). Ploughing, earthworks or terrace construction on steeper slopes severely impact soil function and disrupt the delivery of soil ecosystem services, especially under newly established vineyards (Rietra, Lesschen, and Porre Citation2021). Improved soil management, specifically focusing on restoring and enhancing soil function, may enhance the prospects of sustainable soil use and vineyard productivity in the long run. In this light, reorienting vineyard soil management toward soil function – while maintaining its economic viability – is critically needed (Belmonte et al. Citation2018; Novara et al. Citation2020). This study compares vineyard soil management interventions and compares their potential for enhancing soil organic carbon and nitrogen. We use the dynamics of these two elements to describe the change in soil status and as indicators of the productive potential of the soil. Carbon management indices were developed some time ago to track changes in labile and stable C pools. Labile C compounds are known to fluctuate rapidly, their concentration depends on the sampling date, whereas any changes in the stable pools need substantial time horizons to be observable. Carbon management indices thus aim to combine the two measurements (Blair, Lefroy, and Lisle Citation1995). In addition, we develop and test a corresponding suite of nitrogen management indices. We hypothesize that (H1) grass cover in a productive vineyard will increase SOM and (H2) a decrease of labile N due to plant competition. Finally, the expected reduction of labile N (H3) should be offset by fertilization on the soil to maintain vine productivity.
2. Materials and methods
2.1. Study location
This study is based on a long-term experiment established in 2006 in a vineyard in Nitra-Dražovce (Slovakia, 48°21′6.16″N; 18°3′37.33″E). The Nitra wine-growing region is found on the southern and southwestern foothills of the Tribeč mountain range. Its south-facing slopes were deforested and converted to vineyards as early as the 11th century, a land-use practice that still continues today (Šimanský Citation2015). The experiment was conducted on a location that was converted to vine production around a thousand years ago and used occasionally as a vineyard or pasture until 2000. In autumn 2000, the site was plowed to 0.3 m depth, and vines (Vitis vinifera L. cv. Chardonnay) were planted in rows at 2 × 1.2 m spacing (Rheinish – Hessian system was used). During the post-establishment phase 2000–2006, the vineyard was managed intensively by mechanically removing weeds three times a year, all inter-rows were plowed to 0.25 m depth in the autumn. The first grape yield was harvested in 2003, its full productivity was achieved in 2006, coinciding with the establishment of this experiment.
The study area has a warm temperate climate, fully humid with warm summers: Cfb according to Köppen-Geiger classification (Kottek et al. Citation2006). The mean annual air temperature was 9.8°C and the mean annual sum of precipitation was 550 mm during the 1991 to 2020 reference period. The geologic substrate of the studied area is composed of Mesozoic sedimentary rocks; predominantly Cretaceous, Jurassic, and Triassic limestones. A soil survey was carried out in the spring of 2006 to determine the soil properties of the vineyard. The soil has been classified as Rendzic Leptosol with strong anthropogenic influence (WRB Citation2014). Briefly, the A horizon is 0–35 cm deep, its depth is the legacy of historical land use in this location. Its description is that of A horizon, fine sandy loam, brownish-black (10 YR 4/2; 10 YR 3/2), dry, weak granular, fine structure, composed of 56.9% of sand, 33.0% of silt, and 10.1% of clay particles with sandy loam texture. A gradual and smooth boundary follows this to the A/C horizon at 35–65 cm: loamy coarse sand, dark brown (10 YR 5/3; 10 YR 3/3), weak granular fine structure, with an abundance of rock fragments. Finally, a clear and level boundary distinguishes the R horizon at more than 65 cm depth, characterized as hard dolomite bedrock. Before the experiment, rock fragments observed in the A-horizon took about 8% of topsoil bulk. Reference soil samples covering the experimental area were taken before the establishment of this experiment in 2006 (depth 0–30 cm, n = 13). Before vine planting, the soil contained 17.0 ± 1.6 g kg−1 organic carbon, 13.1 ± 5.5 g kg−1 inorganic carbon, 1067 ± 103 mg kg−1 total N, 99 ± 8 mg kg−1 available P, 262 ± 15 mg kg−1 available K, the base saturation percentage was 99.3 ± 0.01%, and pHH2O value 7.18 ± 0.08 on average across the site.
2.2. Experimental design
The experiment was designed to contrast the effects of 5 soil management practices in a productive vineyard and was laid out as a block design with three replicates. Experimental plots are 3 m wide and 7 m long to cover a row of 7 vine plants. The following treatments were imposed in 2006: (A) No-till sward, grassland treatment representing a shift toward soil recovery, plant cover is maintained in and between the vine rows by mechanized mowing 4 times a year on average, and by leaving all cutting in situ as mulch. No fertilization is applied. (B) No-till sward+NPK100 and (C) No-till sward+NPK125 –plant cover is maintained as above, but the indicated annual application of NPK fertilizer enhances soil fertility. (D) Ploughed tillage represents intensive vineyard management typical of this area, and the business as usual as a continuation of the original land use. A medium tilth is applied in the autumn to a depth of 0.25 m. Manual weeding between the vine rows using hoes is carried out during the growing season as needed, typically about three times per season. No fertilization is applied. Finally, (E) Ploughed tillage+manure where soil management is the same as in the Ploughed tillage treatment, but 40 t ha−1 of poultry manure is worked into the soil every four years.
In the no-till sward, sward+NPK100, and sward+NPK125 treatments, a mixture of Lolium perenne L. (50%), Poa pratensis L. (20%), Festuca rubra ssp. commutata (25%), and Trifolium repens L. (5%) was sown in and between vine rows in spring. As mentioned above, aboveground grass biomass is cut down annually and left in situ – an average of 4 times during the vine growing season. Annual fertilizer application (Duslofert Extra NPK(S) 14-10-20-7) at 0.2 m depth in no-till sward+NPK100 corresponds to 100 kg N ha−1, 30 kg P ha−1, and 120 kg K ha−1, whereas in the no-till sward+NPK125 the application rate is 125 kg N ha−1, 50 kg P ha−1and 185 kg K ha−1. The fertilization rate follows the manufacturer recommendation for two commercial yield levels of 10 and 15 t ha−1 of grapes a year in Slovakia (Fecenko and Ložek Citation2000). Since 2006, the fertilizer application is carried out twice yearly, corresponding to bud-burst (March) and flowering (May). The annual application rate is split 50/50 in the NPK100 and 66/33 in the NPK125 treatments. The fertilizer is always manually incorporated to a depth of 0.2 m in the vicinity of vine plants. Poultry manure containing 55% of organic substances, total N 2.8%, P2O5 1.3%, K2O 1.2%, and pH 6–8 in dry matter was applied in the plowed tillage+manure treatment. The first application of manure took place in the autumn of 2005, and the follow-up applications then occurred in 4-yearly cycles (autumns of 2009, 2013, and 2017). All vine cuttings were left in situ in all treatments.
2.3. Soil sampling and analysis
A single soil sample of 5 cm diameter was taken from each replicate plot to cover 0–30 cm (A horizon topsoil) and 30–60 cm depths (A/C horizon subsoil) every spring from 2009 to 2020. Vine rooting depth observations drove the decision to take a composite sample covering the whole horizon. The samples from replicate plots belonging to the same treatment were homogenized to obtain a composite sample, a step driven by scarcity of resources. All samples were dried at room temperature, ground, sieved to 0.25 mm, and analyzed shortly after. SOC was then established by the wet combustion method (Dziadowiec and Gonet Citation1999). The labile carbon content (CL) was measured by the Loginow method (Łoginow et al. Citation1987), total nitrogen (Ntotal) by the Kjeldahl method (Peterburskij Citation1999), and the content of potentially mineralizable nitrogen (Npot) by the Stanford and Smith method (Stanford and Smith Citation1978).
The Carbon Management Index (CMI) was calculated after Blair, Lefroy, and Lisle (Citation1995):
where CPI is the carbon pool index and LI is the lability index.
CPI and LI are calculated as follows:
where L refers to the C lability, calculated as:
and non-labile carbon (CNL) is calculated as:
where SOC is soil organic carbon content and CL is the labile carbon content.
The plowed tillage treatment was used as the reference due to more than 1000 years of continuous agricultural use of these soils, where tillage likely was the most common and frequent intervention. The other soil management practices were considered treatments. Nitrogen Management Index (NMI) was calculated following the same procedure but substituting carbon-related variables for those describing nitrogen. The following indexes for nitrogen were also calculated (EquationEquation 6(6)
(6) -Equationequations 10
(10)
(10) ):
Calculation of nitrogen lability (LN)
where: Npot – potentially mineralizable nitrogen, NNL – non-labile nitrogen, Ntotal - total soil nitrogen content
Calculation of nitrogen lability index (NLI)
Calculation of nitrogen pool index (NPI)
Calculation of nitrogen management index (NMI)
2.3.1. Statistical analysis
All statistical analyses were performed using Statistica 15.5 (TIBCO Software Inc.). Temporal changes in measured soil characteristics between the treatments were compared by fitting a linear model to the data. Extra sum-of-squares F test was then used to test for differences in slope at p < 0.05 to compare the treatments and the difference from zero slope to assess change over time. Pearson product-moment correlation was used to evaluate the relationship between CL and Npot.
3. Results
3.1. Soil organic carbon and total nitrogen
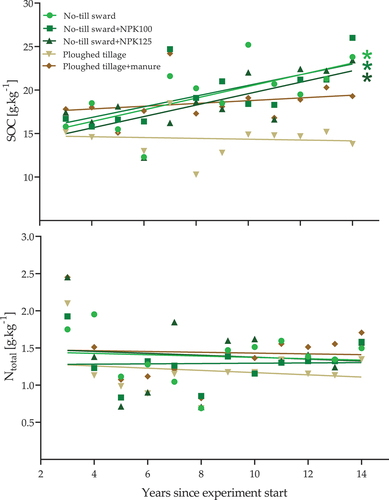
Soil management treatments imposed in our vineyard have changed SOC amounts differently (p = 0.041, ). All treatments with grass swards have continued accumulating SOC in the 0-30 cm soil layer throughout the period under observation (p < 0.017). In contrast, plowed tillage or its combination with manure addition resulted in no change in SOC (p > 0.421). The sward treatments increased the amount of SOC by around 0.6 g.kg−1 per year (Supplementary Table S1). The treatments had no effect in the 30–60 cm soil layer (p = 0.846) or in the total soil depth explored in this experiment (p = 0.172). Interestingly, despite adding poultry manure or different amounts of fertilizer to the soil, our treatments did not change the total N content in the topsoil (p = 0.996), subsoil (p = 0.990), or total soil depth (p = 0.999).
Figure 1. Soil organic carbon (SOC) and total nitrogen (Ntotal) in 0–30 cm topsoil layer in vineyard soils exposed to five different soil management regimes for 14 years. Symbols represent composite sample measurements from individual treatments, lines are linear regression fits. Stars indicate a significant difference in slope from zero at p < 0.05. No-till Sward is a permanent four grass species mixture, Sward+NPK100 and Sward +NPK125 are the same mixture but fertilized with 100 and 125 kg N y−1, while plowed Tillage is annual tilling to remove weeds, and Tillage+manure is the same with an addition of 40 t ha−1 manure every 4 years.
3.2. Labile carbon and nitrogen
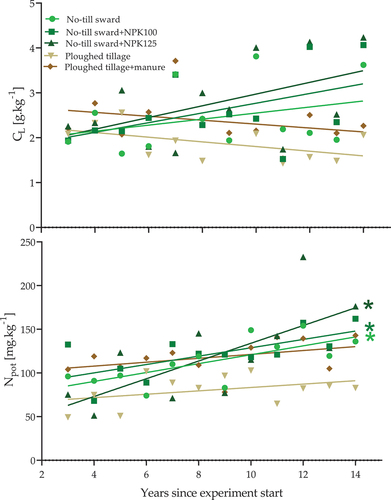
Soil management treatments had a strong and contrasting effect on labile carbon and potentially mineralizable nitrogen content. Both of these soil characteristics are indicative of the short-term dynamics of the carbon and nitrogen cycles. Soil management led to a significant difference in labile carbon in the top 0-30 cm layer (p = 0.042, ). We did not see any change in CL in the three sward or two plowed tillage treatments in the 12 years since the beginning of the experiment (p = 0.087 to 0.345, ). There is a discernible trend toward higher CL under the no-till swards, but the high variability of yearly observations clouds this. A different dynamic was apparent in the case of potentially mineralizable nitrogen (Npot, ), there was a strong increase in Npot under the no-till sward treatments (p = 0.009 to 0.019), and no change in the plowed tillage treatments (p = 0.168 to 0.204).
Figure 2. Labile organic carbon (CL) and potentially mineralizable nitrogen (Npot) in 0–30 cm topsoil layer in vineyard soils exposed to five different soil management regimes for 14 years. Symbols represent composite sample measurements from individual treatments, lines are linear regression fits. Stars indicate a significant difference in slope from zero at p < 0.05. No-till Sward is a permanent four grass species mixture, Sward+NPK100 and Sward +NPK125 are the same mixture but fertilized with 100 and 125 kg N y−1, while plowed Tillage is annual tilling to remove weeds, and Tillage+manure is the same with an addition of 40 t ha−1 manure every 4 years.
3.3. Carbon and nitrogen management indices
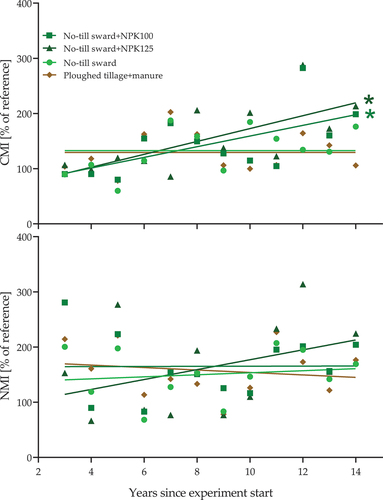
Carbon and nitrogen dynamics in agricultural soil are key components of soil fertility and can be approximated by the construction of management indices. We used the plowed tillage treatment as the reference, as this was the land use type best representing local agriculture for about a millennium before the establishment of the vines. There was no significant difference between the four non-reference treatments regarding CMI (p = 0.245, ) or NMI (p = 0.456, ) in the topsoil layer. The plowed tillage+manure treatment did not change the CMI (p = 0.831). In fertilized sward treatments, the CMI increased significantly by about 10% per year ( and Supplementary Table S1). No-till sward+NPK125 treatment also increased the CMI in the subsoil by about 3% per year (Supplementary Table S2).
Figure 3. Carbon (CMI) and nitrogen (NMI) management indices in 0–30 cm topsoil layer in vineyard soils exposed to five different soil management regimes for 14 years. Symbols represent composite sample measurement from individual treatments, lines are linear regression fits. Stars indicate the significance of slope different from zero at p < 0.05. Sward is a permanent four grass species mixture, Sward+NPK100 and Sward +NPK125 is the same mixture but fertilized with 100 and 125 kg N y−1, Tillage is annual tilling to remove weeds and Tillage+manure is the same with an addition of 40 t ha−1 manure every 4 years.
4. Discussion
4.1. Carbon
Changes in SOC resulting from alterations in soil management practice usually take a long time to manifest, mainly due to the presence of stable SOC fractions in the soil (Kögel‐knabner et al. Citation2008). Saljnikov, Cakmak, and Rahimgalieva (Citation2013) have shown that up to 60–85% of SOC can be considered stable, with the remainder belonging to the active fraction subject to rapid alterations. The conversion of our site from forest to agriculture took place many centuries ago. The impact of this land use change on all SOC fractions has probably run its course, resulting in carbon content at equilibrium with the use of the site as a pasture (Lal Citation2004b). The establishment of a new vineyard 20 years ago, and the imposition of soil management treatments, have changed that. The plowed tillage treatments represent an intensive cultivation scenario, which typically reduces SOC content (Celette et al. Citation2005; Kucharik et al. Citation2001). Given the site’s history, we expected a decrease in SOC under both plowed tillage treatments; however, we did not find one over the 14 years of the experiment (). Our observation is inconsistent with the findings of several studies where the leading cause of the C loss due to tillage is intensive decomposition and mineralization of SOM caused by turning and aeration of the soil (Mloza-Banda, Makwiza, and Mloza-Banda Citation2016; Novara et al. Citation2020; Saha and Ghosh Citation2013). The long-term use of these soils may hold a clue; the total carbon stocks of these soils have been depleted over centuries and settled at a low equilibrium. Soil disturbance – tillage in our case – then does not affect SOC. Grassland establishment, however, results in a continuous increase of SOC in our vineyard soils, unaffected by fertilization (accept H1, ). This scenario is typical of recovering soils that accumulate C (Conant et al. Citation2017).
Labile carbon is a highly sensitive indicator of the immediate status of fresh SOM and its transformations (Benbi, Kiranvir, and Sharma Citation2015; Blair, Lefroy, and Lisle Citation1995). In this experiment, we did see some effects of treatments on CL in the topsoil (0–30 cm) and the subsoil (30–60 cm). Several factors related to soil management may affect CL; for example, fertilization has been shown to reduce CL due to the stimulation of microbial activity in the soil (Hütsch, Augustin, and Merbach Citation2002). In our case, the role of fertilization in driving the content of labile C in the soil remains unclear as we did not observe any effects of mineral fertilizer or manure addition in either grass sward or plowed tillage treatments. There are differences in the amount of C and the type of organic compounds delivered by residual plant biomass and poultry manure, driven by amount, decomposition status and timing of addition to soil (Chen, Kim, and Jiang Citation2018). Lack of treatment effect on CL may be thus indicative of its rapid transformation, where a fraction enters the stable SOC pool (Jones et al. Citation2012). The presence of grass species has been shown to contribute to the stabilization of C in water-stable macro-aggregates (Šimanský, Balashov, and Horák Citation2016), SOC thus becomes protected and builds up in our vineyard soils (Kögel‐knabner et al. Citation2008); see also ).
4.2. Nitrogen
Total nitrogen (Ntotal) is a relatively stable parameter in typical soil, its largest proportion is bound in organic and mineral compounds. Most of the organic N can be mineralized and made available to microorganisms and plants, or over time it can be incorporated into stable humic substances (Kögel‐knabner et al. Citation2008; Wang et al. Citation2021). Changes in Ntotal may arise due to long-term management practice, for example, when intensive cultivation with plant biomass removal lowers Ntotal (Saljnikov, Cakmak, and Rahimgalieva Citation2013). Increases in Ntotal may result from the incorporation of farmyard manure (Masood et al. Citation2014) and subsequent biochemical stabilization of N in SOM (Kögel‐knabner et al. Citation2008) or as a result of higher plant productivity due to mineral fertilization (Saljnikov, Cakmak, and Rahimgalieva Citation2013). In this study, we did not find any effect of soil management treatments on soil Ntotal, its value stabilized around 1.5 g kg−1 N in all treatments after 14 years (). This is interesting as the amount of N applied as poultry manure must have exceeded that provided in the grass sward treatments. Further, the treatments significantly affected potentially mineralizable nitrogen (Npot) in the topsoil. The pool of Npot was steadily increasing in all no-till sward treatments, with no effect of fertilization (; reject H3), possibly driven by biological and chemical mineralization (Kovačik and Ryant Citation2019). This contradicts our hypothesis, which proposed a decline of Npot due to plant competition (reject H2). Rather than decreasing, the amount of Npot was increasing by 6.7 mg kg−1 per year on average as a result of keeping the soil covered by a mixture of grass species.
4.3. Interaction between soil C and N
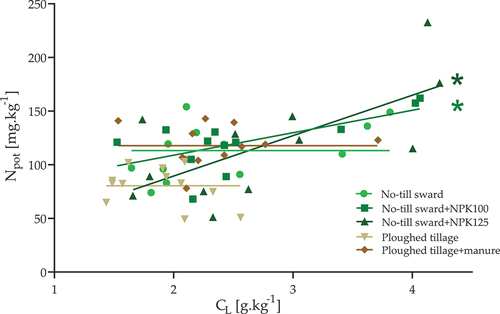
The role of mineral fertilization or farmyard manure addition in driving stable soil C and N pools remains unclear. Observations suggest positive effects of N addition on SOC through humic substances stabilization (Gonet and Debska, Citation1998). Conversely, N addition might accelerate the SOM mineralization process and diminish SOC (Rutkowska and Pikuła Citation2013). This study only observed a shift in the topsoil’s labile C: labile N relationship due to mineral fertilization. Both fertilized no-till sward treatments show a positive relationship between the two: more CL in the soil is accompanied by more Npot. The other three treatments – including manure addition – show no relationship, Npot remains stable at all levels of CL (). We did not follow the amount of C and N deposited into the soil in various treatments, doing so may have enabled us to understand short-term effects on labile compounds better. Hütsch, Augustin, and Merbach (Citation2002) state that rhizodeposition is a major source of labile carbon in the soil, while intensive root activity might lower stocks of labile N. We did see this effect; the relationship between CL and Npot under grass swards differed from the two plowed tillage treatments (). However, the instability of these pools makes them subject to considerable seasonal changes (Laik et al. Citation2009), driven by temperature (Jiang and Xu Citation2006), soil moisture (Marschner and Kalbitz Citation2003), or the availability of labile compounds (Saljnikov, Cakmak, and Rahimgalieva Citation2013). In this study, the samples were collected in April of every year, which does not allow for an exploration of seasonal dynamics but creates an opportunity to assess long-term trends.
Figure 4. Relationships between labile organic carbon (CL) and potentially mineralizable nitrogen (Npot) in 0–30 cm topsoil layer in vineyard soils exposed to five different soil management regimes between 2 and 14 years. Symbols represent composite sample measurements from individual treatments, lines are linear regression fits. Stars indicate a significant difference in slope from zero at p < 0.05. No-till Sward is a permanent four grass species mixture, Sward+NPK100 and Sward +NPK125 are the same mixture but fertilized with 100 and 125 kg N y−1, while plowed Tillage is annual tilling to remove weeds, and Tillage+manure is the same with an addition of 40 t ha−1 manure every 4 years.
4.4. C and N management indices
We compared the effects of soil management treatments on the dynamics of soil C and N by constructing their management indices according to Blair, Lefroy, and Lisle (Citation1995). The motivation was that they aggregate changes in both stable and labile pools and thus may be more sensitive to minute changes. In this experiment, we could detect changes in soil C and N pools by following their stable and labile pools over time; we could replicate this observation by constructing and comparing C and N management indices. Several authors considered C indices superior in detecting changes in the stocks and availability of these two elements for plant and microbial uptake (Benbi, Kiranvir, and Sharma Citation2015; Conteh et al. Citation1999; Vieira et al. Citation2007). Interestingly, the CMI of the topsoil indicated an effect of fertilization that the more straightforward parameters did not pick up (Supplementary Table S1). However, the construction of these two indices may require further research to (i) establish the criteria for the reference soil, which in our case was not natural soil and (ii) the possibility of constructing a standard index able to indicate the common dynamics of these two elements, perhaps based on the C/N ratio.
5. Conclusion
The transformation processes of C and N compounds in our vineyard soils were affected by soil management and depth. No-till grass swards continuously increased the amount of soil organic carbon (SOC) over 14 years. The strongest effects were observed in the topsoil, while the impact of vineyard soil management diminished in the subsoil. There was little evidence of the additional value of using C and N management indices, as they proved to be as sensitive as direct measurements of soil characteristics needed to calculate them. A continuous assessment of changes in the concentration of C- and N-containing compounds in the soil may be necessary to design and verify soil management strategies in vineyards. The study highlights the potential of sustainable soil management in vineyards, as we observed a clear benefit of grass swards in enhancing soil C and N content.
Supplemental Material
Download MS Word (21.6 KB)Acknowledgments
This publication results from the ‘Scientific support of climate change adaptation in agriculture and mitigation of soil degradation‘ project (ITMS2014 + 313011W580), supported by the Integrated Infrastructure Operational Programme and funded by ERDF. Martin Lukac received support from the European Social Fund EVA 4.0 (OP RDE, CZ.02.1.01/0.0/0.0/16_019/0000803).
Disclosure statement
No potential conflict of interest was reported by the author(s).
Supplemental data
Supplemental data for this article can be accessed online at https://doi.org/10.1080/00380768.2023.2208154.
Additional information
Funding
References
- Abrol, V., and S. Peeyush. 2019. Biochar: An Imperative Amendment for Soil and the Environment. London: IntechOpen.
- Belmonte, S. A., C. Luisella, R. J. Stahel, E. Bonifacio, V. Novello, E. Zanini, and K. L. Steenwerth. 2018. “Effect of Long-Term Soil Management on the Mutual Interaction Among Soil Organic Matter, Microbial Activity and Aggregate Stability in a Vineyard.” Pedosphere 28 (2): 288–298. doi:10.1016/S1002-0160(18)60015-3.
- Benbi, D. K., B. Kiranvir, and S. Sharma. 2015. “Sensitivity of Labile Soil Organic Carbon Pools to Long-Term Fertilizer, Straw and Manure Management in Rice-Wheat System.” Pedosphere 25 (4): 534–545. doi:10.1016/S1002-0160(15)30034-5.
- Blair, G. J., R. D. B. Lefroy, and L. Lisle. 1995. “Soil Carbon fFractions Based on Their Degree of Oxidation, and the Development of a Carbon Management Index for Agricultural Systems.” Australian Journal of Agricultural Research 46 (7): 1459–1466. doi:10.1071/AR9951459.
- Bordoni, M., A. Vercesi, M. Maerker, C. Ganimede, M. C. Reguzzi, E. Capelli, X. Wei, E. Mazzoni, S. Simoni, and E. Gagnarli. 2019. “Effects of Vineyard Soil Management on the Characteristics of Soils and Roots in the Lower Oltrepò Apennines (Lombardy, Italy).” The Science of the Total Environment 693: 133390. doi:10.1016/j.scitotenv.2019.07.196.
- Brevik, E. C., and T. J. Sauer. 2015. “The Past, Present, and Future of Soils and Human Health Studies.” Soil 1 (1): 35–46. doi:10.5194/soil-1-35-2015.
- Celette, F., R. Gaudin, and C. Gary. 2008. “Spatial and Temporal Changes to the Water Regime of a Mediterranean Vineyard Due to the Adoption of Cover Cropping.” European Journal of Agronomy 29 (4): 153–162. doi:10.1016/j.eja.2008.04.007.
- Celette, F., J. Wery, E. Chantelot, J. Celette, and C. H. Gary. 2005. “Belowground Interactions in a Vine (Vitis Vinifera L.)-Tall Fescue (Festuca Arundinacea Shreb.) Intercropping System: Water Relations and Growth.” Plant and Soil 276 (1): 205–217. doi:10.1007/s11104-005-4415-5.
- Chen, Z., J. Kim, and X. Jiang. 2018. “Survival of Escherichia coli O157: H7 and Salmonella enterica in Animal Waste‐based Composts as Influenced by Compost Type, Storage Condition and Inoculum Level.” Journal of Applied Microbiology 124 (5): 1311–1323. doi:10.1111/jam.13719.
- Conant, R. T., C. E. P. Cerri, B. B. Osborne, and K. Paustian. 2017. “Grassland Management Impacts on Soil Carbon Stocks: A New Synthesis.” Ecological Applications 27 (2): 662–668. doi:10.1002/eap.1473.
- Conradie, W. J., J. L. Van Zyl, and P. A. Myburgh. 1996. “Effect of Soil Preparation Depth on Nutrient Leaching and Nutrient Uptake by Young Vitis Vinifera L. Cv. Pinot Noir.” South African Journal of Enology and Viticulture 17 (2): 43–52. doi:10.21548/17-2-2257.
- Conteh, A., G. J. Blair, R. Lefroy, and A. Whitbread. 1999. “Labile Organic Carbon Determined by Permanganate Oxidation and Its Relationships to Other Measurements of Soil Organic Carbon.” Humic Substances in the Environment 1: 3–15. doi:10.1590/0103-9016-2015-0047.
- de Moraes, S., J. Carlos, D. R. P. Gonçalves, L. A. Ferreira, U. Mishra, T. M. Inagaki, F. J. F. Furlan, et al. 2018. “Soil Carbon Fractions and Biological Activity Based Indices Can Be Used to Study the Impact of Land Management and Ecological Successions.” Ecological Indicators 84: 96–105. doi:10.1016/j.ecolind.2017.08.029.
- Dziadowiec, H., and S. Gonet. 1999. “Methodological Guidebook for Studies of Organic Matter.” Prace Komisji Naukowych Polskiego Towarzystwa Naukowego 120: 31–34.
- European Commission. 2021. “New Soil Strategy - Healthy Soil for a Healthy Life.” In EU Soil Strategy, 26. European Commission.
- Fecenko, J., and O. Ložek. 2000. Nutrition and Fertilization of Field Crops. Nitra: Slovak University of Agriculture. In Slovak.
- Fiala, K., J. Kobza, Ľ. Matušková, V. Brečková, J. Makovníková, G. Barančíková, V. Búrik, et al. 1999. Obligatory Methods of Soil Analyses. Partial Monitoring System—Soil. Bratislava: Soil Science and Conservation Research Institute. In Slovak.
- Garousi, F., Z. Shan, K. Ni, H. Yang, J. Shan, J. Cao, Z. Jiang, J. Yang, T. Zhu, and C. H. Müller. 2021. “Decreased Inorganic N Supply Capacity and Turnover in Calcareous Soil Under Degraded Rubber Plantation in the Tropical Karst Region.” Geoderma 381: 114754. doi:10.1016/j.geoderma.2020.114754.
- Gonet, S. S., and B. Debska. 1998. “Properties of Humic Acids Developed During Humification Process of Post-Harvest Plant Residues.” Environment international 24 (5–6): 603–608.
- Guo, L. B., and R. M. Gifford. 2002. “Soil Carbon Stocks and Land Use Change: A Meta-Analysis.” Global Change Biology 8 (4): 345–360. doi:10.1046/j.1354-1013.2002.00486.x.
- Horák, J., T. Kotuš, L. Toková, E. Aydın, D. Igaz, and V. Šimanský. 2021. “A Sustainable Approach for Improving Soil Properties and Reducing N2O Emissions is Possible Through Initial and Repeated Biochar Application.” Agronomy 11 (3): 582. doi:10.3390/agronomy11030582.
- Hütsch, B. W., J. Augustin, and W. Merbach. 2002. “Plant Rhizodeposition—An Important Source for Carbon Turnover in Soils.” Journal of Plant Nutrition and Soil Science 165 (4): 397–407. doi:10.1002/1522-2624(200208)165:4<397:AID-JPLN397>3.0.CO;2-C.
- Jiang, P. -K., and Q. F. Xu. 2006. “Abundance and Dynamics of Soil Labile Carbon Pools Under Different Types of Forest Vegetation.” Pedosphere 16 (4): 505–511. doi:10.1016/S1002-0160(06)60081-7.
- Jones, D. L., J. Rousk, G. Edwards-Jones, T. H. DeLuca, and D. V. Murphy. 2012. “Biochar-Mediated Changes in Soil Quality and Plant Growth in a Three Year Field Trial.” Soil Biology & Biochemistry 45: 113–124. doi:10.1016/j.soilbio.2011.10.012.
- Kögel‐knabner, I., G. Guggenberger, M. Kleber, E. Kandeler, K. Kalbitz, S. Scheu, K. Eusterhues, and P. Leinweber. 2008. “Organo‐mineral Associations in Temperate Soils: Integrating Biology, Mineralogy, and Organic Matter Chemistry.” Journal of Plant Nutrition and Soil Science 171 (1): 61–82. doi:10.1002/jpln.200700048.
- Komatsuzaki, M., and H. Ohta. 2007. “Soil Management Practices for Sustainable Agro-Ecosystems.” Sustainability Science 2 (1): 103–120. doi:10.1007/s11625-006-0014-5.
- Kottek, M., J. Grieser, C. H. Beck, B. Rudolf, and F. Rubel. 2006. “World Map of the Köppen-Geiger Climate Classification Updated.” Meteorologische Zeitschrift 15 (3): 259–263. doi:10.1127/0941-2948/2006/0130.
- Kovačik, P., and P. Ryant. 2019. Agrochemistry, Principles and Practice. Nitra: Slovak University of Agriculture. In Slovak.
- Kucharik, C., JKR. Brye, J. M. Norman, J. A. Foley, S. T. Gower, and L. G. Bundy. 2001. “Measurements and Modeling of Carbon and Nitrogen Cycling in Agroecosystems of Southern Wisconsin: Potential for SOC Sequestration During the Next 50 Years.” Ecosystems 4 (3): 237–258. doi:10.1007/s10021-001-0007-2.
- Laik, R., K. Kumar, D. K. Das, and O. P. Chaturvedi. 2009. “Labile Soil Organic Matter Pools in a Calciorthent After 18 Years of Afforestation by Different Plantations.” Applied Soil Ecology 42 (2): 71–78. doi:10.1016/j.apsoil.2009.02.004.
- Lal, R. 2004a. “Agricultural Activities and the Global Carbon Cycle.” Nutrient Cycling in Agroecosystems 70 (2): 103–116. doi:10.1023/B:FRES.0000048480.24274.0f.
- Lal, R. 2004b. “Soil Carbon Sequestration Impacts on Global Climate Change and Food Security.” Science 304 (5677): 1623–1627. doi:10.1126/science.1097396.
- Lettens, S., J. O. S. Van Orshoven, B. A. S. Van Wesemael, B. Muys, and D. Perrin. 2005. “Soil Organic Carbon Changes in Landscape Units of Belgium Between 1960 and 2000 with Reference to 1990.” Global Change Biology 11 (12): 2128–2140. doi:10.1111/j.1365-2486.2005.001074.x.
- Łoginow, W., W. Wisniewski, S. S. Gonet, and B. Ciescinska. 1987. “Fractionation of Organic Carbon Based on Susceptibility to Oxidation.” Polish Journal of Soil Science 20 (1): 47–52.
- López-Vicente, M., E. Calvo-Seas, S. Álvarez, and A. Cerdà. 2020. “Effectiveness of Cover Crops to Reduce Loss of Soil Organic Matter in a Rainfed Vineyard.” Land 9 (7): 230. doi:10.3390/land9070230.
- Marschner, B., and K. Kalbitz. 2003. “Controls of Bioavailability and Biodegradability of Dissolved Organic Matter in Soils.” Geoderma 113 (3–4): 211–235. doi:10.1016/S0016-7061(02)00362-2.
- Masood, S., T. Naz, M. T. Javed, I. Ahmed, H. Ullah, and M. Iqbal. 2014. “Effect of Short-Term Supply of Farmyard Manure on Maize Growth and Soil Parameters in Pot Culture.” Archives of Agronomy and Soil Science 60 (3): 337–347. doi:10.1080/03650340.2013.792990.
- Minasny, B., Y. Sulaeman, and A. B. Mcbratney. 2011. “Is Soil Carbon Disappearing? The Dynamics of Soil Organic Carbon in Java.” Global Change Biology 17 (5): 1917–1924. doi:10.1111/j.1365-2486.2010.02324.x.
- Mloza-Banda, H. R., C. N. Makwiza, and M. L. Mloza-Banda. 2016. “Soil Properties After Conversion to Conservation Agriculture from Ridge Tillage in Southern Malawi.” Journal of Arid Environments 127: 7–16. doi:10.1016/j.jaridenv.2015.11.001.
- Montgomery, D. R. 2012. Dirt: The Erosion of Civilizations. California: Univ of California Press.
- Novara, A., A. Cerdà, and L. Gristina. 2018. “Sustainable Vineyard Floor Management: An Equilibrium Between Water Consumption and Soil Conservation.” Current Opinion in Environmental Science & Health 5: 33–37. doi:10.1016/j.coesh.2018.04.005.
- Novara, A., V. Favara, A. Novara, N. Francesca, T. Santangelo, P. Columba, S. Chironi, M. Ingrassia, and L. Gristina. 2020. “Soil Carbon Budget Account for the Sustainability Improvement of a Mediterranean Vineyard Area.” Agronomy 10 (3): 336. doi:10.3390/agronomy10030336.
- Novara, A., L. Gristina, S. S. Saladino, A. Santoro, and A. Cerdà. 2011. “Soil Erosion Assessment on Tillage and Alternative Soil Managements in a Sicilian Vineyard.” Soil and Tillage Research 117: 140–147. doi:10.1016/j.still.2011.09.007.
- Obia, A., J. Mulder, V. Martinsen, G. Cornelissen, and T. Børresen. 2016. “In situ Effects of Biochar on Aggregation, Water Retention and Porosity in Light-Textured Tropical Soils.” Soil and Tillage Research 155: 35–44. doi:10.1016/j.still.2015.08.002.
- Rietra, R. P. J. J., J. P. Lesschen, and R. J. Porre. 2021. Recarbonizing Global Soils: A Technical Manual of Recommended Management Practices. Volume 3-Cropland, Grassland, Integrated Systems and Farming Approaches-Practices Overview. Rome: FAO.
- Rutkowska, A., and D. Pikuła. 2013. “Effect of Crop Rotation and Nitrogen Fertilization on the Quality and Quantity of Soil Organic Matter.” In Soil Processes and Current Trends in Quality Assessment, edited by M. C. H. Soriano, 249–267. Rijeka: IntechOpen.
- Saha, R., and P. K. Ghosh. 2013. “Soil Organic Carbon Stock, Moisture Availability and Crop Yield as Influenced by Residue Management and Tillage Practices in Maize–Mustard Cropping System Under Hill Agro-Ecosystem.” National Academy Science Letters 36 (5): 461–468. doi:10.1007/s40009-013-0158-7.
- Saljnikov, E., D. Cakmak, and S. Rahimgalieva. 2013. “Soil Organic Matter Stability as Affected by Land Management in Steppe Ecosystems.” In Soil Processes and Current Trends in Quality Assessment, edited by M. C. H. Soriano, 269–310. Rijeka: IntechOpen.
- Šimanský, V. 2015. “Changes in Soil Structure and Soil Organic Matter Due to Different Severities of Fire.” Ekológia (Bratislava) 34 (3): 226–234. doi:10.1515/eko-2015-0022.
- Šimanský, V., E. Balashov, and J. Horák. 2016. “Water Stability of Soil Aggregates and Their Ability to Sequester Carbon in Soils of Vineyards in Slovakia.” Archives of Agronomy and Soil Science 62 (2): 177–197. doi:10.1080/03650340.2015.1048683.
- Šimanský, V., J. Jonczak, P. Kováčik, and D. Bajčan. 2018. “Impact of Crop Residues and Biopreparations on Nitrogen Changes in Haplic Luvisol–Model Experiment.” Soil Science Annual 69 (4): 251–258. doi:10.2478/ssa-2018-0026.
- Šimanský, V., and N. Polláková. 2016. “The Effects of Soil Management Practices on Soil Organic Matter Changes Within a Productive Vineyard in the Nitra Viticulture Area (Slovakia).” Agriculture (Polnohospodárstvo) 62 (1): 1–9. doi:10.1515/agri-2016-0001.
- Stanford, G., and S. J. Smith. 1978. “Oxidative Release of Potentially Mineralizable Soil Nitrogen by Acid Permanganate Extraction.” Soil Science 126 (4): 210–218. doi:10.1097/00010694-197810000-00003.
- Tong, X., M. Xu, X. Wang, R. Bhattacharyya, W. Zhang, and R. Cong. 2014. “Long-Term Fertilization Effects on Organic Carbon Fractions in a Red Soil of China.” Catena 113: 251–259. doi:10.1016/j.catena.2013.08.005.
- Torre, C. M., P. Morano, and F. Tajani. 2017. “Saving Soil for Sustainable Land Use.” Sustainability 9 (3): 350. doi:10.3390/su9030350.
- Vieira, F. C. B., C. Bayer, J. A. Zanatta, J. Dieckow, J. Mielniczuk, and Z. L. He. 2007. “Carbon Management Index Based on Physical Fractionation of Soil Organic Matter in an Acrisol Under Long-Term No-Till Cropping Systems.” Soil and Tillage Research 96 (1–2): 195–204. doi:10.1016/j.still.2007.06.007.
- Wang, B., D. Liu, J. Yang, Z. Zhu, F. Darboux, J. Jiao, and S. An. 2021. “Effects of Forest Floor Characteristics on Soil Labile Carbon as Varied by Topography and Vegetation Type in the Chinese Loess Plateau.” Catena 196: 104825. doi:10.1016/j.catena.2020.104825.
- White, R. E. 2015. Understanding Vineyard Soils. London: Oxford University Press.
- WRB. 2014. International Soil Classification System for Naming Soils and Creating Legends for Soil Maps. Rome: FAO.