
 ?Mathematical formulae have been encoded as MathML and are displayed in this HTML version using MathJax in order to improve their display. Uncheck the box to turn MathJax off. This feature requires Javascript. Click on a formula to zoom.
ABSTRACT
In large-scale upland cropping systems, understanding the magnitude of soil property variations and mapping the distribution are essential to improve soil nutrient management. The Tokachi district of Hokkaido has large-scale upland fields, and the soils are dominated by Andosols that inherently have characteristic clay minerals and high soil organic carbon content. In the region, microtopography is known to exist that can affect soil formation and within-field variation of the inherent soil properties. However, limited information exists about the relationship between microtopography and the spatial variation of inherent soil properties that are important for nutrient dynamics. Therefore, this study aimed to assess the effect of microtopography on the within-field variation of inherent soil properties in Andosols of Tokachi district, Hokkaido. Within a 6.6-ha field with an elevation difference of 3.2 m, four soil profiles were surveyed at different topographical positions, and 530 surface soil samples were collected at 12-m intervals. Samples were analyzed for total carbon (TC), acid-oxalate extractable Al, Fe, and Si (Alo, Feo, and Sio), pyrophosphate extractable Al and Fe (Alp and Fep), cation exchange capacity (CEC), and phosphate absorption coefficient (PAC). Geostatistical analysis was applied to understand the spatial structure of the surface soil properties. All soil profiles were dominated by volcanic parent materials, and they were classified into different types of Andosols. An exceptional variation of inherent soil properties was found in the surface soil, with TC content ranging from 35.2 to 124 g kg−1 and CEC from 20.3 to 55.7 cmolc kg−1. Geostatistical analysis showed that TC content varied over a large distance (range: 226 m) while allophane content varied at a shorter distance (range: 118 m). Our findings revealed that microtopography affected the soil water dynamics and erosion of the surface soil particles which caused the variation of TC, CEC, and allophane. Further studies must be conducted to understand the effects of the variation of these inherent soil properties on soil nutrient availability and crop productivity.
1. Introduction
Precision management of agricultural inputs is becoming more critical in arable cropping systems since the constraints over water, soil, biodiversity, and land are even more significant (Pretty and Bharucha Citation2014). In Japan, the increasing cost of fertilizer and the recent report on the accumulation of soil nutrients (Obara and Nakai Citation2004; Tani and Kinoshita Citation2020) are inducing farmers to optimize fertilizer application to improve profitability and reduce environmental damage. For large-scale agricultural production, understanding the source and scale of soil variability is important for the improvement of soil and crop management (Di Virgilio, Monti, and Venturi Citation2007).
Soil properties vary spatially from a field scale to a larger regional scale, affected by soil-forming and anthropogenic factors (Cambardella and Karlen Citation1999). The soil properties can be classified into inherent and dynamic, and the former ones are soil properties that do not change or change very little with management. They have a high degree of spatial variability due to the combined effect of physical, chemical, and biological processes operating in different intensities and at different scales (Chopra and Chakraborty Citation2008; Kilic, Kilic, and Kocyigit Citation2012). At the field scale, the spatial variations of the inherent soil properties are likely to affect the spatial variation of the dynamic properties including soil nutrient dynamics that are important for crop production and environmental conservation.
The Tokachi district of Hokkaido is one of the most important upland crop production areas in Japan on a large-scale farm with 45.7 ha on average, which is 21 times larger compared with the rest of the country (MInistry of Agriculture, Forestry and Fisheries, Japan Citation2020). The surface topography is a complex of alluvial fans and floodplains on river terraces of different formation ages (Kikuchi Citation2008). The distribution of parent materials depends on the formation age of the river terrace, varying from alluvial materials to volcanic ash (Hatano, Shinjo, and Yusuke Citation2021; Kato et al. Citation2019; Kikuchi Citation2008; Tani et al. Citation2010). The soil in the high terrace was mainly formed from volcanic parent materials deposited during the Pleistocene and Holocene. In the middle and low terraces, the soils are dominated by volcanic parent materials on the surface, deposited during the late Pleistocene and Holocene, overlying alluvial deposits in the subsoil. However, the thickness of the volcanic materials in the middle terrace is greater than that observed in the low terrace. In the lowland, the soils are younger than those in the terraces, dominated by alluvial materials recently deposited by existing rivers (Kikuchi Citation2008).
Microtopography is also known to affect the spatial variation of soil properties on a smaller scale. In the Tokachi district, many gentle slopes are found, especially in the river terraces that were affected by periglacial processes, such as ice erosion and sand dune formation (Kikuchi Citation2008; Niwa et al. Citation2011). These abundant slopes are responsible for the microtopography commonly found at the field scale. Microtopography refers to soil surface variation, including patterns of elevation at many spatial scales, encompassing both vertical and surface roughness (Larkin, Vivian-Smith, and Zedler Citation2006; Moser, Ahn, and Noe Citation2007). Imai (Citation1964) suggested that the spatial variation of soil properties in the Tokachi district might be because the volcanic ash and alluvial deposits were eroded and redeposited during the Holocene and Late Pleistocene ages. These pedogenic processes might have caused a huge impact on the spatial distribution of inherent soil properties at a within-field scale since the field size can be as large as a few hectares or more (Niwa et al. Citation2011).
About 58% of the arable soils are classified as Andosols and about 28% as Lowland soils based on the Comprehensive Soil Classification System of Japan First Approximation (Kanda et al. Citation2016). Andosols are known to have high soil organic carbon (SOC) content that provides high water-holding capacity, soil buffering, and CEC (Matus et al. Citation2014). Andosols also have an abundance of poorly crystalline clay minerals such as allophane, imogolite, and ferrihydrite as well as an Al-humus complex, which determine various soil functions important for crop production along with SOC (Shoji, Dahlgren, and Nanzyo Citation1993). For example, they show a very high phosphate fixation capacity that limits plant-available phosphate, the major yield-limiting factor in the region (Shoji, Dahlgren, and Nanzyo Citation1993). In Hokkaido, there is already a fertilizer recommendation system that is soil type specific for a particular crop type, cultivar, region, and cultivation method (Department of Agriculture, Hokkaido Government Citation2020), which aims to determine an optimum fertilizer rate.
Within-field variation of soil properties has been assessed widely for different soil types. Early studies such as Cambardella et al. (Citation1994) showed a spatial variation of 28 soil parameters for two fields under Mollisols with 36 and 96 ha, respectively. There were large spatial variations of inherent soil properties, including SOC and soil texture, with a coefficient of variation (CV) of about 35%, as well as for plant available nutrients (35 ≤ CV ≤ 74%). The magnitude of spatial variation was dependent on the landscape features of each field, and the within-field variation of inherent soil properties was affected by landscape positions such as summit, backslope, and depressional positions. In a more recent study in Acrisols (IUSS Working Group Citation2015), the spatial variation of SOC was also affected by elevation in combination with land use and parent materials, while the CEC was only affected by land use when evaluated at the regional scale (932 km2; Song et al. Citation2020). These types of studies are very limited for Andosols that inherently show very high SOC content and distinct mineralogical characteristics. In the Tokachi district, some attempts were made by Niwa et al. (Citation2019), who reported soil C varying from 29.6 to 82.4 g kg−1 and phosphate absorption coefficient (PAC) ranging from 1,070 to 1,750 in one field where the parent materials were volcanic ash in the topsoil and alluvial deposits in the subsoils. However, within-field variations of inherent soil properties other than soil C, such as clay mineralogy and associated soil properties important for crop production, have not been evaluated in detail for upland crop fields under Andosols. Also, the relationship between microtopography and the spatial variation of soil properties has not been assessed in the region. Therefore, this study was conducted to assess the effect of microtopography on the within-field variation of inherent soil properties in Andosols of Tokachi district, Hokkaido.
2. Materials and methods
2.1. Study site
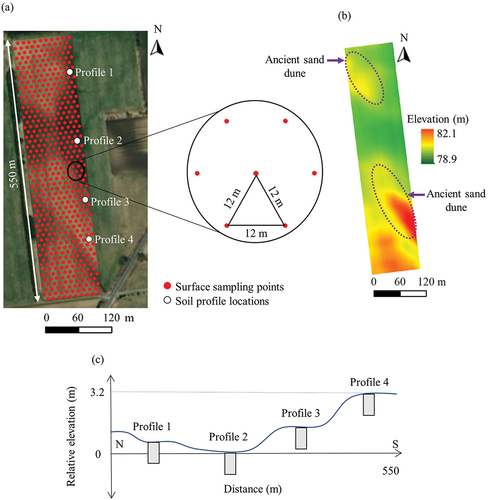
The study was carried out in an experimental field within the Obihiro University of Agriculture and Veterinary Medicine located in Obihiro City, Tokachi district, Hokkaido prefecture, Japan (42°51’43.4“N, 143°09’57.5“E). The region is within a humid continental climate (Dfb; Peel, Finlayson, and Mcmahon Citation2007). The 30-year average annual precipitation and air temperature were 926 mm and 7.2°C, respectively, with a mean monthly temperature ranging from −7.1°C in January to 20.3°C in August (Japan Metrological Agency Citation2022). The region is surrounded by the Hidaka range in the West and the Daisetsuzan Volcanic Group in the North. Rivers have created alluvial fans and, subsequently, river terraces and floodplains in the Pleistocene. The river terraces can be classified according to the age of formation. The lowland adjacent to the river courses is the youngest and lacks volcanic materials due to recent flooding and only contains alluvial deposits, which are mostly classified into Lowland soils (Kanda et al. Citation2016). On the terraces, most of the soils are classified into Andosols, but the composition of the parent materials within the profiles is dependent on the formation ages of the terraces (Kikuchi Citation2008). The study field was located on the middle terrace (Kamisatsunai I Plain; Tokachi Research group, Tokachi Research Group, 1978), where the parent materials are known to be dominated by the late Pleistocene and Holocene volcanic materials. The field was 550 m in the N-S direction and 120 m E-W direction, a total of 6.6 ha (). An unmanned aerial vehicle model Phantom 4 RTK (SZ DJI Technology Co., Ltd. Citation2023, Shenzhen, China) equipped with a 1-inch, 20-megapixel CMOS sensor was utilized to collect the surface soil images of the field from a 25 m height, at a speed of 2.0 m/s and 80% of the photos overlap on both front and side. Afterward, the field image was used for making the digital elevation map () in ArcMap 10.6.1 (Esri Inc. Berkeley, California). An undulating topography was observed within the field, with two ancient sand dunes in the northwest and southeast corners ()), creating a 3.2-m elevation difference. The ancient sand dunes were formed with Eniwa-a (En-a) volcanic materials deposited 19,000 to 21,000 years B.P. (Machida and Arai Citation2003), which were secondarily sedimented by wind (Kimura et al. Citation1970). This is a common feature in the middle and high terraces in the central to the southern part of the Tokachi district.
Figure 1. (a) Map of surface sampling locations and soil profile survey sites, (b) elevation map, and (c) schematic diagram of soil profile survey sites in relation to microtopography. Source of the base map: Esri, Maxar, GeoEye, Earthstar Geographics, CNES/Airbus DS, USDA, USGS, AeroGRID, IGN, and the GIS user community (Esri Inc. Citation2018).
2.2. Soil profile survey
Four soil profiles were prepared in May 2021 at different topographical positions () to understand the soil formation process and especially the effect of microtopography on soil properties. Profile 2 was at the lowest elevation, while profile 4 was at the highest elevation on top of the ancient sand dune. Morphological features of the profiles were recorded in the field, and soil samples were collected from each identified horizon for mineralogical and physicochemical analysis.
2.3. Surface soil sampling
A total of 530 surface soil samples were collected in May 2020 and April 2021 () using an automated soil sampler (Wintex 1000, Wintex Agro, Thisted, Denmark) mounted on an all-terrain vehicle. The autosampler was also equipped with a high-precision Global Navigation Satellite System receiver (DG-PRO1RWS; Biz Station Co., Ltd., Nagano, Japan) with a Virtual Reference Station System at 1 cm horizontal accuracy. Soil samples were collected using an equilateral triangular grid design with 12 m on each side () and depths of 0–25 cm. Each soil sample was composed of 10 subsamples that were collected at every 20 cm, starting at a distance of 80 cm before the georeferenced sampling point, along a straight line in the North–South direction.
2.4. Soil analysis and data calculation
All soil samples were air-dried and passed through a 2-mm sieve, followed by the removal of visible organic residues. Total carbon content (TC) was measured using a dry combustion method with a Vario EL III analyzer (Elementar Analysensysteme, Hanau, Germany). Acid-oxalate extractable aluminum, iron, and silicon (Alo, Feo, and Sio) were extracted using a 0.2 mol L−1 acid ammonium oxalate solution at pH 3.0 after shaking for 4 hours in the dark (Blakemore, Seatle, and Daly Citation1987). Pyrophosphate extractable aluminum and iron (Alp and Fep) were extracted using a 0.1 mol L−1 sodium pyrophosphate solution at pH 10.0 after shaking for 16 hours (Blakemore, Seatle, and Daly Citation1987). Both acid-oxalate and pyrophosphate extracted elements were measured by an inductively coupled plasma emission spectrophotometer (ICP-AES; ICPE-9820; Shimadzu Corporation, Kyoto, Japan). Allophane content was calculated according to the equation proposed by Mizota and van Reeuwijk (Citation1989), which is widely used. The allophane content in the soil is obtained by the relation between aluminum and silicon ratio ((Alo-Ap)/Sio) and the silicon content in the allophane (Sio). The values were converted to grams per kilogram for better comparability with other soil properties.
CEC was measured using the ammonium acetate extraction method at pH 7.0 (Schollenberger and Simon Citation1945). PAC was measured by reacting a soil sample with a phosphate retention solution (13.44 mg P2O5 mL−1) at pH 7.0 for 24 hours, followed by determining the remaining phosphate in the solution using the molybdate yellow method (Nanzyo Citation1997).
2.5. Statistical and geostatistical analysis
Descriptive statistics and Pearson correlation coefficients were calculated using JMP Pro 16.1 (SAS Institute Inc., Cary, North California, SAS Intitute Inc. Citation2023). The gstat package (Pebesma Citation2004) in the R statistical computing environment (Version 1.4.1106, RStudio, PBC, RStudio Team. Citation2021) was used for all geostatistical modeling. Semivariance (γ(h)) is half of the variance between two locations that are separated by a distance h called lag, and m(h) is the number of pairs at the distance h, and it was calculated as equation 2:
After the calculation of the semivariance, the variogram model was fitted, and the best-fit model was used to describe the relationship between semivariance and the lag. Frequently the semivariance increases with increasing lag but often reaches a maximum at some distance. The semivariance at this maximum value is called a sill. The lag when the sill is reached is called range, and this indicates the limit of spatial dependence. Sample distances further than the range are spatially independent. The semivariance at lag 0 is called the nugget and may reflect measurement error or spatial variation on a scale smaller than the observed grid size. The percent nugget was calculated to show the degree of spatial dependence, as equation 3 (Goovaerts Citation1999):
The percent nugget takes a value in the range of 0 to 100, and when <25% indicates a strong spatial dependence, 25–75% indicates a moderate spatial dependence, and >75% indicates a weak spatial dependence (Cambardella et al. Citation1994). Then, ordinary kriging was used to map each of the soil properties, and ArcMap 10.6.1 (Esri Inc. Berkeley, California) was used to display the maps.
3. Results and discussion
3.1. Soil profile characteristics and soil formation
There was a significant difference in the morphological features among the four soil profiles in different topographical positions (). Especially, there were exceptional differences in the topsoil colors and A horizon thickness, likely affected by the differences in SOM content. Among the four soil profiles, profile 2, located at the lowest elevation (78.9 m), had the darkest color (10 YR 2/1 ~ 10 YR 1.7/1; ) and the thickest A horizon reaching a depth of 55 cm (; ). Profile 1, located at a slightly higher elevation (79.2 m), had a similar to slightly lighter soil color (10 YR 2/1 ~ 10 YR 2/2) and much shallower A horizon thickness reaching a depth of 30 cm. Profile 3, located at a higher elevation (79.8 m), had even lighter soil colors (10 YR 2/3 ~ 10 YR 2/2) and the A horizon depth reaching a depth of 32 cm. Profile 4, located at the highest elevation (82.0 m), had the lightest soil color (10 YR 3/3) and the A horizon depth reaching a depth of 32/37 cm. The soil color reflected the total carbon (TC) content of the Ap1 horizon. The Ap1 horizon of profile 2 had the highest TC content of 106 g kg‑1, followed by 78.9, 64.5, and 43.6 g kg‑1 in profiles 1, 3, and 4, respectively (). This shows that among the four profiles, the TC content of the Ap1 horizon was higher as the field elevation decreased (). The A horizon thickness was much higher in profile 2 compared with the rest of the soil profiles, likely affected by the concave topography unlike other profiles, which could accumulate eroded materials from surrounding areas (Kirkels, Cammeraat, and Kuhn Citation2014).
Figure 2. Photographs of the four soil profiles surveyed at different topographical positions.
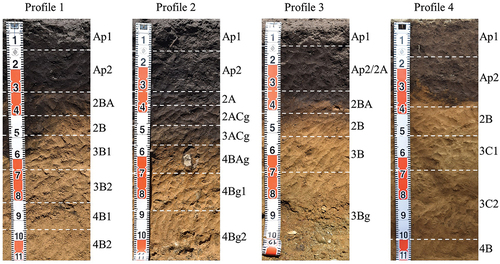
Table 1. Description of morphological properties of the soil profiles.
Table 2. Results of physicochemical analysis of the soil profiles.
The subsoils were very different among the four soil profiles, especially the presence of mottling, rock fragments, as well as the parent materials. Distinct tubular mottling was observed at 37 cm depth in profile 2, while faint tubular mottling was observed at 68 cm depth in profile 3, indicating seasonal high groundwater levels in these profiles, unlike in profiles 1 and 4, where no mottling was observed (). Subrounded rocks were also present in profiles 2 and 3, indicating that these rocks were deposited by water movement. These horizons were mixed with the parent materials of En-a, which were deposited 19,000 to 21,000 years B.P. from Mt. Eniwa (Machida and Arai Citation2003; ). Therefore, the presence of watercourses is suggested in those eras in locations around profiles 2 and 3. Profile 1 was located at a lower elevation area compared with profile 3, but it lacked mottling and gravels. Therefore, the ancient water courses, as well as current groundwater movement, appear not to follow the present elevation in some areas of this field. Profile 4 was located at the highest elevation on top of the ancient sand dune formed by the En-a materials (, c)). This location has likely experienced different moisture conditions compared with the other soil profiles. In general, the higher the moisture content is, the more the accumulation of SOM because of the lower microbial decomposition rate in oxygen-limited conditions (Saigusa, Shoji, and Otowa Citation1991).
All of the topsoil and subsoil horizons showed Alo+½Feo values of more than 2%, and their morphological features were as follows: (i) Ta-c (volcanic materials from Mt. Tarumae, about 2,500 years B.P.) identifiable by its distinct soil texture and extremely high Alo+½Feo content; (ii) Ta-d (volcanic materials from Mt. Tarumae, about 8,000 years B.P.) which has a distinct orange color after weathering and pumice-like texture; (iii) En-a (volcanic materials from Mt. Eniwa, about 18,000 years B.P.) identifiable by stratified soil texture from loamy to sandy due to water effects in the past; as well as some (iv) paleosols (; Machida and Arai Citation1992). The topsoil is assumed to be comprised of volcanic materials of more recent times, including Ta-a (volcanic materials from Mt. Tarumae, AD 1739), Ko-c2 (volcanic materials from Mt. Komagatake, AD 1694), and Ta-b (volcanic materials from Mt. Tarumae, AD 1667), which were mixed by plowing in the Ap horizons. The Spfa-1 (volcanic materials from the Shikotsu caldera, about 40,000 to 45,000 years B.P.) was not identified within the 1-m depth in this field, though it is known to be deposited in the area (Kikuchi Citation2008). Horizons with Ta-c showed much higher allophane content compared with other horizons (). The morphological features of the four soil profiles evaluated in this study were similar to those reported on the middle terrace in this region (Kato et al. Citation2019; Kikuchi Citation2008; Tani et al. Citation2010).
The PAC values were also the highest, where the allophane content was high for the subsoils (). In the topsoil, PAC was high where allophane content was low such as the Ap1 and Ap2 horizons of profile 2; therefore, the contributions of several different soil components, such as the Al-humus complex on the PAC, need to be evaluated in more detail.
Soil texture was affected by the parent materials, and they were generally loam (). En-a is known to have distinctly different soil textures in locations where it was sorted according to the particle size by water after deposition (Machida and Arai Citation1992). In profiles 1, 2, and 3, En-a horizons were loamy to clay loam texture, but they were loamy sand in profile 4. This indicates that the coarse pumice-rich layer remained in profile 4, where it was not affected by water because of the higher elevation. The paleosols of profiles 1 and 4 were different in soil texture as well as allophane content, indicating that they came from different parent materials or had very different weathering processes due to the differences in the soil moisture conditions.
All of the soil profiles had PAC values of more than 1,500, which is the threshold used to classify Andosols in Japan according to the Soil Classification System of Japan (The Fifth Committee for Soil Classification and Nomenclature Citation2017). However, PAC values less than 1,500 were recorded in the 3Bg horizon in profile 3 and 3C1, 3C2, and 4B horizons in profile 4 (). Nevertheless, all of the soil horizons showed an Alo+½Feo content of more than 2%, one of the requirements of andic soil properties in Soil Taxonomy (; Soil Survey Staff Citation2014) as well as the Soil Classification System of Japan. According to Soil Taxonomy, all of the profiles were classified into Andisols (udands), but there were two different types at the great group level. Profiles 1 and 2 were classified into Typic Melanudands because the cumulative thickness of the horizons, which showed that andic properties were more than 30 cm within a total of 40 cm thickness, with a color value of 2.5 or less and chroma of 2 or less. Profiles 3 and 4 were classified into Typic Hapludands. According to the Soil Classification System of Japan, all of the soils were classified into the Andosols great group because the thickness of horizons which showed Andic soil properties were 25 cm or more within 50 cm of the surface layer, but there were three types at the subgroup level. Profiles 1 and 3 were classified into Humic Allophanic Andosols because the topsoil had a color value of 3 or less and chroma of 3 or less, and the SOC content of the surface soils was 3% or more. Profile 2 was classified into Haplic Wet Andosols because the soil was assumed to be saturated in a certain period in a year, showing no gleyic characteristics, and oxidized Fe coating on the surface of peds and pores was observed. Profile 4 was classified into Brown-humic Allophanic Andosols because the surface layer had a SOC content of 3% or more, but the color did not qualify for humic characteristics.
3.2. Characteristics of the surface soil properties
The surface soil properties showed distinct characteristics of Andosols and presented exceptional variations. The mean TC content was high at 62.5 g kg−1, with a huge variation ranging from 32.5 to 124 g kg−1, with a CV of 35.2% (). This was more variable compared with the past studies conducted under Andosols. In the same study area, Niwa et al. (Citation2019) reported TC contents varying from 29.6 to 82.4 g kg−1 with a CV of 24.7% within a single field, where the parent materials were volcanic material overlying late Pleistocene deposits. The high variation of TC content in the surface soil found in our study might have resulted from the soil formation process undergone in this region; therefore, similar variations are expected in other fields in the Tokachi region. Kinoshita et al. (Citation2016) studied the within-field variation of TC in a 100-ha coffee agroforestry farm with an elevation difference of 269 m in Costa Rica, where TC ranged from 48.1 to 172 g kg−1 with a CV of 33.2%. These authors reported that andic soil properties and topography largely controlled the TC variation, which follows what was found in our study (discussed in detail in section 3.4).
Table 3. Descriptive statistics of selected surface inherent soil properties.
Alo represents the Al contained in both noncrystalline and paracrystalline clay minerals (i.e., allophane, imogolite) as well as the Al-humus complex (Blakemore, Seatle, and Daly Citation1987). The Al contained in the Al-humus complex is extracted as Alp. The variation of Alo was much less, with a CV of 17.4%, compared to Alp, with 38.8%. There was a significant positive relationship between TC and Alp (r = 0.94; ), which suggests that Al-humus complex is one of the key factors for the accumulation of SOM. Allophane content varied from 39.0 to 214 g kg−1 with a CV of 27.4%, slightly less variable compared with TC (), indicating that clay mineralogy varies less compared to TC in this field. There was a significant negative correlation between allophane and Alp as well as TC (r = −0.69; ). This is because the formation of allophane and imogolite is limited by aqueous Al activity, and the formation of the Al-humus complex is known to lower the aqueous activity of Al (Dahlgren, Shoji, and Nanzyo Citation1993). Also, soluble humic substances are known to perturb the interaction between hydroxyl-Al ions and orthosilicic acid, which hinders the formation of imogolite and allophane (Inoue and Huang Citation1990).
Table 4. Pearson correlation coefficient of selected surface inherent soil properties (p < 0.001, except that indicated accordingly).
CEC had a mean of 30.5 cmolc kg−1 and ranged from 20.3 to 55.7 cmolc kg−1 with a CV of 23.0% (). It is known to be affected by the type and amount of both clay minerals and humic substances (Akbas, Gunal, and Acir Citation2017; Manrique, Jones, and Dyke Citation1991), and TC was the most correlated property in our study (r = 0.94; ), indicating that the amount of humic substances controls the variation of CEC. This also means that many of the negative charge sites are pH-dependent in this field (Nanzyo, Dahlgren, and Shoji Citation1993). There have been limited studies done to analyze the within-field variation of CEC under Andosols. The CEC of this study was extremely high compared with past studies in upland fields of various soil types. In nine fields across four states in the U.S.A., the mean CEC of each field ranged from 2.80 to 24.0 cmolc kg−1, and the maximum values ranged from 3.50 to 32.9 cmolc kg−1 (Kweon, Lund, and Maxton Citation2013). In their study, the CV was lower than our study except for just one field, which had a CV of 32.6%, indicating that our field showed a very high variation for an upland field. CEC is an extremely important indicator of soil’s capacity to retain base cations such as Ca2+, Mg2+, and K+ important for crop productivity. In Hokkaido, the optimum base saturation is recommended to be between 60% and 80% (Department of Agriculture, Hokkaido Government Citation2020). When the CEC values have variation, the base saturation is expected to be also variable, and it can be below the optimum range, especially in areas with high CEC, or can be excessive in areas with low CEC. These can potentially lower crop productivity when the supply of the base cations is limited. The CEC was strongly correlated with TC (r = 0.94), indicating that most of the negative charge sites are pH-dependent, which are known to have specific adsorption for trace metals (McBride Citation1994; Mouni et al. Citation2009, Citation2013; Nanzyo, Dahlgren, and Shoji Citation1993). Therefore, in high CEC areas, the essential plant nutrients such as Cu2+ and Zn2+ may become limited, while potential pollutants such as Pb2+ and Cd2+ can be retained.
PAC had a mean value of 1,831 and ranged from 1,310 to 2,520, with a CV of 9.70% (). Seven samples out of 530 samples had PAC values less than 1,500, the value used to classify Andosols by the Soil Classification System of Japan (The Fifth Committee for Soil Classification and Nomenclature of Japanese Society of Pedology Citation2017). However, this value can be replaced with an Alo+ ½Feo value of more than 2%, and all the 530 samples satisfied the criteria. Since the soil samples were taken from 0 to 25 cm depth, the entire field can be classified into Andosols. PAC is a measure of soil’s capacity to fix P through mechanisms such as adsorption or precipitation, and higher values indicate higher fixation capacity. The variation was much less compared with TC or allophane in this field, and most of the PAC values ranged from 1,500 to 2,000. PAC is affected by non- and paracrystalline clay minerals (i.e., allophane and imogolite), Al-humus complex, ferrihydrite, Al hydroxide, exchangeable Al, Ca, and Mg (Editorial Committee for Methods of Soil Environmental Analysis Citation1997). The PAC values were positively correlated with TC (r = 0.66; ) and negatively correlated with allophane (r = ‑0.14), showing that the Al-humus complex is likely the dominant factor influencing PAC in this study. Niwa et al. (Citation2019) also found a positive correlation between TC content and PAC (R2 = 0.70) in the 40 fields surveyed in this region, where the parent material was a mixture of volcanic material and alluvial deposits. However, Hashimoto et al. (Citation2012) showed Alo to be the most important predictor of PAC for allophanic Andisols when they studied 1,300 soil samples collected from nationwide Japan. Our field was classified as allophanic Andosols, but the correlation between PAC and Alo was low and not significant (), which contradicted their finding. This might have been caused by the fact that in our study the Alo range was smaller (20 to 48.8 g kg−1) compared to that found by these authors (1.2 to 99.2 g kg−1). Also, in our study, the PAC was strongly correlated with CEC (r = 0.66) while no correlation between these properties was found by Hashimoto et al. (Citation2012). If most of the negative sites on the surface of the clay colloids are occupied by base cations such as Ca2+ and Mg2+, it is expected that these might control the PAC in the field (Nanzyo, Uhm, and Shoji Citation1992). Although the relation between PAC and base cations was not evaluated in this study, we hypothesize that this could be the factor controlling the PAC in this field. This implies that the factors affecting PAC are more complex at a within-field scale and require further studies since PAC is very important when considering optimum phosphate fertilizer management.
3.3. Spatial structure of the surface soil properties
The spatial structure of each measured property was assessed using geostatistics. A spherical model was fit for all properties () and then used to map the soil properties in ordinary kriging (). In this study, most of the soil properties showed strong spatial class except for Alo, Feo, and PAC (), showing clear zones in the maps (). Strong spatial class indicates that the soil properties are controlled by intrinsic variations of soil characteristics (i.e., texture and mineralogy) rather than extrinsic variations (i.e., fertilizer and tillage; Cambardella et al. Citation1994). All of the soil properties measured in this study are regarded as inherent soil properties that are intrinsic properties of soils. The strongest spatial class was identified for TC, CEC, and Alp with 0% nugget. These properties had a long range with 226, 213, and 188 m, respectively, indicating that the values change gradually over a long distance and presenting large zones (). These properties show high correlation coefficients with each other (), and they also show similar spatial structures. The high values were concentrated in the middle of the field where the elevation was lower (), and three distinct zones of lower, higher, and lower values were apparent from the north to the south following the microtopography formed due to the two ancient sand dunes existing in this field. Kato et al. (Citation2019) reported a moderate spatial dependence of TC (% nugget of 44), although the TC variation was higher compared to our study, which contradicts our findings. The strong spatial dependence of TC in our study can be explained by the fact that the sampling interval was relatively smaller (12-m sampling interval, equivalent to 80 samples ha−1) compared to 5.8 samples ha−1, used by Kato et al. (Citation2019). The TC nugget in our study was zero compared to 449 reported by the same authors, showing that both the sampling interval and the TC measurement were appropriate in our study (Goovaerts Citation1998). TC values are also known to be correlated with hot water extractable N, which can be used as an indicator of available N in the soil (Curtin et al. Citation2006; Niwa et al. Citation2016). The spatial distribution of soil available N in this field is expected to be similar to the TC. Thus, its spatial management could be accomplished using the TC map. This also suggests that TC spatial variability maps can be used to define N management zones at the regional scale. Fep was also correlated with TC (r = 0.88), and it also showed a relatively long range at 170 m (). Allophane, Alo, and Sio showed relatively shorter ranges between 85.5 and 122 m (). The values were low in the center of the field where the elevation was lower, and TC was high (). These were expected because of the negative relationship between TC and allophane discussed previously in section 3.1. However, there was a more complex spatial variation for allophane compared with TC, especially in the southern part of the field around the ancient sand dune.
Figure 3. Kriged maps of selected inherent soil properties on the surface soil.
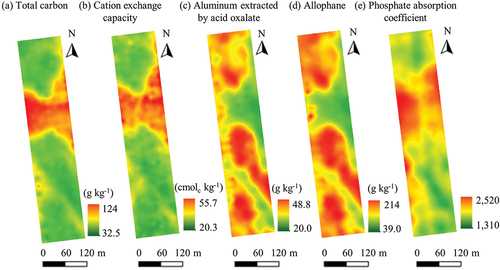
Table 5. Parameters of the semivariograms for selected surface inherent soil properties.
PAC showed a moderate spatial structure with a relatively shorter range at 139 m (). Although it was most correlated with TC, the spatial structure and the map were different (; ). The high TC area and high PAC area were similar in the center of the field; however, there were areas of high PAC and low TC that existed on the southwestern side of the field. This information warrants further studies to understand the complex factors affecting PAC and how it varies spatially within a field.
3.4. Factors affecting the spatial variation of the surface soil properties
The spatial variation of TC was very high in this field (CV = 35.2%; ), and it also had a strong spatial class with zero nugget percent (). There was a strong negative relationship between elevation and TC (r = −0.73; ). The change in TC content was much higher from the elevation of about 79.0 to 80.0 m, while much less TC change was observed where the elevation was more than 80.0 m. The TC content and elevation data of the Ap1 horizon of the four soil profiles were also plotted (). A hypothesis can be formulated that the lower elevation site has a higher groundwater level that limits the availability of oxygen in the soil profile and, in turn, reduces the mineralization of SOM (Saigusa, Shoji, and Otowa Citation1991). This hypothesis is true if profile 1 is ignored and when comparing only profiles 2, 3, and 4. Profile 2 was located at the lowest elevation (78.9 m) and had the shallowest mottling at 37 cm depth, while profile 4 was at the highest elevation (82.0 m) and lacked mottling in the entire soil profile. If elevation has some associations with the depth of the seasonal water table in this field, the elevation between 79.0 and 80.0 m determines whether shallow mottling within 50 cm of a soil profile is present or a complete lack of mottling. The significance of this impact may appear in the large change of TC in this elevation range (). Above 80.0 m, the change in the depth of the seasonal water table may be deeper than 1 m in the soil profile, and this difference will not affect much of the SOM decomposition. However, this hypothesis does not apply to profile 1, where the TC content was the second highest but lacked mottling within 1-m of the soil profile (; ). The Ap1 horizon of profile 1 had the highest Alo content among profiles 1, 2, and 3 and also had very high allophane content. In this profile, Al that could react with humic substances was more available, especially compared with profile 3. This Al could form an Al-humus complex that can reduce microbial decomposition of complexed humic acid (Saigusa, Shoji, and Otowa Citation1991). Therefore, the combination of moisture content and the mineralogical composition of the soil profile are thought to be the reason behind the spatial variation of TC, which was overall influenced by microtopography. Our findings highlight the role of topography in describing the spatial variability of inherent soil properties in this region.
Figure 4. The relationship between elevation and total carbon for both surface as well as the Ap1 horizon of the soil profiles.
The spatial variation of the surface allophane content was negatively correlated with TC content (); however, the profile characteristics should also be considered for further evaluation. Profile 1 had a higher allophane content in the Ap1 horizon compared with profile 3, even though TC content was higher in profile 1 (). The surface allophane content appears to be affected by humic substances but also by plowing and mixing of the allophane-rich subsurface layer into the topsoil. Therefore, the spatial dependence of allophane was much less compared with TC and had a shorter range of 118 m (). These complex effects of intrinsic mechanisms of inhibition of allophane synthesis by humic substances and anthropogenic influence of plowing caused the spatial dependence to be weaker.
Overall, this field had two ancient sand dunes that formed microtopography. This microtopography affected the course of ancient rivers and also changed the depth of the current seasonal water table. The microtopography effect, combined with the presence of the depth of an allophane-rich subsurface horizon, appears to dominate the spatial variation of the surface’s inherent soil properties. The spatial variation of TC dominates the variation of CEC, while the variation of PAC appears to be affected by factors other than both TC and allophane; thus, further investigations are needed.
4. Conclusion
Exceptional spatial variations of inherent soil properties were found in an upland field in the Tokachi district, where TC varied more compared with clay minerals. The microtopography affected the within-field spatial distribution of soil properties by altering the depth of the seasonal water table, which is a major factor affecting the TC content in this region. Volcanic materials of different ages were found in the soil profiles, and their distributions were also dependent on the topographical position. Allophane content in the soil surface showed a weaker spatial dependence compared with TC, which was affected by both the TC content but also anthropogenic factors such as plowing by incorporating the allophane-rich subsurface layers into the topsoil. Agronomically important properties such as CEC were strongly affected by the TC content, while PAC showed weaker correlations to both the TC content and clay minerals.
To optimize nutrient management in the large-scale fields in the Tokachi region, management zones need to be created, taking into account the within-field microtopography. Base cations can be managed based on the CEC map which had a strong correlation to the TC map. The management of N can also be based on the TC map. The estimation of the TC content can be conducted by using remote sensing equipment such as an unmanned aerial vehicle or a satellite, and the estimation model can also incorporate the elevation data. The estimation of PAC is more challenging since both TC and clay minerals affect the property, and the relationship to the elevation was weaker. A future study needs to be conducted to assess the relationship between these inherent soil properties and nutrient availability. Also, the mapping of these soil properties using remote sensing should be attempted to alleviate the cost and time required to obtain the soil maps.
Disclosure statement
No potential conflict of interest was reported by the author(s).
Additional information
Funding
References
- Akbas, F., H. Gunal, and N. Acir. 2017. “Spatial Variability of Soil Potassium and Its Relationship to Land Use and Parent Material.” Soil and Water Research 12 (4): 202–211. https://doi.org/10.17221/32/2016-SWR.
- Blakemore, L. C., P. L. Seatle, and B. K. Daly. 1987. “Methods for Chemical Analysis of Soils.” NZ Soil Bureau Science Report 80:72–76. https://doi.org/10.7931/DL1-SBSR-80.
- Cambardella, C. A., and D. L. Karlen. 1999. “Spatial Analysis of Soil Fertility Parameters.” Precision Agriculture 1 (1): 5–14. https://doi.org/10.1023/A:1009925919134.
- Cambardella, C. A., T. B. Moorman, J. M. Novak, T. B. Parkin, D. L. Karlen, R. F. Turco, and A. E. Konopka. 1994. “Field-Scale Variability of Soil Properties in Central Iowa Soils.” Soil Science Society of America Journal 58 (5): 1501–1511. https://doi.org/10.2136/sssaj1994.03615995005800050033x.
- Chopra, U., and D. Chakraborty. 2008. “Spatial Variability of Soil Properties and Its Application in Predicting Surface Map of Hydraulic Parameters in an Agricultural Farm.” https://www.researchgate.net/publication/242085578.
- Curtin, D., C. E. Wright, M. H. Beare, and F. M. McCallum. 2006. “Hot Water‐Extractable Nitrogen as an Indicator of Soil Nitrogen Availability.” Soil Science Society of America Journal 70 (5): 1512–1521. https://doi.org/10.2136/sssaj2005.0338.
- Dahlgren, R., S. Shoji, and M. Nanzyo. 1993. “Mineralogical Characteristics of Volcanic Ash Soils.” Developments in Soil Science 21:101–143. https://doi.org/10.1016/S0166-2481(08)70266-6.
- Department of Agriculture, Hokkaido Government. 2020. “Hokkaido Fertilizer Recommendations 2020.” In Hokkaido Agricultural Policy, Planning Department, Sapporo.
- Di Virgilio, N., A. Monti, and G. Venturi. 2007. “Spatial Variability of Switchgrass (Panicum virgatum L.) Yield as Related to Soil Parameters in a Small Field.” Field Crops Research 101 (2): 232–239. https://doi.org/10.1016/j.fcr.2006.11.009.
- Editorial Committee for Methods of Soil Environmental Analysis. 1997. “Methods of Soil Environmental Analysis.” Hakuyusha, Tokyo. (in Japanese).
- Esri Inc. 2018. ArcGIS Pro (Version 10.6.1). Esri Inc. California. https://www.esri.com.
- The Fifth Committee for Soil Classification and Nomenclature of Japanese Society of Pedology. 2017. Soil Classification System of Japan. Tokyo: The Japanese Society of Pedology. (in Japanese).
- Goovaerts, P. 1998. “Geostatistical Tools for Characterizing the Spatial Variability of Microbiological and Physico-Chemical Soil Properties.” Biology and Fertility of Soils 27 (4): 315–334. https://doi.org/10.1007/s003740050439.
- Goovaerts, P. 1999. “Geostatistics in Soil Science: State-Of-The-Art and Perspectives.” Geoderma 89 (1–2): 1–45. https://doi.org/10.1016/S0016-7061(98)00078-0.
- Hashimoto, Y., J. Kang, N. Matsuyama, and M. Saigusa. 2012. “Path Analysis of Phosphorus Retention Capacity in Allophanic and Non-Allophanic Andisols.” Soil Science Society of America Journal 76 (2): 441–448. https://doi.org/10.2136/sssaj2011.0196.
- Hatano, R., H. Shinjo, and T. Yusuke. 2021. The Soils of Japan, 365. Singapore: Springer Nature Singapore Pte Ltd.
- Imai, T. 1964. “Geomorphic Development of Tokachi Plain, Southeastern Hokkaido.” Annals Tohoku Geography Association 16 (1): 29–34. in Japanese with abstract in English. https://doi.org/10.5190/tga1948.16.29.
- Inoue, K., and P. M. Huang. 1990. “Perturbation of Imogolite Formation by Humic Substances.” Soil Science Society of America Journal 54 (5): 1490–1497. https://doi.org/10.2136/sssaj1990.03615995005400050046x.
- IUSS Working Group. 2015. World Reference Base for Soil Resources 2014, Update 2015: International Soil Classification System for Naming Soils and Creating Legends for Soil Maps. World Soil Resources Reports No. 106. Rome: FAO.
- Japan Metrological Agency. 2022. “Monthly Data from 1991 to 2021.” Accessed December 1, 2022. https://www.data.jma.go.jp/obd/stats/etrn/view/monthly_s3_en.php?block_no=47417&view=1.
- Kanda, T., Y. Takata, K. Kohyama, and H. Obara. 2016. “Soil Map of Hokkaido Developed with the Comprehensive Soil Classification System of Japan, First Approximation: Change of Andosols Distribution Area in the Forest.” Japanese Journal of Soil Science and Plant Nutrition 87:184–192. https://doi.org/10.20710/dojo.87.3_184.
- Kato, T., K. Niwa, R. Kinoshita, H. Hashimoto, and M. Tani. 2019. “Morphological Features and Physic–Chemical Properties of Soil Profiles Developed on Several River Terraces Different of Formation Age, Tokachi District, Hokkaido.” Pedologist 63 (1): 26–37.
- Kikuchi, K. 2008. Terraced Soil and Agriculture – How to Utilize the Tokachi Plain Most Effectively. Tokyo: Kokon Shoin.
- Kilic, K., S. Kilic, and R. Kocyigit. 2012. “Assessment of Spatial Variability of Soil Properties in Areas Under Different Land Use.” Bulgarian Journal of Agricultural Science 18 (5): 722–732.
- Kimura, M., H. Otsuki, Y. Kondo, R. Kondo, S. Sasaki, T. Sase, M. Tanaka, M. Tamura, and H. Fujiyama. 1970. “On the Ancient Sand Dunes in the Tokachi Plain, Hokkaido - Part I.” Daiyonki-Kenkyu (Quaternary Research) 9 (2): 41–52. https://doi.org/10.4116/jaqua.9.41.
- Kinoshita, R., O. Roupsard, T. Chevallier, A. Albrecht, S. Taugourdeau, Z. Ahmed, and H. M. van Es. 2016. “Large Topsoil Organic Carbon Variability is Controlled by Andisol Properties and Effectively Assessed by VNIR Spectroscopy in a Coffee Agroforestry System of Costa Rica.” Geoderma 262:254–265. https://doi.org/10.1016/j.geoderma.2015.08.026.
- Kirkels, F. M. S. A., L. H. Cammeraat, and N. J. Kuhn. 2014. “The Fate of Soil Organic Carbon Upon Erosion, Transport and Deposition in Agricultural Landscapes – a Review of Different Concepts.” Geomorphology 226:94–105. https://doi.org/10.1016/j.geomorph.2014.07.023.
- Kweon, G., E. Lund, and C. Maxton. 2013. “Soil Organic Matter and Cation Exchange Capacity Sensing with On-The-Go Electrical Conductivity and Optical Sensors.” Geoderma 199:80–89. https://doi.org/10.1016/j.geoderma.2012.11.001.
- Larkin, D., G. Vivian-Smith, and J. B. Zedler. 2006. “Topographic Heterogeneity Theory and Ecological Restoration.” In Foundations of Restoration Ecology, edited by D. A. Falk, M. A. Palmer, and J. B. Zedler, 142–164. Washington, DC, USA: Island Press.
- Machida, H., and F. Arai. 1992. Atlas of Tephra in and Around Japan, 276p. Tokyo: University of Tokyo Press.
- Machida, H., and F. Arai. 2003. Volcanic Ash Atlas New Edition. Tokyo: The University of Tokyo Press.
- Manrique, L. A., C. A. Jones, and P. T. Dyke. 1991. “Predicting Cation-Exchange Capacity from Soil Physical and Chemical Properties.” Soil Science Society of America Journal 55 (3): 787–794. https://doi.org/10.2136/sssaj1991.03615995005500030026x.
- Matus, F., C. Rumpel, R. Neculman, M. Panichini, and M. L. Mora. 2014. “Soil Carbon Storage and Stabilization in Andic Soils: A Review.” Catena 120:102–110. https://doi.org/10.1016/j.catena.2014.04.008.
- McBride, M. B. 1994. Environmental Chemistry of Soils. New York: Oxford University Press.
- Ministry of Agriculture, Forestery and Fisheries, Japan. 2020. “2020 Agriculture and Forestry Census.” Accessed October 19, 2023. https://www.maff.go.jp/j/tokei/census/afc/2020/
- Mizota, C., and L. P. van Reeuwijk. 1989. Clay Mineralogy and Chemistry of Soils Formed in Volcanic Material in Diverse Climatic Regions. 2nd ed. Wageningen: ISRIC.
- Moser, K., C. Ahn, and G. Noe. 2007. “Characterization of Microtopography and Its Influence on Vegetation Patterns in Created Wetlands.” Wetlands 27 (4): 1081–1097. https://doi.org/10.1672/0277-5212(2007)27[1081:COMAII]2.0.CO;2.
- Mouni, L., L. Belkhiri, D. Merabet, and A. Bouzaza. 2013. “Monometal and Competitive Sorption of Heavy Metals in Mine Soils: Influence of Mine Soil Characteristics.” Environmental Science ESAIJ 8 (3): 94–102.
- Mouni, L., D. Merabet, D. Robert, and A. Bouzaza. 2009. “Batch Studies for the Investigation of the Sorption of the Heavy Metals Pb2+ and Zn2+ Onto Amizor Soil (Algeria).” Geoderma 154 (1–2): 30–35. https://doi.org/10.1016/j.geoderma.2009.09.007.
- Nanzyo, M. 1997. “Phosphate Absorption Coefficient.” Methods of Soil Environment Analysis, 262–264. Tokyo: Hakuyusha.
- Nanzyo, M., R. Dahlgren, and S. Shoji. 1993. “Chemical Characteristics of Volcanic Ash Soils.” Developments in Soil Science 21:145–187. https://doi.org/10.1016/S0166-2481(08)70267-8.
- Nanzyo, M., T. Y. Uhm, and S. Shoji. 1992. “Effect off Exchangeable Cations on the Phosphate Sorption Coefficient of the Cultivated Soils.” Japanese Journal Soil Science and Plant Nutrition 63:559–565. https://doi.org/10.20710/dojo.63.5_559.
- Niwa, K., O. Nagata, J. Yokobori, M. Wakabayashi, and C. Hongo. 2019. “Estimation of Phosphate Absorption Coefficients from Surface-Soil Carbon Concentrations in Volcanic Acid Soil Areas of the Tokachi Region, Hokkaido.” Pedologist 63 (1): 38–42. (in Japanese).
- Niwa, K., J. Yokobori, C. Hongo, and O. Nagata. 2011. “Estimating Soil Carbon Stocks in an Upland Area of Tokachi District, Hokkaido, Japan, by Satellite Remote Sensing.” Soil Science and Plant Nutrition 57 (2): 283–293. https://doi.org/10.1080/00380768.2011.557769.
- Niwa, K., J. Yokobori, A. Yoneyama, and H. Shinagawa. 2016. “The Monitoring of Soil Information within an Agricultural Field Using Low-Altitude Remote Sensing.” Water, Land and Environmental Engineering 84 (9): 749–752. (in Japanese).
- Obara, H., and M. Nakai. 2004. “Available Phosphate of Arable Lands in Japan: Changes of Soil Characteristics in Japanese Arable Lands (2).” Japanese Journal of Soil Science and Plant Nutrition 75 (1): 59–67.
- Pebesma, E. J. 2004. “Multivariable Geostatistics in S: The GSTAT Package.” Computers and Geosciences 30 (7): 683–691. https://doi.org/10.1016/j.cageo.2004.03.012.
- Peel, M. C., B. L. Finlayson, and T. A. Mcmahon. 2007. “Updated World Map of the Köppen-Geiger Climate Classification.” Hydrology and Earth System Sciences 11 (5): 1633–1644. https://doi.org/10.5194/hess-11-1633-2007.
- Pretty, J., and Z. P. Bharucha. 2014. “Sustainable Intensification in Agricultural Systems.” Annals of Botany 114 (8): 1571–1596. https://doi.org/10.1093/aob/mcu205.
- RStudio Team. 2021. RStudio: Integrated Development for R. RStudio. PBC. Boston. URL. http://www.rstudio.com.
- Saigusa, M., S. Shoji, and M. Otowa. 1991. “Clay Mineralogy of Two Andisols Showing a Hydrosequence and Its Relationships to Their Physical and Chemical Properties.” Pedologist 35 (1): 21–33.
- SAS Intitute Inc. 2023. JMP Pro, Version 16.1. North Carolina. URL. https://community.jmp.com.
- Schollenberger, C. J., and R. H. Simon. 1945. “Determination of Exchange Capacity and Exchangeable Bases in Soil-Ammonium Acetate Method.” Soil Science 59 (1): 13–24. https://doi.org/10.1097/00010694-194501000-00004.
- Shoji, S., R. Dahlgren, and M. Nanzyo. 1993. “Chapter 3 Genesis of Volcanic Ash Soils.” Developments in Soil Science 21:37–71. https://doi.org/10.1016/S0166-2481(08)70264-2.
- Soil Survey Staff. 2014. Keys to Soil Taxonomy. 12th ed. Washington, DC: USDA-Natural Resource Conservation Service.
- Song, F. F., M. G. Xu, Y. H. Duan, Z. J. Cai, S. L. Wen, X. N. Chen, W. Q. Shi, and G. Colinet. 2020. “Spatial Variability of Soil Properties in Red Soil and Its Implications for Site-Specific Fertilizer Management.” Journal of Integrative Agriculture 19 (9): 2313–2325. https://doi.org/10.1016/S2095-3119(20)63221-X.
- SZ DJI Technology Co., Ltd. 2023. “Phantom 4 RTK.” Shezhen 518057. URL https://www.dji.com.
- Tani, M., and R. Kinoshita. 2020. “Evaluating Accumulation and Consumption of Some Elements in Arable Andosols of Tokachi District.” Japanese Journal of Soil Science and Plant Nutrition 91 (3): 137–146.
- Tani, M., C. Mizota, T. Yagi, T. Kato, and M. Koike. 2010. “Vertical Distribution and Accumulation of Phosphate in Virgin Soils and Arable Soils of Tokachi District, Hokkaido.” Japanese Journal of Soil Science and Plant Nutrition 81 (4): 350–359.