Abstract
Ayurveda is the intangible Cultural Heritage of India and “Sitopaladi churna”, is a renowned Ayurvedic formulation which is recommended to treat the ailment like viral infection of respiratory tract, allergic situations and used as a natural anti-oxidant. The fundamental concerns in quality control of Sitopaladi churna arise due to substitution, omission, adulteration in the ingredients of Siitopaladi churna. A novel method based on Fourier transform infrared technique with attenuated total reflectance facility with a diamond Attenuated total reflectance crystal was used to evaluate samples of Sitopaladi churna. Total 35 different samples including standardized in house samples were studied. For, Fourier transform infrared spectroscopic study transmittance mode was kept to record the spectra devoid of pellets of potassium bromide. Further treatment was given with multi component tools by considering fingerprint region of the spectra. Multivariate analysis was performed by various chemometric methods like Principal component analysis and Hierarchical cluster analysis for further analysis to evaluate the differences in market samples of Sitopaladi churna. The developed method was inexpensive, simple, rapid, precise and stable. Thus, the method can be used as an efficient and practical approach for quality assessment of Sitopaladi churna.
Disclosure statement
No potential conflict of interest was reported by the author(s).
Figure 1. Attenuated total reflectance – Fourier transform infrared spectroscopy spectrum for inhouse standard sample of Sitopaladi churna sample 1, sample 34 in .
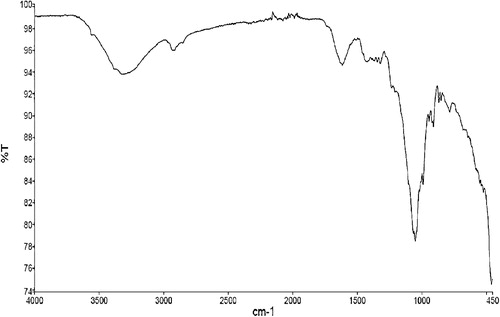
Figure 2. Attenuated total reflectance – Fourier transform infrared spectroscopy spectrum for inhouse standard sample of Sitopaladi churna sample 1, sample 35 in .
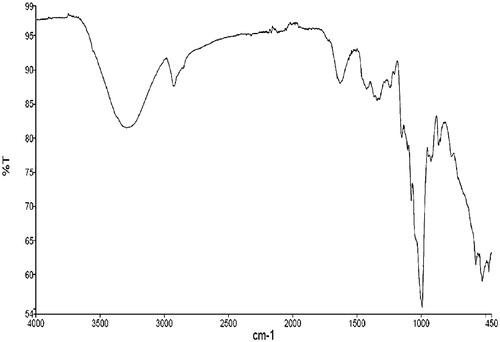
Figure 3. Score plot of principal component analysis for different Sitopaladi churna samples on the basis of first two principal components.
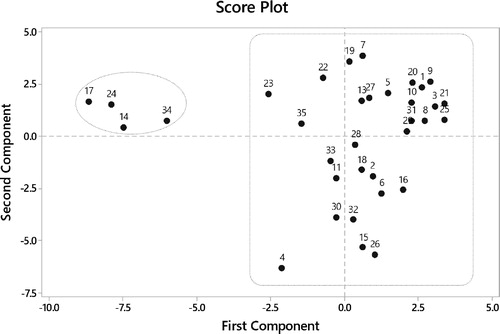
Figure 4. Scree plot of principal component analysis for different Sitopaladi churna samples.
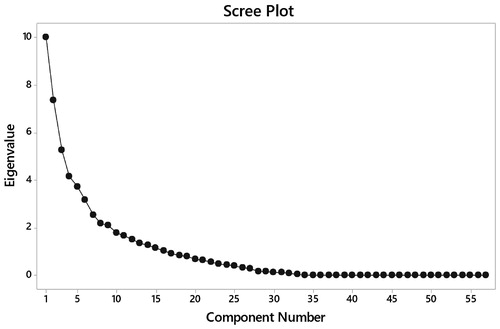
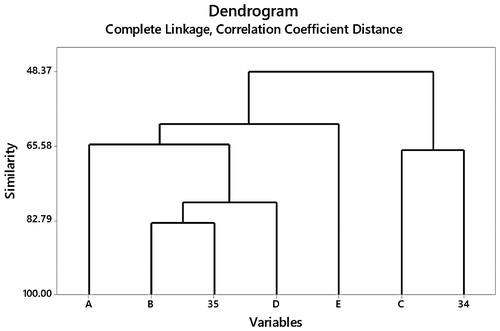
Figure 5. Dendrogram obtained by hierarchical cluster analysis of spectroscopic data of Sitopaladi churna samples.
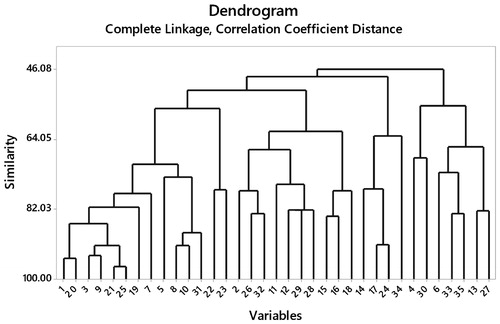
Figure 6. Score plot of principal component analysis for five newly purchased Sitopaladi churna market samples-A, B, C, D, and E on the first two principal components as a validation.
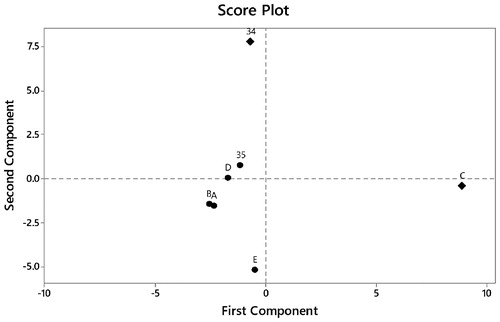
Figure 7. Dendrogram obtained by hierarchical cluster analysis for five newly purchased Sitopaladi churna market samples-A, B, C, D, and E as a validation.