
 ?Mathematical formulae have been encoded as MathML and are displayed in this HTML version using MathJax in order to improve their display. Uncheck the box to turn MathJax off. This feature requires Javascript. Click on a formula to zoom.
Abstract
The pH value is an important indicator for determining water quality, and visible near-infrared (Vis-NIR) spectroscopy is an ideal technique for rapid detection. The Vis-NIR spectrum of water is greatly affected by temperature. When using Vis-NIR spectroscopy to detect the pH value of water, temperature interference will affect the prediction accuracy of the water pH value. In this study, several chemometric methods developed in recent years were used to correct the spectra of distilled water samples under temperature interference to improve the prediction accuracy of water pH values. Specifically, this includes the external parameter orthogonalization (EPO) algorithm and the generalized least square weighting (GLSW) algorithm. Spectra of distilled water samples at different temperatures in the 400–1049 nm range were collected, and the correction effects of the EPO algorithm and the GLSW algorithm on the spectra after temperature changes, as well as the prediction errors of water pH values, were tested and examined, compared with traditional full-temperature spectral correction models. The results show that both the EPO algorithm and the GLSW algorithm methods require only a small number of representative samples to obtain filtering matrices. By correcting the spectra of distilled water samples at all temperatures to the reference temperature level, good correction effects can be achieved. Additionally, the prediction accuracy of water pH values of the models corrected by both methods is better than that of the traditional method, and the complexity of the models is also greatly reduced.
Introduction
With rapid economic development and urbanization in recent years, the demand for water resources has continued to rise, and water quality problems have gradually evolved into a global challenge.[Citation1] As one of the important indicators of water quality, the pH value is related to the chemical changes in nature and the production process, and also profoundly affects the health of ecosystems and organisms.[Citation2] Grasping the changes in water quality pH is beneficial to monitoring the metabolic level of living organisms, which helps to promote water pollution control and water resource protection, and to ensure ecological balance, water quality safety as well as human health. Traditional methods for detecting water pH values mainly include pH paper testing and electrode methods.[Citation3–5] Although pH paper testing is simple to operate, its measurement accuracy is low and prone to secondary pollution. While electrode methods have relatively accurate advantages, they are cumbersome to operate, have long measurement cycles, are susceptible to electrode contamination and aging, and are difficult to meet continuous monitoring needs. Therefore, establishing an accurate, rapid, environmentally friendly, and sustainable online detection method for water pH values is of great significance.
Visible near-infrared (Vis-NIR) spectroscopy analysis technology is a widely applied and highly effective advanced analytical technique.[Citation6] It comprehensively showcases various professional fields such as data processing technology, spectroscopy, and chemometrics, featuring environmental friendliness, agility, rapidity, and online detectability. This technology demonstrates high economy and rapidity in real-time quality monitoring and analysis of large quantities of samples. It has been widely applied in chemistry,[Citation7] agriculture,[Citation8] pharmaceuticals,[Citation9] food,[Citation10] environmental monitoring,[Citation11] and other fields. Within the wavelength range of Vis-NIR spectroscopy, the main functional groups producing fundamental vibrations are hydrogen-containing groups (C-H, O-H, N-H, etc.). The absorption frequency characteristics of O-H in water are strong and easily absorbed by Vis-NIR light. Therefore, by combining Vis-NIR spectroscopy technology with chemometric methods, quantitative analysis of water pH values can be achieved, enabling online continuous monitoring. Li et al.[Citation12] collected Vis-NIR spectra of water quality samples using a grating spectrometer and established a Vis-NIR spectrum prediction model using a one-dimensional convolutional neural network (1D-CNN) with three convolutional layers. The results indicate that this method can be used for rapid detection of water quality pH levels while achieving good prediction accuracy. To measure the water quality parameters of wastewater, Qiu et al.[Citation13] analyzed the near-infrared spectrum of wastewater in the spectral range of 4000 cm−1 to 12,500 cm−1. They preprocessed the spectra using second derivatives (2D), Savitzky-Golay (S-G) smoothing, and standard normal variate. A prediction model was established using partial least squares. The results showed that the coefficient of determination for the pH value of the wastewater was 0.87, providing a reference for online monitoring of wastewater quality. The Vis-NIR spectroscopy can reflect the vibrational information of internal groups such as O-H and C-H. As a type of molecular vibration spectroscopy, the absorption in the Vis-NIR region primarily arises from molecular vibrational and rotational transitions. When temperature changes, molecular vibrations intensify or diminish, altering intermolecular forces and affecting the transitions between different energy levels, thereby influencing molecular vibration spectra.[Citation14,Citation15] Although water, as a natural biological matrix, consists of small molecules, it contains strong hydrogen bonds, with absorption bands of hydroxyl groups across the electromagnetic spectrum from 100 nm to 100 μm. The O-H bond in aqueous solutions is affected by temperature, leading to changes in O-H vibrations and rotations, which subsequently alter the absorption band shape in the near-infrared spectrum, affecting the absorption wavelengths and intensities of the O-H group in the Vis-NIR spectrum.[Citation16,Citation17] In practical detection environments, water temperature fluctuates significantly, and using models established at room temperature for water pH value detection may not achieve the desired accuracy, severely limiting the practicality of the model. Therefore, when using Vis-NIR spectroscopy analysis technology to detect water pH values, the influence of temperature cannot be ignored.
With the continuous advancement of chemometric methods research, many spectral preprocessing methods targeting external interfering variables such as temperature have emerged. These include external parameter orthogonalization (EPO),[Citation18,Citation19] generalized least square weighting (GLSW),[Citation20] piecewise direct standardization (PDS),[Citation21] and orthogonal signal correction (OSC).[Citation22] The principle of these methods is to create a temperature-filtering matrix to correct spectra at non-reference temperatures, ensuring their accuracy at the reference temperature for subsequent prediction analysis. Additionally, models can be built using wavelength variables insensitive to temperature or by using spectral data at various temperatures to construct overall temperature models, establishing predictive models unaffected by external temperature fluctuations to ensure reliable prediction performance under different temperature conditions.[Citation23] Among these methods, both EPO and GLSW have advantages in correcting temperature effects as they effectively suppress temperature interference while maintaining low modeling complexity. Compared to traditional multivariate modeling methods, EPO and GLSW require only a small amount of data, with just a few representative samples collected at different temperatures for spectral data. By establishing a temperature filtering matrix to correct spectra, the workload for temperature correction is significantly reduced, simplifying model complexity. Studies have reported that EPO and GLSW are effective in eliminating interfering variables in various fields. For instance, in the detection of certain substance content in fruits and vegetables. Roger et al.[Citation24] first proposed the EPO method and applied it to determine apple sugar content under temperature interference, achieving excellent detection results. Li et al.[Citation19] proposed a method combining EPO with wavelength selection algorithms, which effectively reduced the interference of moisture in the near-infrared spectroscopy detection of corn starch content, thereby improving the model’s accuracy. Sun et al.[Citation25] used a portable near-infrared spectrometer combined with global models, EPO, and GLSW methods to correct temperature and sunlight effects on grape spectra for detecting the distribution of soluble solids content in grapes outdoors, demonstrating the feasibility of using portable near-infrared spectrometers with EPO or GLSW methods for outdoor detection of grape soluble solids content while considering temperature and sunlight effects on spectra. In the detection of soil organic matter (SOM) content, Minasny et al.[Citation18] and Santana et al.[Citation26] used the EPO method to eliminate the influence of soil moisture in near-infrared spectroscopy, improving the calibration and prediction of SOM and soil organic carbon (SOC) content. Roudier et al.[Citation27] employed both direct standardization (DS) and EPO methods to mitigate the effects of soil moisture in the prediction of SOC using Vis-NIR spectroscopy. The results showed that while both DS and EPO methods could reduce the impact of soil moisture on Vis-NIR spectroscopy, the SOC prediction accuracy of the EPO method was significantly better than that of the DS method. Additionally, in the detection of sucrose concentration and other substances, Acharya et al.[Citation28] compared the robustness of models built using OSC, EPO, and GLSW methods for predicting sucrose content in aqueous solutions under temperature changes, with results showing that the correction effects of EPO and GLSW were superior to OSC. Hans et al.[Citation29] used the EPO method to eliminate the influence of temperature and moisture on predicting the calorific value of biomass. In summary, both EPO and GLSW methods effectively eliminate external interfering variables such as temperature and humidity during the detection of various substance contents. Compared to methods like DS, PDS, and OSC, EPO and GLSW achieve better correction results. Additionally, EPO and GLSW methods are mostly applied to the detection of solid sample content, with relatively few studies on water detection. For water quality pH detection, temperature variations significantly interfere with the accuracy of Vis-NIR spectroscopy quantitative analysis. Therefore, applying EPO and GLSW methods to correct for temperature interference in the Vis-NIR spectroscopy detection of water quality pH is a worthwhile area of research and exploration.
This study aimed to address the issue of temperature-induced spectral drift affecting the accuracy of water quality detection. An analysis and research were conducted on the effects of temperature on Vis-NIR spectra and detection models, as well as temperature correction methods. By designing a selection plan for typical samples, a temperature-based experimental study on water pH value detection was conducted. Two correction models were established, one using the EPO method and the other using the GLSW method. The effectiveness of the EPO and GLSW methods was studied through basic experiments with distilled water temperature, and compared with traditional multivariate correction methods. The advantages of these methods over traditional multivariate correction methods were validated in terms of model complexity and spectral prediction capability after correction.
Materials and methods
Sample preparation
By adding a certain amount of 0.1 mol/L HCl standard solution or 0.1 mol/L NaOH standard solution into a beaker containing distilled water randomly and mixing it uniformly, the preparation of experimental samples is completed. A total of 30 distilled water samples with different pH values were prepared, and the pH values of each sample were measured using the pH meter (Shanghai Lichen-BX Instrument Co., Ltd., Shanghai, China). To ensure accuracy, the acidity meter was calibrated with pH standard buffer solution before measuring the pH values, and each sample was measured three times. The average value was then taken to determine the pH reference value for each sample. The final distribution range of pH values for the 30 samples prepared was 3.6 to 8.37, with an average of 6.60 and a standard deviation of 1.52.
The same method was used to prepare another 30 distilled water samples with different pH values to avoid the randomness of experimental results. Their pH values ranged from 3.26 to 10.55, with an average of 7.02 and a standard deviation of 2.10.
Vis-NIR spectroscopy measurement
The spectra acquisition system consists of a light source (HL-2000-LL), two transmission fibers, and a grating spectrograph (FLAME-T-XR1-RS, Ocean Optics Inc., Orlando, FL). The wavelength range was 400–1049 nm and the spectra resolution was 2860 pixels. Each sample was placed in a 10 mm quartz cell. Spectrometer parameters include an integration time of 20 ms, smoothing of 3, and average times of 100. Adopted transmission measurements to obtain the spectral and record the absorbance value as the spectra data. Before spectra acquisition, both the light source and the spectrometer were preheated for 30 min to enhance instrument stability and accuracy. Additionally, by adjusting the electric thermostat (HSB-70BE, Shanghai Lichen-BX Instrument Co., Ltd.) to reach the set temperature and keeping the distilled water sample stable at this temperature, the temperature adjustment accuracy of the electric thermostat can reach 0.1 °C. The temperature range for sample collection was set from 10 °C to 40 °C, with spectra data collected for all distilled water samples at intervals of 5 °C. Spectra data for 30 distilled water samples at temperatures of 10 °C, 15 °C, 20 °C, 25 °C, 30 °C, 35 °C, and 40 °C were sequentially obtained. Meanwhile, spectra data of samples at 25 °C were selected as the reference spectra.
To improve spectral quality and facilitate analysis, S-G smoothing was employed to improve the quality and minimize noise. The polynomial order was 2, and the point size was 7.
Temperature correction methods
EPO
The EPO algorithm was first proposed by Roger et al. in 2003 and has been widely applied in the fields of spectroscopy and chemical analysis.[Citation24] Built upon principal component analysis, the EPO algorithm aims to minimize the correlation between external parameters, making them easier to handle and correct during statistical analysis or model building.
The core idea of the EPO algorithm is to map the spectral data of samples into an orthogonal space of external interfering factors, thereby eliminating the influence of these factors. In this experiment, the pH value Vis-NIR absorbance spectral data X of the collected distilled water samples can be represented as EquationEq. (1)(1)
(1) .
(1)
(1)
In EquationEq. (1)(1)
(1) , P represents the projection matrix of useful spectral information, Q represents the projection matrix of temperature interference on the spectra, and R is the residual matrix. The objective of the EPO algorithm is to obtain a corrected effective spectral matrix by correcting temperature interference, that is, X* = XP. Therefore, the core step in the EPO algorithm is to compute the P matrix. The main steps for calculating the projection matrix P of the useful part of the spectrum in the EPO algorithm are as follows:
First, calculate the difference matrix D of the spectral data collected at different temperatures, as shown in EquationEq. (2)(2)
(2) .
(2)
(2)
where Xi represents the spectral matrix collected at different temperatures, and Xj represents the spectral matrix collected at the reference temperature.
Then, perform singular value decomposition on the covariance matrix of D, as shown in EquationEq. (3)(3)
(3) .
(3)
(3)
where U represents the left singular matrix, S represents the diagonal matrix of singular values, and V represents the right singular matrix.
Next, define the number of factors c in the EPO algorithm, take the first c columns of the V matrix to form a new right singular matrix VS, ideally, and the first c singular values account for over 99% of the total. Calculate the projection matrix Q of the useless information in the spectrum and then calculate the projection matrix P of the useful information, as shown in EquationEqs. (4)(4)
(4) and Equation(5)
(5)
(5) .
(4)
(4)
(5)
(5)
where E represents the identity matrix.
GLSW
The generalized least square weighted (GLSW) algorithm, similar to the EPO algorithm, aims to filter spectra collected under different temperature conditions to eliminate spectral differences caused by temperature variations, thereby obtaining a useful spectral matrix, that is, X* = XP. Therefore, the key to this method is also to compute the filtering matrix P. However, the core step of the GLSW algorithm lies in adjusting the weights to reduce the influence of external interference (temperature) on spectral variations relative to internal variables.[Citation30] The steps for calculating the matrix P in the GLSW algorithm are as follows:
Assuming there are two sets of sample spectra under different temperatures, the difference matrix D is obtained after centralization processing, as shown in EquationEq. (6)(6)
(6) .
(6)
(6)
where X1 and X2 are the sample spectral matrices after centralization processing.
Then, calculate the covariance matrix C of the difference matrix D, as shown in EquationEq. (7)(7)
(7) .
(7)
(7)
Decompose the covariance matrix C to obtain the left eigenvector V and the diagonal matrix of singular values S, as shown in EquationEq. (8)(8)
(8) .
(8)
(8)
Next, calculate the ridge of the diagonal matrix S, as shown in EquationEq. (9)(9)
(9) .
(9)
(9)
where α is the weight parameter, and I is the identity matrix.
Finally, compute the filtering matrix P, as shown in EquationEq. (10)(10)
(10) .
(10)
(10)
Typical sample selection for establishing temperature correction models
Sample set partitioning
When establishing temperature correction models using both the EPO and GLSW methods, temperature filtering matrices can be established using a subset of typical samples selected from the calibration set of distilled water samples with different pH values. Therefore, the sample set partitioning based on the joint X-Y distances (SPXY) method is adopted to partition the sample set.
The SPXY method is an improved sample partitioning method based on the Kennard-Stone method, first proposed by Galvao et al.[Citation31] The SPXY method considers both the spectral reflectance data X and the measurements of physicochemical indicators Y when calculating distances between samples. The distance formula is as follows.
(11)
(11)
(12)
(12)
(13)
(13)
where N is the total number of samples in the sample set, J is the total number of spectral wavelengths, and xp(j) and xq(j) are the spectral reflectance of samples p and q at the jth wavelength, respectively.
Typical samples selection
Typical samples can represent the characteristics and trends of the entire dataset, thereby improving the accuracy and reliability of the model during the prediction process. By selecting typical samples, the complexity of the dataset can be reduced, simplifying the construction and prediction processes of the model, thus reducing computational costs and time consumption.[Citation32] Typical samples are generated from the correction set, and the SPXY sample set partitioning method divides the sample dataset collected at the reference temperature (25 °C) into calibration and prediction sets in a ratio of 2:1. Taking distilled water dataset 1 as an example, three typical sample selection methods, marked A, B, and C, were designed to construct the EPO algorithm correction model. The selection results of the typical samples are shown in . Among them, Method A selects three samples with the highest acidity, pH = 7, and the highest alkalinity, respectively. Method B selects ten samples with a uniform distribution of pH values from the distilled water samples. Method C selects all samples from the calibration set.
Table 1. The selection results of typical samples.
Establishment of prediction model
Partial least squares regression (PLSR) is a linear regression method used to establish multivariate calibration models.[Citation33] PLSR introduces latent variables (LVs) to project the independent and dependent variables into a lower-dimensional space, thereby reducing the impact of collinearity. The process of establishing a PLSR model is as follows:
Decompose the spectral matrix X and the physicochemical value matrix Y as shown in EquationEqs. (14)(14)
(14) and Equation(15)
(15)
(15) .
(14)
(14)
(15)
(15)
where T, P, and E distributions represent the score, principal component, and residual matrix of X; U, Q, and F represent the score, principal component, and residual matrix of Y, respectively.
Perform linear regression on T and U as shown in EquationEq. (16)(16)
(16) .
(16)
(16)
where B represents the regression coefficient matrix, calculated as shown in EquationEq. (17)
(17)
(17) .
(17)
(17)
Calculate the predicted values of unknown samples YP by multiplying the unknown sample matrix XP with the corrected matrix PV, as shown in EquationEq. (18)(18)
(18) .
(18)
(18)
Before establishing the PLSR model, a five-fold cross-validation of the calibration set data is necessary. During the five-fold cross-validation, the optimal number of LVs for the PLSR model is selected based on the obtained root mean square error of cross-validation (RMSECV) values. Five-fold cross-validation not only avoids over-reliance on a single validation set but also aids in selecting the most appropriate model parameters to achieve optimal predictive performance.
Model evaluation indicators
Model accuracy evaluation performance indicators are tools used to measure the performance of established multivariate calibration models, verify the performance and accuracy of the model, and select the most suitable method.[Citation34,Citation35] The model accuracy evaluation indicators used in this study include the correlation coefficient of prediction (RP) and the root mean square error of prediction (RMSEP). A lower RMSEP and an RP closer to 1 indicate a better correlation between predicted values and true values, indicating a stronger predictive ability and higher prediction accuracy of the PLSR model.[Citation34] The specific formulas are as follows.
(19)
(19)
(20)
(20)
where n represents the number of samples, ŷi and yi represent the predicted and true values of the ith sample in the prediction set, respectively.
Software
All algorithm programs were implemented in MATLAB 2018a (MathWorks, Natick, MA) under the Windows 11 operating system.
Results and discussion
Influence of temperature on the Vis-NIR spectra of water pH value
The absorbance spectra of distilled water samples with pH = 7 measured at seven temperature conditions (10 °C, 15 °C, 20 °C, 25 °C, 30 °C, 35 °C, and 40 °C) are shown in . It can be observed that the spectral shapes and overall trends of the Vis-NIR spectra of the sample at these seven temperature gradients are essentially consistent. The peak around 960 nm is primarily attributed to the strong absorption characteristic of the O-H group in water, which is absorbed by the Vis-NIR spectra. However, with temperature changes, the molecular vibration states in the distilled water sample change, affecting the absorbance of the sample spectra at different temperatures. Additionally, specific absorption peaks in the spectra shift in wavenumber with temperature fluctuations. This indicates that the collected distilled water samples not only contain information related to the sample’s characteristics but also contain signals related to temperature. Therefore, when the temperature changes, the spectral characteristics of the same distilled water sample also change accordingly.
Figure 1. Visible near-infrared spectrogram of a distilled water sample with pH = 7 at seven different temperatures. The wavelength range was 400–1049 nm and the spectra resolution were 2860 pixels. The sample was placed in a cuvette with a 10 mm optical path length. The spectrometer parameters included an integration time of 20 ms, smoothing of 3, and average times of 100. Transmission measurement was used to obtain the spectra, and absorbance values were recorded as the spectral data.
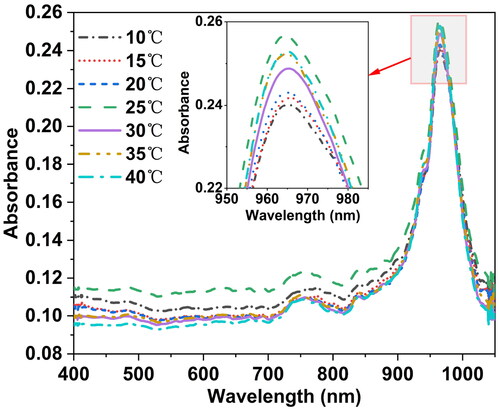
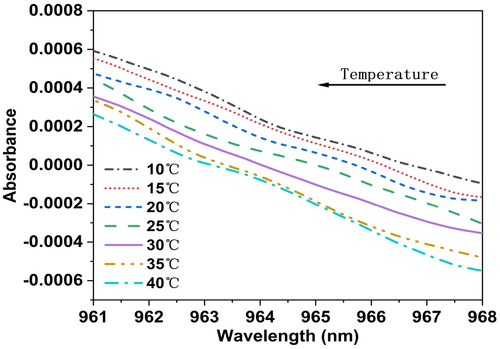
In , the spectrum peak near the 960–970 nm wavelength range of distilled water at pH 7 is magnified. The changes in absorbance values of this sample at the spectrum peak are observed at seven different temperatures, with the peak position showing significant variations with temperature. Despite observing the spectrum peak, no orderly trend was found in its behavior with temperature changes. To further investigate the dynamic trend of temperature variation on the spectrum peak near 960–970 nm, preprocessing was done by taking the first derivative of all spectra at each temperature. The spectra after the first derivative preprocessing within the 960–970 nm wavelength range are magnified, as shown in . It can be seen that after the first derivative, there is a trend of leftward shift in the spectra around the 965 nm wavelength with increasing temperature, indicating a gradual shift of the absorption peak toward higher frequency bands. This is due to specific spectral absorption by O-H groups in water molecules during molecular motion, which correlates positively with temperature and increases molecular vibrational energy. As temperature rises, the vibrational energy of water molecules increases, leading to an increase in vibration frequency and consequently shifting the absorption peak toward higher frequency bands.
Figure 2. Magnification of spectra near 960 nm after first derivative processing. It can be observed that, with increasing temperature, the first derivative of the spectrum of distilled water samples with pH = 7 shows a trend of shifting toward the left around the zero point near 960 nm.
Influence of temperature on the prediction model of water pH value
To investigate the influence of temperature on the prediction model of water pH value, distilled water dataset 1 was utilized. Using the SPXY method, the collected dataset of 30 distilled water samples with varying pH values was divided into calibration and prediction sets at a ratio of 2:1. Subsequently, PLSR prediction models were established using the calibration set at each single temperature and applied to the corresponding prediction sets. The RMSEP results of the distilled water pH values predicted by the PLSR models based on Vis-NIR spectroscopy at different temperatures are presented in .
Table 2. The root mean square error of the prediction sets at different temperatures was obtained using the partial least squares regression model for the visible near-infrared spectra of distilled water samples with different pH values.
From , it is evident that the minimum RMSEP value for each row occurs along the diagonal of the table, indicating that the best prediction accuracy is achieved when the modeling temperature matches the prediction temperature. Particularly, when both the modeling and prediction temperatures are 25 °C, the model demonstrates the optimal prediction accuracy, with an RMSEP value of 0.9574. This suggests a certain correlation between the prediction accuracy of the Vis-NIR spectroscopy model for distilled water pH values and the sample temperature. Analyzing the trend of the results in the table, it is observed that as the difference between the modeling and prediction temperatures increases, the prediction accuracy of the constructed model gradually decreases. The modeling approach uses distilled water samples at a single temperature as the calibration set to build the PLSR prediction model for pH values and uses samples at different temperatures as the prediction set, revealing the model’s adaptation level to different temperature conditions. Research findings indicate that the Vis-NIR spectroscopy model for pH values performs more excellently and reliably when applied to samples with temperatures consistent with those of the samples used in modeling. Therefore, to achieve more accurate analytical performance, it is essential to construct prediction models corresponding to the actual temperature of the samples being tested.
Calibration model based on full spectrum of temperatures
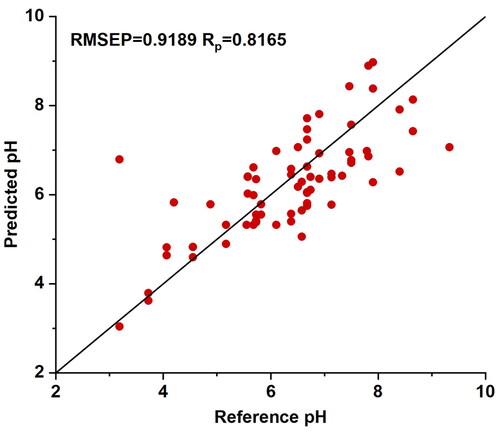
To mitigate the influence of temperature on the prediction model, a traditional multivariate calibration method was initially employed. This method globally modeled the pH values of distilled water samples under all temperature conditions using Vis-NIR spectroscopy data, aiming to construct a prediction model that encapsulates all temperature information and remains unaffected by external temperature interference. Taking distilled water dataset 1 as an example, pH values and Vis-NIR spectroscopy data were collected for 30 distilled water samples under seven different temperature conditions, resulting in a total of 210 sets of spectral data. Using the SPXY method, the dataset was divided into calibration and prediction sets at a ratio of 2:1. The pH values full-spectrum PLSR model was established using the calibration set data and utilized for prediction on the prediction set data. Based on the five-fold cross-validation of the calibration set, the optimal number of LVs is selected as 9, corresponding to the minimum RMSECV value. The PLSR model based on the full-temperature spectrum yields an RMESP of 0.9189 and an RP of 0.8165. The scatter plot of predicted results based on the full spectrum of temperatures calibration model compared to reference pH values is depicted in . The prediction performance for water pH values relative to single temperature improved.
Figure 3. The scatter plot of predicted results is based on the full spectrum of temperatures calibration model compared to reference pH values. After dividing the spectral data of 210 distilled water samples at all temperatures into sample sets using the sample set partitioning based on the joint X-Y distances, a partial least squares regression prediction model was established using the calibration set. The model was evaluated using the prediction set. The model demonstrated a good correlation between the predicted values and the reference values.
Calibration model based on EPO algorithm
To mitigate the influence of temperature on the spectroscopy of water pH values, using 25 °C as the reference temperature, the EPO algorithm was employed to calibrate the Vis-NIR spectroscopy of distilled water samples’ pH values. Subsequently, the PLSR modeling method was used to establish the prediction model after the calibration by the EPO algorithm. Taking distilled water dataset 1 as an example, the EPO algorithm process described in section 2.3.1 was applied to calibrate the spectral data of the calibration and prediction sets. The typical sample selection scheme outlined in was incorporated for PLSR modeling. Additionally, considering the EPO algorithm factor c and the number of principal components in the PLSR model, RMSEP was used as the evaluation metric for the performance of the calibration model. The results are presented in .
Table 3. The prediction results of the corrected model are based on the external parameter orthogonalization algorithm.
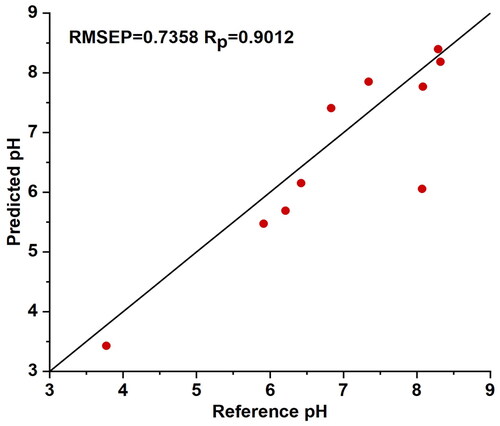
It can be observed that the calibration model established when the EPO algorithm factor c is set to 2 yields the best prediction accuracy for all three typical sample selection schemes, with method B demonstrating the optimal prediction performance among the models constructed using the three selection schemes. The scatter plot of predicted results based on the EPO-B calibration model compared to reference pH values is depicted in , with RMSEP = 0.7358 and RP = 0.9012. This indicates that employing the EPO method with a small and representative sample size for temperature calibration can achieve superior prediction accuracy, while significantly reducing the workload for modeling the temperature calibration model.
Figure 4. The scatter plot of predicted results based on the external parameter orthogonalization algorithm B calibration model compared to reference pH values. Typical samples from selection method B were used to establish a partial least squares regression model, which was then evaluated using the prediction set. The model demonstrated a good correlation between the predicted values and the reference values.
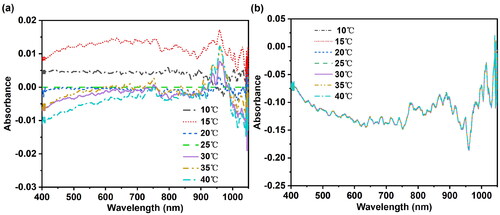
Taking sample No.18 (pH = 7) from EPO-B as an example, shows the absorbance spectra of this sample after calibration by the EPO algorithm under seven different temperature conditions. By comparing and , it can be clearly observed that temperature has a great influence on the absorbance spectrum of distilled water samples. However, after correction using the EPO method, the reproducibility of the spectra at different temperatures is significantly improved. As shown in respectively present the differential spectra before and after temperature correction. Through observation and comparison, it can be observed that after correction with the EPO method, the differential effects between the spectra are significantly enhanced, and the spectral differences at different temperatures are greatly reduced.
Figure 5. Absorbance spectra of distilled water sample (pH = 7) after calibration by the external parameter orthogonalization algorithm under seven different temperature conditions. It can be seen that after correction using the external parameter orthogonalization algorithm, the reproducibility of the spectra at different temperatures is significantly improved.
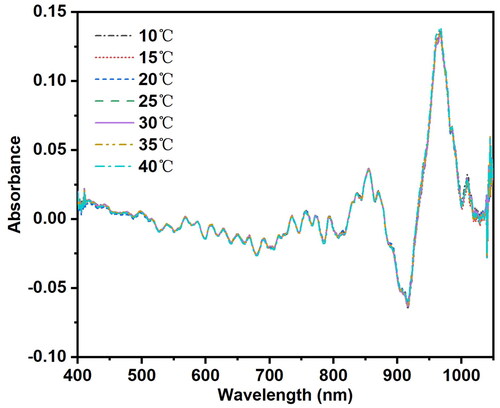
Figure 6. The differential spectra before and after temperature correction with the external parameter orthogonalization algorithm. (a) The differential spectra before temperature correction; (b) The differential spectra after temperature correction. It can be seen that after correction using the external parameter orthogonalization algorithm, the spectral differences at different temperatures are greatly reduced.
Calibration model based on GLSW algorithm
Taking distilled water dataset 1 as an example, the GLSW algorithm process described in section 2.3.2 was employed to calibrate the spectral data of the calibration and prediction sets. The typical sample selection scheme outlined in was incorporated for PLSR modeling. This algorithm requires optimization of the weight parameter α, which generally ranges from 0.0001 to 1. The α controls the degree of weighted processing, with smaller values enhancing the filtering effect.[Citation30] presents the prediction results of the GLSW-PLSR models established under different values of α, with RMSEP as the model evaluation metric.
Table 4. The prediction results of the corrected model are based on the generalized least square weighting algorithm.
From , it can be observed that for all three typical sample selection schemes, the calibration model achieves the best prediction accuracy when the weight parameter α is set to 0.001. Similar to the EPO algorithm calibration model, the GLSW algorithm also yields optimal prediction accuracy when employing sample selection method B for constructing the calibration model. The scatter plot of predicted results based on the GLSW-B calibration model compared to reference pH values is depicted in , with RMSEP = 0.7563 and RP = 0.8409. This demonstrates that the GLSW algorithm, like the EPO algorithm, achieves the best prediction accuracy when employing sample selection method B for constructing the calibration model.
Figure 7. The scatter plot of predicted results based on the generalized least square weighting algorithm B calibration model compared to reference pH values. Typical samples from selection method B were used to establish a partial least squares regression model, which was then evaluated using the prediction set. The model demonstrated a good correlation between the predicted values and the reference values.
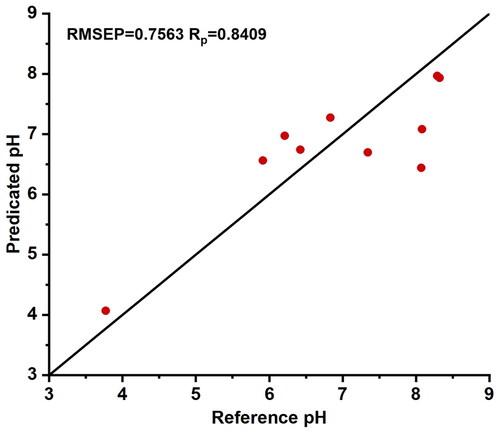
Table 5. Prediction results of different temperature calibration models for distilled water dataset 1.
Comparison of correction models
Comparative analysis of the predictive performance of models established using the temperature correction methods mentioned above was conducted, and compared with the predictive performance at a single temperature (25 °C), as listed in .
It can be observed that the models established through these three methods for temperature correction significantly outperform the single temperature (25 °C) spectral model without temperature correction in terms of accuracy and precision when predicting samples. This indicates that these three temperature correction methods demonstrate positive performance on the pH values of distilled water samples Vis-NIR spectra, thereby enhancing the stability and adaptability of the models to different temperatures. Among them, it can be observed that the predictive performance of the models corrected by the EPO and GLSW methods is superior to that of the full-temperature spectral models. This is because, in the process of temperature correction, the EPO method projects the spectra into a space orthogonal to the temperature variables, effectively filtering out the interference. The GLSW method, on the other hand, reduces the weight of spectral changes caused by temperature variables relative to those caused by internal variables, making the spectra of the same sample under different external conditions more similar. The results show that both the EPO and GLSW methods effectively eliminate the impact of temperature variations on the spectra, and PLSR modeling of the filtered spectral data can achieve high predictive accuracy. Additionally, when constructing the temperature filtering matrix, only a small number of representative samples were selected to achieve a well-performing matrix. This not only removes temperature interference but also greatly simplifies the complexity of the modeling process, reducing computational costs and time consumption.
Additionally, to avoid experimental randomness, a single-temperature model (25 °C) and a full-temperature spectral model were established for Dataset 2 following the above experimental steps. Three types of sample sets, A, B, and C, were designed based on the above typical sample division method, and different EPO correction models and GLSW correction models were established under different typical samples. The predictive results of the optimal correction models based on the EPO method and GLSW method were compared with those of the single-temperature model and full-temperature spectral model, as shown in .
Table 6. Prediction results of different temperature calibration models for distilled water dataset 2.
From , it can be observed that using distilled water dataset 2 for spectral calibration experiments, the EPO method, GLSW method, and traditional multivariate calibration method all achieve good calibration results. Among them, the prediction results of the EPO and GLSW methods are better than those of the full temperature spectrum modeling method. Additionally, these two methods require fewer samples for temperature calibration, resulting in less modeling effort.
Conclusions
Applying Vis-NIR spectroscopy technology to detect the pH value of water is a hot and cutting-edge research topic internationally. Currently, there are no commercial instruments available, primarily due to the measurement accuracy not meeting application requirements. Eliminating the influence of measurement conditions (such as temperature) on the spectrum is one of the crucial steps to improve the accuracy of Vis-NIR detection of water pH and achieve practical application. This study conducted foundational temperature experiments for pH value detection in water quality. In this experimental study, the spectra of the same sample also change with temperature variation, and the predictive performance of the model is adversely affected. Different temperature correction methods under different typical sample selection methods were used to correct the effects of temperature on the Vis-NIR spectra and models of pH values. The predictive results of models based on full-temperature spectral modeling, EPO algorithm, and GLSW algorithm after model temperature correction were compared. The study found that the EPO and GLSW methods can effectively eliminate the adverse effects and interferences caused by temperature variations on the spectra of distilled water samples in Vis-NIR detection of water pH values. This significantly enhances the spectral reproducibility of the same sample at different temperatures, effectively suppressing spectral differences under varying temperature conditions. Moreover, the predictive accuracy of the spectra corrected using the EPO and GLSW methods is significantly improved and superior to the PLSR modeling results of the spectra of samples at all temperatures. Additionally, this study evaluated the effectiveness of constructing temperature filtering matrices using representative samples with the EPO and GLSW methods. It was found that selecting a small number of representative samples to construct the temperature filtering matrix can achieve excellent filtering effects. Furthermore, the number of samples involved in modeling is significantly reduced, which decreases the workload, simplifies the modeling process, and reduces computational costs and time consumption.
The experimental results demonstrate that the EPO and GLSW methods effectively mitigate the impact of temperature on the spectra of aqueous samples. This provides theoretical support for field monitoring of water pH or other water quality parameters (e.g., total nitrogen, total phosphorus). These methods can also be extended to the detection of substance compositions in other aqueous samples, such as blood, milk, and glucose solutions, to eliminate spectral variations caused by temperature or other external interferences.
Disclosure statement
The authors report there are no competing interests to declare.
Additional information
Funding
References
- Abell, R.L.; Vigerstol, K.; Higgins, J.; Kang, S.; Karres, N.; Lehner, B.; Sridhar, A.; Chapin, E. Freshwater Biodiversity Conservation Through Source Water Protection: Quantifying the Potential and Addressing the Challenges. Aquatic Conservation: Marine and Freshwater Ecosystems 2019, 29(7), 1022–1038. DOI: 10.1002/aqc.3091.
- Dewangan, S. K.; Toppo, D. N.; Kujur, A. Investigating the Impact of pH Levels on Water Quality: An Experimental Approach. International Journal for Research in Applied Science and Engineering Technology 2023, 11(9), 756–759. DOI: 10.22214/ijraset.2023.55733.
- Kim, H.; Lim, H. K.; Cho, S.; Kim, H. J. An Anthracene Appended Guanidine Derivative as Water Soluble Fluorescence Sensor for High pH Values and Water Content Measurements. Journal of Photochemistry and Photobiology A: Chemistry 2019, 383, 112023. DOI: 10.1016/j.jphotochem.2019.112023.
- Zhang, X. X.; Zhang, W. J.; Tang, S. K. L-Tryptophan Functionalized Graphene Quantum Dots as a Fluorescence Indicator for pH Detection in Real Water. Journal of Photochemistry and Photobiology A: Chemistry 2018, 372, 71–77. DOI: 10.1016/j.jphotochem.2018.12.014.
- Rasouli, Z.; Abdollahi, H.; Maeder, M. Generalized Indicator-Based Determination of Solution pH. Analytica Chimica Acta 2020, 1109, 90–97. DOI: 10.1016/j.aca.2020.03.004.
- Chen, M. L.; Liu, Y.; Dang, Y. W.; Wang, H. Q.; Wang, N.; Chen, B.; Zhang, C. D.; Chen, H. Y.; Liu, W. W.; Fu, C. H.; Liu, L. J. Application Research of Visible Near-Infrared Spectroscopy Technology for Detecting Intracerebral Hematoma. World Neurosurgery 2023, 180, e422–e428. DOI: 10.1016/j.wneu.2023.09.082.
- Andrews, H. B.; Sadergaski, L. R. Leveraging Visible and Near-Infrared Spectroelectrochemistry to Calibrate a Robust Model for Vanadium (IV/V) in Varying Nitric Acid and Temperature Levels. Talanta 2023, 259, 124554. DOI: 10.1016/j.talanta.2023.124554.
- Gillespie, G. D.; Gowen, A. A.; Finnan, J. M.; Carroll, J. P.; Farrelly, D. J.; McDonnell, K. P. The Use of Near-Infrared Spectroscopy for the Prediction of Gaseous and Particulate Emissions from Agricultural Feedstock Pellets. Energy & Fuels 2019, 33(9), 8794–8803. DOI: 10.1021/acs.energyfuels.9b02025.
- Huang, Z. B.; Zhou, G. M.; Wang, X.; Wang, T. J.; Zhang, H. D.; Wang, Z. Z.; Zhu, B. B.; Li, W. L. Rapid and Nondestructive Identification of Adulterate Capsules by NIR Spectroscopy Combined with Chemometrics. Journal of Pharmaceutical and Biomedical Analysis 2023, 235, 115597. DOI: 10.1016/j.jpba.2023.115597.
- Ozturk, S.; Bowler, A.; Rady, A.; Watson, N. J. Near-Infrared Spectroscopy and Machine Learning for Classification of Food Powders During a Continuous Process. Journal of Food Engineering 2022, 341, 111339. DOI: 10.1016/j.jfoodeng.2022.111339.
- Rasooli, N.; Farpoor, M. H.; Mahmoodabadi, M.; Esfandiarpour-Boroujeni, I. Vis-NIR spectroscopy as an Eco-friendly Method for Monitoring Pedoenvironmental Variations and Pedological Assessments in Lut Watershed, Central Iran. Soil and Tillage Research 2023, 233, 105808. DOI: 10.1016/j.still.2023.105808.
- Li, D. S.; Li, L. N. Detection of Water pH Using Visible Near-Infrared Spectroscopy and One-Dimensional Convolutional Neural Network. Sensors (Basel, Switzerland) 2022, 22(15), 5809. DOI: 10.3390/s22155809.
- Qiu, J. L.; Guo, H. R.; Xue, Y. H.; Liu, Q. Y.; Xu, Z. Y.; He, L. Rapid Detection of Chemical Oxygen Demand, pH Value, Total Nitrogen, Total Phosphorus, and Ammonia Nitrogen in Biogas Slurry by Near Infrared Spectroscopy. Analytical Methods: advancing Methods and Applications 2023, 15(31), 3902–3914. DOI: 10.1039/d3ay00436h.
- Kato, Y.; Munćan, J.; Tsenkova, R.; Kojić, D.; Yasui, M.; Fan, J. Y.; Han, J. Y. Aquaphotomics Reveals Subtle Differences Between Natural Mineral, Processed and Aged Water Using Temperature Perturbation Near-Infrared Spectroscopy. Applied Sciences 2021, 11(19), 9337. DOI: 10.3390/app11199337.
- Li, M.; Sun, Y.; Yang, X.; Ke, Z. Y.; Zhou, J. H.; Liang, Z.; Zhang, S. Z. Temperature Measurement of Aqueous Solution in Miniature Sample Chamber in Microscopic System Based on Near-Infrared Spectrum. The Review of Scientific Instruments 2022, 93(12), 123701. DOI: 10.1063/5.0111549.
- Maeda, H.; Ozaki, Y.; Tanaka, M.; Hayashi, N.; Kojima, T. Near Infrared Spectroscopy and Chemometrics Studies of Temperature-Dependent Spectral Variations of Water: Relationship Between Spectral Changes and Hydrogen Bonds. Journal of Near Infrared Spectroscopy 1995, 3(4), 191–201. DOI: 10.1255/jnirs.69.
- Huang, Y. Q.; Lin, M. S.; Cavinato, A.G.; Mayes, D.M.; Rasco, B.A. Influence of Temperature on the Measurement of NaCl Content of Aqueous Solution by Short-wavelength Near Infrared Spectroscopy (SW-NIR). Sensing and Instrumentation for Food Quality and Safety 2007, 1(3), 91–97. DOI: 10.1007/s11694-007-9012-2.
- Minasny, B.; McBratney, A. B.; Bellon-Maurel, V.; Roger, J.; Gobrecht, A.; Ferrand, L.; Joalland, S. Removing the Effect of Soil Moisture from NIR Diffuse Reflectance Spectra for the Prediction of Soil Organic Carbon. Geoderma 2011, 167–168, 118–124. DOI: 10.1016/j.geoderma.2011.09.008.
- Li, X. H.; Xu, Z. P.; Tang, L. W.; Zhao, G. X.; Wu, Y. J.; Zhang, P. F.; Wang, Q. An Effective Moisture Interference Correction Method for Maize Powder NIR Spectra Analysis. Spectrochimica Acta. Part A, Molecular and Biomolecular Spectroscopy 2024, 312, 124033. DOI: 10.1016/j.saa.2024.124033.
- Martens, H.; Høy, M.; Wise, B. M.; Bro, R.; Brockhoff, P. B. Pre-whitening of Data by Covariance-Weighted Pre-processing. Journal of Chemometrics 2003, 17(3), 153–165. DOI: 10.1002/cem.780.
- Tian, J.; Chen, X. Y.; Liang, Z. N.; Qi, W. L.; Zheng, X. H.; Lu, D. L.; Chen, B. Application of NIR Spectral Standardization Based on Principal Component Score Evaluation in Wheat Flour Crude Protein Model Sharing. Journal of Food Quality 2022, 2022, 1–10. DOI: 10.1155/2022/9009756.
- Blanco, M.; Valdés, D. Suppressing the Temperature Effect in Near Infrared Spectroscopy by Using Orthogonal Signal Correction. Journal of Near Infrared Spectroscopy 2006, 14(3), 155–160. DOI: 10.1255/jnirs.610.
- Arimoto, H.; Tarumi, M.; Yamada, Y. Temperature-Insensitive Measurement of Glucose Concentration Based on Near Infrared Spectroscopy and Partial Least Squares Analysis. Optical Review 2003, 10(2), 74–76. DOI: 10.1007/s10043-003-0074-z.
- Roger, J.; Chauchard, F.; Bellon-Maurel, V. EPO–PLS External Parameter Orthogonalisation of PLS Application to Temperature-Independent Measurement of Sugar Content of Intact Fruits. Chemometrics and Intelligent Laboratory Systems 2003, 66(2), 191–204. DOI: 10.1016/s0169-7439(03)00051-0.
- Sun, X. D.; Wang, Z. H.; Aydin, H.; Liu, J. C.; Chen, Z. X.; Feng, S. R. First Step for Hand-held NIRS Instrument Field Use: Table Grape Quality Assessment Consideration of Temperature and Sunlight Chemometrics Correction. Postharvest Biology and Technology 2023, 201, 112374. DOI: 10.1016/j.postharvbio.2023.112374.
- Santana, F. B.; Giuseppe, L. O.; Souza, A. M.; Poppi, R. J. Removing the Moisture Effect in Soil Organic Matter Determination Using NIR Spectroscopy and PLSR with External Parameter Orthogonalization. Microchemical Journal 2019, 145, 1094–1101. DOI: 10.1016/j.microc.2018.12.027.
- Roudier, P.; Hedley, C.B.; Lobsey, C.R.; Viscarra Rossel, R.A.; Leroux, C. Evaluation of Two Methods to Eliminate the Effect of Water from Soil Vis–NIR Spectra for Predictions of Organic Carbon. Geoderma 2017, 296, 98–107. DOI: 10.1016/j.geoderma.2017.02.014.
- Acharya, U. K.; Walsh, K. B.; Subedi, P. P. Robustness of Partial Least-squares Models to Change in Sample Temperature: I. A Comparison of Methods for Sucrose in Aqueous Solution. Journal of Near Infrared Spectroscopy 2014, 22(4), 279–286. DOI: 10.1255/jnirs.1113.
- Hans, G.; Allison, B. Temperature and Moisture Insensitive Prediction of Biomass Calorific Value from Near Infrared Spectra Using External Parameter Orthogonalization. Journal of Near Infrared Spectroscopy 2019, 27(4), 259–269. DOI: 10.1177/0967033519840742.
- Igne, B.; Allen, R.; Gahkani, A.; Kojic, D.; Kovacs, Z.; McCormick, R.; Mohan, S. Summary of the 2018 International Diffuse Reflectance Conference (IDRC) Software Shoot-out. NIR News 2019, 30(1), 6–11. DOI: 10.1177/0960336018814094.
- Gao, T.; Hu, L. N.; Jia, Z. Z.; Xia, T. N.; Fang, C.; Li, H. Z.; Hu, L. H.; Lu, Y. H.; Li, H. SPXYE: An Improved Method for Partitioning Training and Validation Sets. Cluster Computing 2018, 22(S2), 3069–3078. DOI: 10.1007/s10586-018-1877-9.
- Liao, F.; Li, Y. S.; He, W. M.; Tie, J. X.; Hao, X. W.; Tian, Y. N.; Li, S. T.; Zhang, L. L.; Tang, L.; Wu, J. Z.; et al. Evaluation of Aroma Styles in Flue-Cured Tobacco by Near Infrared Spectroscopy Combined with Chemometric Algorithms. Journal of Near Infrared Spectroscopy 2020, 28(2), 93–102. DOI: 10.1177/0967033519898892.
- Bērziņš, K.; Harrison, S. D. L.; Leong, C.; Fraser-Miller, S. J.; Harper, M. J.; Diana, A.; Gibson, R. S.; Houghton, L. A.; Gordon, K. C. Qualitative and Quantitative Vibrational Spectroscopic Analysis of Macronutrients in Breast Milk. Spectrochimica Acta. Part A, Molecular and Biomolecular Spectroscopy 2020, 246, 118982. DOI: 10.1016/j.saa.2020.118982.
- Chen, S. Y.; Tian, F. Y.; Peng, J.; Meng, Y.; Wang, Y.; He, X. G.; Wang, Q.; Chu, G. H. Turning Zr(IV) into a Phosphate Ester Mimetic Enzyme via De novo Synthesis for Hydrolyzing Organophosphorus Warfare Agents and Rapid Activity Prediction by Near-Infrared Spectroscopy. Microchemical Journal 2023, 195, 109379. DOI: 10.1016/j.microc.2023.109379.
- Johnson, N. A. N.; Adade, S. Y. S.; Haruna, S. A.; Ekumah, J.; Ma, Y. M. Quantitative Assessment of Phytochemicals in Chickpea Beverages using NIR Spectroscopy. Spectrochimica Acta. Part A, Molecular and Biomolecular Spectroscopy 2023, 307, 123623. DOI: 10.1016/j.saa.2023.123623.