
ABSTRACT
This experimental program, implemented by the Managing Collection Environment Initiative at the Getty Conservation Institute, has provided data about the response of historic objects to changes in relative humidity (RH). Alongside other less sensitive documentation techniques (visual observation, physical measurements, photography, and 3D scanning), acoustic emission (AE) was monitored for six historic, museum-like wooden objects exposed to gradually increasing RH variations. Quantitative calibration of AE sensors and an anti-correlation measuring scheme to reduce environmental noise allowed the AE system to effectively trace micro-damage development caused by environmentally induced stress. Using an epidemiological approach, with respect to sample selection and experimental protocol, the obtained results can be used to explore the acceptable range of climate fluctuations for museum collections. The study’s well-controlled environmental protocol also allowed for the examination of the concept of ‘proofed fluctuation’ by the analysis of object response to reoccurring conditions.
KEYWORDS:
Introduction
Because of its importance for the museum community, the topic of environmental standards for cultural heritage collections has been addressed by numerous research projects (e.g. Friendly Heating, Noah’s Ark, and Climate4Wood) examining the presence, or absence, of climate-induced damage for particular objects, groups of objects, or whole collections.
The ongoing debate on appropriate relative humidity (RH) and temperature (T) for museum collections was reflected in the Bizot Green Protocol (National Museum Directors’ Council Citation2014), and the joint IIC and ICOM-CC declaration (Citation2014). These documents underline the difficulties in developing strategies for the protection of museum collections, resulting from insufficient knowledge of how environmental conditions influence real objects.
The amount of existing information is extensive, but to help develop general recommendations for collections, these observations need to be interpreted using sound methodologies capable of dealing with statistical data of variable quality and reliability. The field of epidemiology provides such a methodology, which has proven effective for the study of health and disease in human populations. Epidemiological principles can be directly applied to the cultural heritage field, if one can tackle the issues of quality of evidence and causality (Druzik and Boersma Citation2017).
A major challenge of an epidemiological approach is related to the quality of evidence with respect to statistics and the accuracy of observations. Measurable changes for a collection exposed to moderately adverse climatic conditions are typically recorded in only a small portion of the collection. Thus, to obtain a statistically significant correlation between exposure conditions and damage, the number of analyzed objects must be large (potentially in the thousands), a scenario which is practically impossible when one considers the degree of precision required and the heterogeneity of collections.
There are ways, however, to reduce the necessary sample size. One can make the exposure fluctuations more extreme or decide to populate cohorts with a skewed distribution of those objects thought to represent the most sensitive categories. Since these two methods may not be feasible, sample size can also be reduced by increasing the sensitivity of the assessment method (Druzik and Boersma Citation2017; Łukomski et al. Citation2016). In this study, a small set of wooden objects, representative of those found in museum collections, was exposed to gradually increasing RH variations and acoustic emission (AE) was monitored for six objects. The monitoring method was chosen because of its ability to detect small-scale changes with a high level of accuracy and precision in real time, as required by epidemiological methodology.
Study design
Implementing more sustainable climate control strategies requires knowledge of potential damage correlated with environmental fluctuations beyond existing climate conditions. Monitoring micro-cracking development in historic artifacts, during storage or display, is particularly useful when defining the environmental impact of a current climate control strategy on the preservation of an object. It does not, however, provide information about the expected damage when a collection is exposed to more extreme or variable T and RH conditions. Nevertheless, this information is crucial when objects are to be transferred to different museums or galleries, or when a museum considers modification of its climate control methodology.
To address this challenge, an experiment aiming to explore climate-induced change in hygroscopic objects was conducted by the Managing Collections Environments Initiative at the Getty Conservation Institute (GCI). Initiated in May 2016, and extending over one year, this study traced physical change in various historic, non-museum wooden objects subjected to controlled environmental stresses, using physical measurements, photographic documentation, 3D scanning, and AE. The successful design of the research program depended on: the proper selection of objects, their exposure to precisely controlled and easy to interpret climate variations; and the application of monitoring techniques capable of tracing minute changes of objects in real time. This paper will address the results of the AE monitoring.
Selected objects
It was decided to focus on wood, which is common in museum collections and, due to its hygroscopic nature, is susceptible to environmental variations. Climate-induced damage in wood is caused by moisture sorption/desorption combined with a restrained dimensional response as a result of a rigid construction, limiting movement or joining wood elements that have different fiber orientations. Wood can also be internally restrained as moisture diffusion is not instantaneous and, when exposed to lower RH, its outer layers will dry more quickly than the interior (Bratasz Citation2013).
Rather than using mock-ups, the study used wooden objects that are representative of a museum collection. Criteria for selecting specific objects addressed object size, construction, and surface finish, upon which damage mechanisms depend. It was also important to monitor objects that were previously exposed to uncontrolled climatic fluctuations and possibly damaged as a consequence, which is the case for many museum objects.
Using these criteria, 14 non-museum wooden objects were selected offering a variety of wood types, size, and thicknesses and with different construction and finishes (such as paint, varnish, veneer, and marquetry). This paper focuses on a drum, table, humidor with metal lining, sculpture, and lacquer box, which corresponds to objects 2, 3, 4, 5, and 6, respectively, presented in and . The selected objects are of a certain age, showing some climate-induced damage, such as cracking or warping, and were either purchased in antique stores or loaned by the UCLA/Getty Masters Program in the Conservation of Archaeological and Ethnographic Materials. In addition, a white oak cleated panel made by the preparations department at the J. Paul Getty Museum, was included as a ‘virgin’ object that had not undergone climatic ‘proofing’ (Michalski Citation2009) in its lifetime, proofing being the cracking that can reduce environmentally induced stresses in a material.
Figure 1. Study design. Left: objects monitored by AE in the environmental room; right: temperature and humidity protocol implemented during the experiment. Photo: J. Paul Getty Trust.
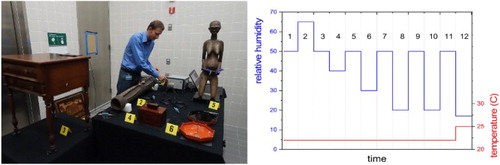
Table 1. Objects analyzed using AE during monitoring campaign.
Climatic conditions
During the monitoring campaign, objects were housed in an environmental room where T was held constant (21–22°C) and RH was changed in a controlled manner (). The RH scheme focused on behavior at low humidity, at which a mismatch in the dimensional response of materials constituting decorated wood can cause the restraint of movement within individual layers and lead to the development of high stresses, in turn leading to fracture and deformation (Łukomski Citation2012).
The RH was rapidly changed from one condition to the next within 5 hours, and each RH level was maintained for at least four weeks, allowing for the creation of the largest possible moisture gradient in the wood structure followed by its maximum response. Each shift away from 50% RH was followed by a return to 50% RH, allowing for an independent examination of each RH shift.
Following an initial acclimation period at 50% RH, the RH was raised to 65%. This was to increase the moisture content of the wood, inducing compression stresses (especially in the newly constructed oak panel) that could contribute to potentially higher shrinkage stresses at lower humidity. The 65% limit was intended to reduce the risk of biological attack. The final phase of the experiment (17% RH and 25°C) was conducted at the lowest RH possible in the environmental room – the increase in T during this period was needed to achieve this reduced RH.
Although the excursions of RH in this study exceeded current recommended museum levels, these conditions are not unlike what objects could experience in an uncontrolled environment, such as a historic house in southern California or heated (but not humidified) interiors in northern Europe during winter.
AE monitoring
AE is defined as the energy released due to micro-displacements in a structure that is undergoing deformation – this generates ultrasound waves that travel through the material and are recorded at its surface by a piezoelectric sensor. The non-invasive character of the measurement, together with its high sensitivity, makes the method attractive for monitoring damage in the cultural heritage field.
The effective deployment of sensors to distinguish background noises affecting multiple sensors simultaneously from object response affecting one sensor (anti-correlation) allows for accurate recording of fracture events. Consequently, AE can be used to directly record environmentally induced physical changes in brittle materials and, hence, support the assessment of climate management strategies for collections (Łukomski et al. Citation2017). In this study, AE monitoring was carried out with an AMSY-6 AE system (Vallen Systeme GmbH, Icking, Germany) with six parallel measurement channels. Each AE channel was equipped with a ‘Steveco’ KRNBB-PCP (KRN Services Inc., USA) broadband point contact sensor in line with a KRNBB (KRN Services) linear signal preamplifier. Conservators at the J. Paul Getty Museum used Paraloid-B72 to attach one AE sensor to each of the previously described six objects, allowing for full exploitation of anti-correlation noise filtration (Strojecki et al. Citation2014). To maximize detection sensitivity, sensors were located near existing cracks, which are prone to further damage when under stress. Łukomski et al. (Citation2017) described a method of quantitative calibration of crack propagation in wood expressed in AE energy and application to this specific measuring system correlated 1.9 × 10⁶ (±20%) arbitrary units (a.u.) of AE with the cracking of 1 mm2 of wood surface. Although AE energy is defined as the root mean square voltage calculated in the time between the onset of the acoustic wave and its extinction, it is arbitrary in the sense that recorded values depend on the specific measuring system and its configuration. This means that energy related with different events can be directly compared as long as they are measured within the same experiment, but quantitative calibration of crack propagation is specific to the measuring system.
Results
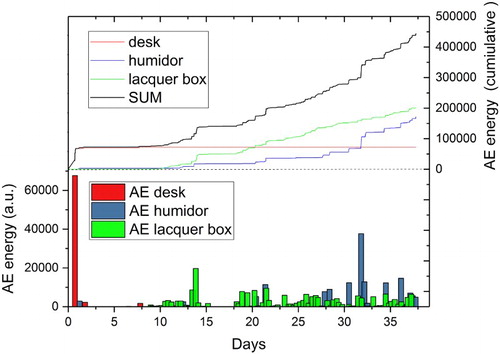
AE was continuously monitored throughout the study. The AE recorded for all objects during the entirety of the experiment resulted in an energy of 1,750,000 a.u., which corresponds to total cracking of about 1 mm2 wood surface. The cumulative AE (after filtering out electrical and ambient noise) recorded during all phases of the experiment, for the six monitored objects, is presented in .
Figure 2. The cumulative AE (after filtering out electrical and ambient noise) recorded during all phases of the experiment for the six monitored objects. Due to a malfunction in the AE system, AE was not recorded for phase 7.
Beginning with the exposure at 30% RH, numerous AE signals were recorded close to the detection threshold – these signals became more pronounced when first exposed to 20% RH. As presented in , AE signals during phase 8 were recorded for only three of the six monitored objects. There is clearly a delay between the drop in RH (during the ∼5-hour transition at the beginning of the phase) and the recording of AE for the humidor and the lacquer box – this can be interpreted as a reflection of the response time related to the slow diffusion of moisture through the material. When AE is recorded, during (as in the case of the desk) or after the initial rapid change in RH, micro-damage is most likely associated with stress caused by a gradient of moisture content rather than the total response of the object.
Figure 3. AE recorded during the first shift from 50%RH to 20%RH (phase 8 in ). Top: cumulative AE energy; bottom: AE signals integrated in 8-hour windows.
To better compare the responses of the monitored objects to increasing RH variations, cumulative AE signals for all six objects recorded during the first 840 hours of each phase (represents the minimum duration and includes the initial RH shift) were analyzed (). The black squares indicate cumulative AE energy for phases deviating away from 50% RH, and the red squares represent the cumulative AE energy for phases returning to 50% RH. For clarity, each point was labeled with its corresponding phase (). The black line represents an exponential function fitted to the data recorded during and after drops of humidity. Note that the AE energy shown in represents the cumulative value recorded for each phase of the experiment, while the AE energy in is the cumulative value for all phases.
Figure 4. Cumulative AE response of all monitored objects during the first 840 hours of each phase (points labeled with its corresponding phase as shown in ). The black and red squares represent total AE energy for phases deviating away from 50%RH and returning to 50% RH, respectively. Data for phase 7 is not present due to a malfunction in the AE system.
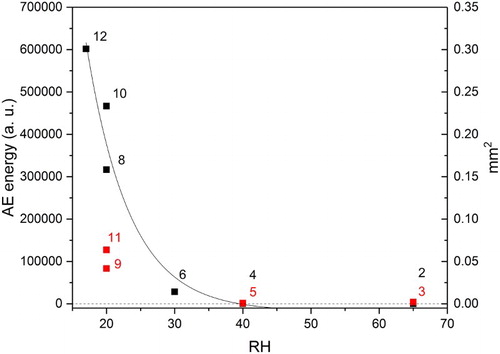
Using the calibration described above, the recorded AE energy was translated to actual damage and this is presented on the right vertical axis of . Fracture recorded for the most extreme T and RH change (phase 12: 50–17% RH, 20–25°C) corresponds to an extension of the crack surface of 0.3 mm2.
Following the first excursion to 20% RH (phase 8), visual examination of the newly constructed wooden panel revealed a strong twist along its longer central axis. Beginning with phase 8, this deformation was measured at the end of each phase in two ways: a manual technique in which three corners of the panel were in contact with a flat surface and the height of the uplifted corner from the flat surface was measured, and by using 3D scanning (Artec Eva). In both cases, the angle between the shorter sides of the panel and the flat surface was determined and treated as an indicator of deformation. The results as a function of RH are shown in .
Figure 5. Deformation (torsion) of the panel as measured by the angle between an uplifted corner and a flat surface. Measurements were conducted at the end of each phase. Note that 3D scanning was not conducted during re-exposure to 20%RH (phase 10 in ).
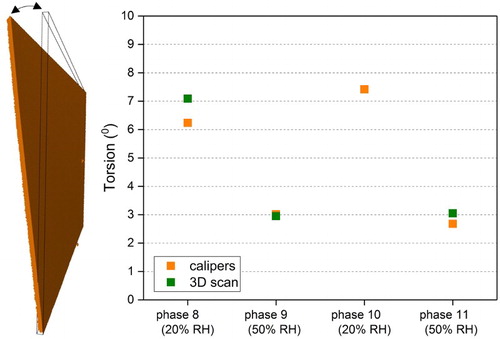
While the change of humidity from 20 to 50% RH (phases 9 and 11) results in a reduction in the deformation of the panel, the torsion remains visible and likely affects the esthetics of the object (). As a consequence of its initial exposure to 20% RH, the panel was permanently deformed and re-exposure to 20% RH (phase 10) did not result in increased twist. Importantly, AE signals from the panel were not recorded during the deformation processes. This may indicate that the deformation of the panel was not accompanied by brittle cracking of the wood structure, despite the fact that irreversible plastic behavior had occurred.
Discussion
A collection of wooden ‘museum-type’ objects was selected and exposed to conditions ranging from 65 to 17% RH. Variations in RH were programmed to subject the objects to the largest possible stress, resulting in a maximum moisture gradient and the potential for maximum physical response of the material. This physical response was documented by a suite of techniques (visual observation, physical measurements, photography, and 3D scanning) including the highly-sensitive AE monitoring conducted on a subset of six objects.
The results from the AE system show that the objects experienced brittle cracking, but only to a very limited extent. The AE energy registered for humidity variations as low as 30% represented only 2% of the cumulative AE energy measured during the entirety of the experiment. This finding is made more significant when one keeps in mind that the cumulative measured AE energy for all phases corresponds to roughly 1 mm2 of wood fracturing. The full set of objects was also monitored by physical measurements, photography, and 3D scanning, and the analysis is still in progress.
The lack of AE response for objects exposed to increasingly wide humidity variations clearly supports the ‘proofed fluctuation’ concept proposed by Michalski (Citation2009) – this considers the risk of further mechanical damage (beyond that already accumulated) from fluctuations smaller or equal to those previously experienced as extremely low. Most of the objects selected for this study were previously kept in unconditioned spaces in southern California and were likely periodically exposed to extreme dry conditions. The proofed fluctuation concept was also demonstrated by the permanent deformation of the newly constructed panel when exposed to 20% RH, and the fact that subsequent exposure to 20% RH did not result in increased deformation.
Although this paper only addresses the monitoring of AE, the systematic approach used during this study allowed for the exploration of the applicability of different monitoring techniques to record the physical response of objects to controlled climatic variations. While a more in-depth comparison of each monitoring technique will be conducted in the future, a comparison of the results obtained for the newly constructed panel with the AE system and 3D scanning highlights the potential of providing complementary data. Though AE monitoring is extremely sensitive to brittle cracking, this phenomenon was not present during the plastic deformation of the panel. Therefore, the use of an alternative monitoring technique such as 3D scanning was needed to document object deformation.
These results may be treated as a unique case study for developing and questioning climate control strategies for museum collections and may contribute to verifying existing mechanical models of object damage on the basis of the measured material properties. In both cases, however, the specificity of the analyzed collection, including climate history and previous conservation alterations of the object structure, must be taken into consideration.
Acknowledgements
The authors would like to acknowledge the support of the GCI’s Managing Collections Environments Initiative, the Decorative Arts and Sculpture Conservation Department and the Preparations Department of the J. Paul Getty Museum, the J. Paul Getty Trust Facilities Department, and the UCLA/Getty Master’s Program in the Conservation of Archaeological and Ethnographic Materials.
Disclosure statement
No potential conflict of interest was reported by the authors.
ORCID
Foekje Boersma http://orcid.org/0000-0002-0545-9836
Marcin Strojecki http://orcid.org/0000-0001-6411-1306
Related Research Data
References
- Bratasz, Ł. 2013. “Allowable Microclimatic Variations for Painted Wood.” Studies in Conservation 58 (2): 65–79. doi: 10.1179/2047058412Y.0000000061
- Druzik, J., and F. Boersma, eds. 2017. Epidemiology: Basic Ideas Applied to Museum Collections. A Report from an Experts Meeting Organized by the Getty Conservation Institute. Los Angeles, CA: The Getty Conservation Institute. http://www.getty.edu/conservation/publications_resources/pdf_publications/epidemiology.html.
- IIC/ICOM-CC. 2014. Declaration on Environmental Guidelines. IIC. Accessed October 6, 2017. http://www.iiconservation.org/node/5168.
- Łukomski, M. 2012. “Painted Wood. What Makes the Paint Crack?” Journal of Cultural Heritage 13 (3): S90–S93. doi: 10.1016/j.culher.2012.01.007
- Łukomski, M., J. Druzik, V. Beltran, A. Freeman, F. Boersma, and J. Taylor. 2016. “The role of Micromechanics in the Epidemiology of Climate-induced Damage.” Paper presented at Mechanics of Art Materials and its Future in Heritage Science, 24–25 October 2016, Washington, DC: Smithsonian Museum Conservation Institute.
- Łukomski, M., M. Strojecki, B. Pretzel, N. Blades, V. L. Beltran, and A. Freeman. 2017. “Acoustic Emission Monitoring of Micro-Damage in Wooden Art Objects to Assess Climate Management Strategies.” Insight – Non-Destructive Testing and Condition Monitoring 59 (5): 256–264. doi: 10.1784/insi.2017.59.5.256
- Michalski, S. 2009. “The Ideal Climate Risk Management, ASHRAE Proofed Fluctuations”, and “Toward a Full Risk Analysis Model.” In Proceedings of Experts’ Roundtable on Sustainable Climate Management Strategies, edited by F. Boersma. Los Angeles, CA: The Getty Conservation Institute. http://www.getty.edu/conservation/science/climate/climate_experts_roundtable.html.
- National Museum Directors’ Council. 2014. Environmental Sustainability - Reducing Museums’ Carbon Footprint. London: National Museum Directors’ Council. http://www.nationalmuseums.org.uk/what-we-do/contributing-sector/environmental-conditions/.
- Strojecki, M., M. Łukomski, L. Krzemien, J. Sobczyk, and Ł Bratasz. 2014. “Acoustic Emission Monitoring of an Eighteenth-Century Wardrobe to Support a Strategy for Indoor Climate Management.” Studies in Conservation 59 (4): 225–232. doi: 10.1179/2047058413Y.0000000096