
 ?Mathematical formulae have been encoded as MathML and are displayed in this HTML version using MathJax in order to improve their display. Uncheck the box to turn MathJax off. This feature requires Javascript. Click on a formula to zoom.
Abstract
Complexity of urban construction and land use is increasing which cannot be represented adequately by 2D systems. The successful construction of a Spatial Information Model of 3D Real Estate (SIM-3RE) is valuable to achieving a refined administration of 3D space and property-rights of urban real estate in China. In this paper, the Nanjing Gulou Central Business District was selected as an experimental region, and the historical data of surveys and maps of the parcels and buildings were collected. After the supplementation of some missing data (such as height) by surveying, the SIM-3RE was constructed using the 3D partitioned units for buildings and 3D parcels of land.
1. Introduction
With the increasing contradictions between urban land supply and demand, urban land use, particularly in developed cities, continues to grow vertically to the air and underground, which makes the registration and management of real estate property rights more difficult. The conceptual category of real estate varies between countries. The term ‘cadastre’ has long existed in the international community. In some countries of Europe and the Americas with integrated house and land registration, the cadastre is a concept close to real estate. In China, the idea of unified registration of real estate is proposed by Property Law of the People’s Republic of China (Citation2007). Article 10 in ‘Property Law’ states that ‘the government implements a unified registration system for real estate’. And in Article 136 that ‘the right to use the construction land can be established separately on the surface, ground or underground of the land’, which provides a legal basis for the implementation of 3D cadastre/3D real estate. However, the unified registration of real estate was not actually implemented until the Interim Regulation for Real Estate Registration (Citation2014) was issued in China in March 2014. According to the above laws, real estate refers to land, sea, and fixtures such as houses and forests, and the types of real estate registration include first registration, transfer registration, mortgage registration, seizure registration, easement registration, etc. Before this, however, land in China and any building on it were separately surveyed and mapped for registration. More details about the history and current status of real estate registration in China are given by Chen (Citation2014), Yu et al. (Citation2017), and Wu et al. (Citation2019).
At present, the research on 3D cadastre /3D real estate (3RE) mainly focuses on data modeling. Stoter (Citation2004) proposed three kinds of 3D cadastral data models—the Full 3D Cadastral Model (F3CM), the Hybrid Model, and the 2D Classical Registration with References Model. Van Oosterom et al. (Citation2006b) proposed the core cadastral domain model (CCDM). On the basis of CCDM, Lemmen and Van Oosterom (Citation2011) proposed a more general framework model, called the Land Administration Domain Model (LADM), which is proposed as a standard by The International Organization for Standardization (ISO Citation2012) 211 Technical Committee (TC211). Many scholars have constructed 3D cadastral models on the basis of LADM that are suitable for the reality of cadastral administration in their countries, such as Israel (Felus et al. Citation2014), Nigeria (Oyetayo et al. Citation2015), Korea (Lee et al. Citation2015), Malaysia (Zulkifli et al. Citation2014), Australia (Aien et al. Citation2013; Kaňuk et al. Citation2015), Turkey (Alkan and Polat Citation2016), and China (Wu et al. Citation2019). Moreover, Aien et al. (Citation2013), Rajabifard et al. (Citation2018) evaluated 3D spatial information models (including purely legal information models, purely physical information models, integrated information models). Shojaei et al. (Citation2017) focused on developing geometrical validation rules for 3D cadastral objects. Some other scholars (Guo et al. Citation2013, Citation2016) used the B-Rep method and built spatial entities based on unified logic, and Arroyo Ohori et al. (Citation2015) presented a dimension-independent extrusion algorithm.
In addition to the third dimension, some scholars have even considered the temporal dimension. For instance, Van Oosterom et al. (Citation2006a) discussed the spatio-temporal topological relationship of four-dimensional cadastre and proposed the CDM-based four-dimensional cadastral data model. Döner et al. (Citation2010), Siejka et al. (Citation2014), and Ioannidis et al. (Citation2015) also investigated some feasibility issues for the establishment of four-dimensional cadastre.
The existing 3D cadastral modeling has been studied intensely in the fields of the physical information model and the legal management model. However, the 3D cadastral modeling methods mainly face on the dispute between the situation demand and the cost–benefit. Relevant scholars have paid attention to the issues of modeling cost (Griffith-Charles and Sutherland Citation2013, Citation2019, Kalantari et al. Citation2015), or to keep the transition smoother and economically feasible (Shojaei Citation2014, Prieto et al. Citation2018, Višnjevac et al. Citation2018). But it is also worth pointing out that the current research results to reduce the cost of 3D cadastral modeling have not been applied in the regions with complex 3D property rights spatial relations for practical application.
This paper presents a structured framework for 3RE modeling to build the Spatial Information Model of 3D Real Estate (SIM-3RE) under the premise of complying with the real estate management law, to efficiently manage the complex 3D property rights spatially and serve the work of unified registration for real estate. For people, they can also understand the right space of their real estate more intuitively, which is also of certain significance to promote the public's cognition of three-dimensional spatial information technology.
2. Research area and data
2.1 Research area
Nanjing, the capital city of Jiangsu Province, China, is a city with comprehensive planning in the development and utilization of underground space in eastern China. The underground space in Nanjing has comprehensive functions, including underground parking, rail transit, roads, tunnels, civil air defense works, and underground commercial facilities. Underground space development and utilization, the underground parking lots in Nanjing for residential, commercial, and transport hubs account for approximately 90% of the total underground space developed. Ten subway lines cover a total distance of 378 km. One significant merit of the underground space development in Nanjing is its integrated construction of above-ground commercial facilities and subway stations, constituting an active underground commercial facility space of multiple businesses.
In this paper, the NG-CBD was selected as the research area (see ). NG-CBD is located at the urban political and economic center of Nanjing, densely of ecologic, hotel, office, education, and business space, such as the skyscraper Zifeng Tower (ZFT) and the Gulou Subway Station (GSS).
1 Map and photos of the experimental area
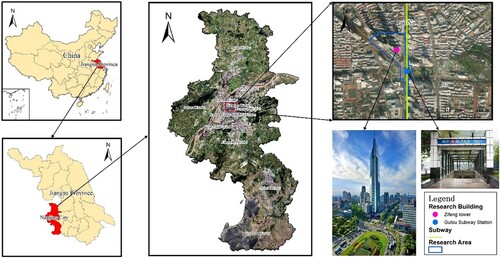
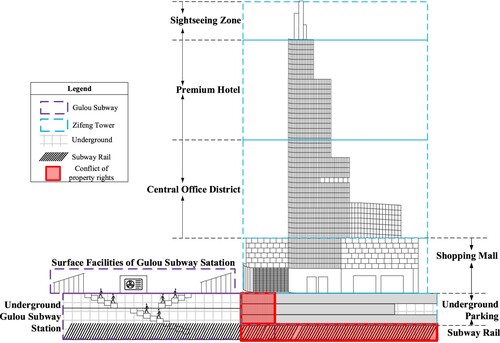
GSS and ZFT make up a commercial transport complex of the NG-CBD and are a typical case of urban underground space development in Nanjing. GSS is located on Metro Lines 1 and 4, and has seven entrances and exits. As shown in , GSS and ZFT are planarly adjacent but spatially intertwined. As a result, the ranges of above-ground or underground and parcels of GSS and ZFT on a two-dimensional (2D) cadastral map are overlapping, as shown in (Red solid lines). Of the two, only ZFT has an above-ground part; however, the first above-ground floor of ZFT can be directly accessed through GSS. Some underground parts of GSS are parallel to ZFT, some overlap with ZFT, and Metro Line 1 passes through the underground space of ZFT, forming a complicated 3RE complex. The property-rights structure of ZFT changes in space and the construction of its 3D model is complicated due to the diverse registration status of rights and the crossing of rights for using the space between ZFT and GSS at their underground intersection.
2 Profile showing the structural relationship between GSS and ZFT (ZFT)
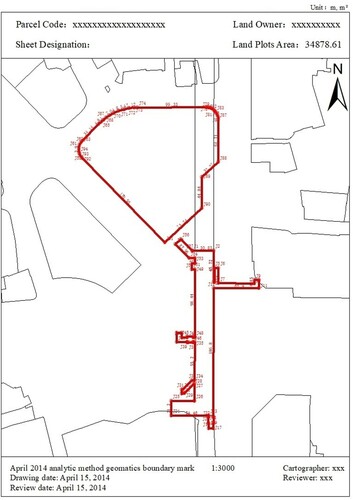
3 Cadastral map of NG-CBD
2.2 Data collection
This experiment aimed to construct the property-rights model of GSS, and ZFT using 3D parcels of land and 3D partitioned units (each house, office or shop room) for buildings. The collected NG-CBD data mainly included the cadastral maps, the floor plan maps, as-built drawings, and the construction completion report of GSS and ZFT.
2.2.1 Cadastral map of the NG-CBD region
The cadastral map () reflects the land use range where GSS and ZFT are located (in red lines) in a two-dimensional (2D) planar parcel. The cadastral map is essential to determine the range of real estate rights. The range of above-ground and underground parcels of land and the positions of buildings and various tunnels are showed in .
2.2.2 Floor plan map
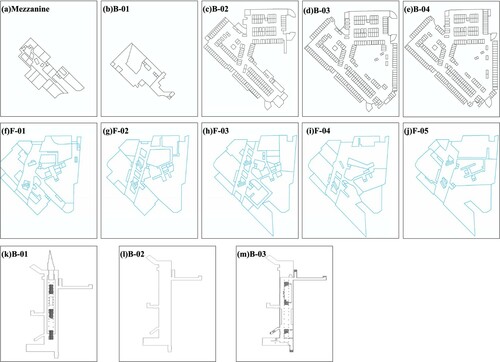
A floor plan map is one of the outcomes of the construction plans or real estate surveying. It has information about shape, length, floor height, and floor number for each room. It can be used to describe the spatial morphological features of each room. (a-j) show floor plan maps for the underground fourth floor to the above-ground fifth floor of ZFT, including the specific structures of the underground commercial rooms and parking lot on each floor. (k-m) show floor plan maps from the underground first floor to the underground third floor of GSS, including the locations of the stairs, passageways, waiting areas, entrances, and exits on each floor. Floor plan maps are critical data for modeling using 3D partitioned units for buildings. The standard floor plan maps were combined with the real estate title data to express the property rights intuitively.
4 Floor plan map from the survey of ZFT and GSS
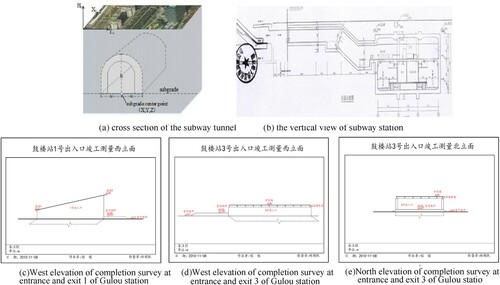
2.2.3 As-built drawings and construction completion report
The as-built drawings are the drawings which can reflect the actual spatial structure and size inside a building (buildings) after the construction is completed. Through the scheme of land use, we can get the construction structures of stations and the tunnel of Line 1 of GSS and their spatial ranges. (a) describe the cross-section of the subway tunnel, the planar projection with the coordinates of the center point of the subgrade (X, Y, Z), and the coordinate origin (X0, Y0, H0) (with H for elevation) in the independent coordinate system of Nanjing City; the vertical spatial range of the subway tunnel, namely, the distance from the subgrade bottom to the tunnel vertex, h; and the lateral spatial range, namely, the distance from the subgrade center point to each side of the tunnel, w. The tunnel data of the subway are primary data for modeling subway stations and subway tunnels using 3D parcels of land. (b) shows the vertical view of the subway station, and we can get the elevation labels of the very entrance of the station (c-e). The spatial data in the construction completion report mainly include: (1) coordinates for the main turning points of the building; and (2) the floor height table.
5 Schematic diagram of the subway tunnel and station
It is worth mentioning that the integration of Building Information Models (BIM) can also help in the data collection process for 3D cadastre (Rahman et al. Citation2012, El-mekawy et al. Citation2014). However, when data is limited, the process of building 3D cadastre property units may have to be started from the 2D maps of as-built.
3. Methodology
In this paper, the NG-CBD was chosen as a typical 3D space research area for the construction of the urban SIM-3RE. The specific methods and procedures are shown in . 3D real estate modeling needs to use computer geometry, survey, GIS and other technical methods, according to the laws (i.e. ‘Property Law’ and ‘Interim Regulation on Real Estate Registration’) of real estate management.
6 Flow chart of SIM-3RE modeling
Step 1: Data collection. We collected as far as possible the existing types of 2D survey and mapping data of 2D parcels and buildings (see section 2.2) and the missing data by supplemented surveying to complete the preparation of basic data for the modeling of 3D parcels of land (see section 3.1).
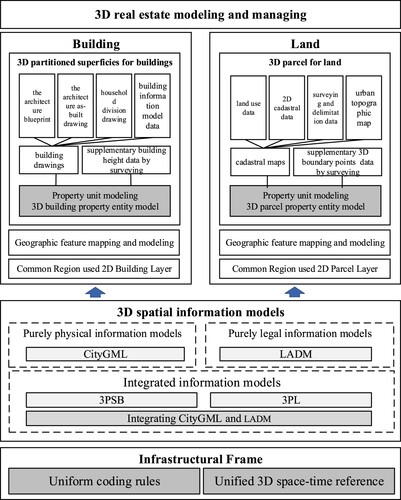
Step 2: The establishment of the 3D spatial data model. The 3D spatial information models of land administration can be classified into three categories: purely legal, purely physical, and integrated (Rajabifard et al. Citation2018). Our 3RE research can reuse this classification as well, including the construction of the geographic data model and legal data model. In particular, the geographic data model is mainly used to construct and store the geometric information model of 3RE, such as the convex hull of triangulated tetrahedrons (Wu et al. Citation2019), a new extrusion approach (Ding et al. Citation2017). The legal data model is mainly based on the improved LADM model to express the real estate rights defined by the relevant legal systems in China (see Wu et al. Citation2019). The LADM model that we designed and improved is a logical model that obeys the current property law in China and relevant laws of real estate administration. LADM covers two aspects of land administration: the administrative aspect and the spatial aspect and clearly expresses the relationship between owners, rights, and spatial object of the real estate.
Step 3: 3RE modeling and visualization. The real estate rights involve the rights to use the space above/below land and in buildings. If a parcel is located on the ground surface, then the ground surface range of the land parcel along with the agreed starting and termination height of the construction is the 3D space subjected to the land use right, according to the urban planning or construction management department of government; if a parcel is located above or below land, the 3D space of the land use right relies on the specific structure of the building and its use of space. According to the predefined range of rights and on the basis of the existing 3D parcel data and the supplementary elevation data collected by surveying, we can construct the 3D land parcel model that contains the property-rights information of real estate. Please refer to the results of our previous 3RE modeling studies for relevant information (Wu et al. Citation2019), including regular 3D land parcels created from 2D land parcel and irregular ones using the convex hull method, which is not reiterated here. The right of use should be detailed for each room, and we propose an idea for constructing the 3D partitioned units for buildings (see section 3.2). Based on the collected floor plan maps, and as-built data, along with the supplementary data collected by surveying, we established the room property-rights model. Both the 3D land parcel and 3D partitioned units for buildings model were the integration of the geographic and legal data model. And the models were further matched with the registration data of real estate to support the property-rights registration of real estate. After the spatial modeling was completed, a mature commercial GIS platform (Supermap) was used to visualize the 2D and 3D integrated model (except for core regions that adopted the 3D model, other regions still adopted the 2D data), in order to support the subsequent analysis and applications of real estate data.
Collection of supplementary data
Methods for collecting supplementary data of coordinates for 3D boundary points
The methods for collecting supplementary data of coordinates for 3D boundary points mainly include two parts: a survey of boundary points for the 3RE and an investigation of 3RE ownership.
3.1.1.1 Survey of boundary points for the 3RE
The survey of boundary points for the 3RE is an essential technical step to carry out the modeling and administration of the 3RE. The objects of surveying for the boundary points of 3RE are divided into the boundary points on the ground surface, above the ground, and underground. In the space above the ground surface, we can adapt the traditional measurement method to acquire the above-ground spatial data mainly with material objects. However, for the measurement of space not delineated by material objects, for predefined underground space, and for space within the land-use right, the traditional measurement method is not feasible, and we need to combine field measurement with graphical methods to survey and map the boundary points. shows a survey of boundary points for the 3RE that is on the ground surface (a), the 3RE that is partially above-ground and partially underground (crossing the ground surface) (b), the 3RE that is above-ground (c), and the 3RE that is underground (d). The boundary points of the 3RE were obtained by using the method to project the boundary points on the ground surface along the vertical line upward (or downward) to various elevation planes. The specific technical processes are as follows:
7 Surveying and modeling for the boundary points of 3RE
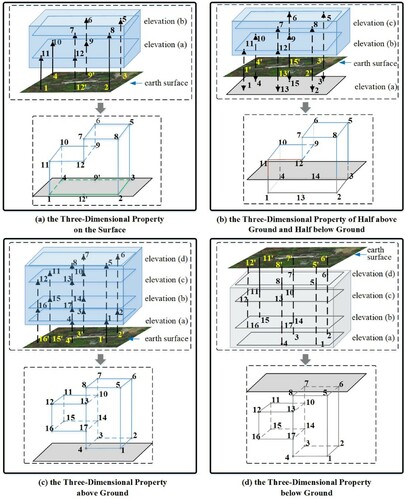
Step 1. Determine the boundary points (or reference points) on the ground surface. In the 3RE coordinate system, for the 3RE on the ground surface, we adopted the methods of 3D surveys (planar surveys and elevation surveys). We measured the planar coordinates and elevations of boundary points on the ground surface. For the above-ground (or underground) 3RE, according to the reference data in the data sets such as as-built drawings (), we calculated the planar position of various boundary points at the bottom (or top) part of the above-ground 3RE. For the 3RE that is partially above-ground and partially underground (crossing the ground surface), we surveyed the planar coordinates and elevations of boundary points on the ground surface formed by the intersection between the 3RE and the ground surface. Therefore, we converted the boundary points from 2D coordinates (x, y) to 3D coordinates (x, y, z). Because the elevation change of the local region is small, if the undulation of the terrain is negligible, we can consider that the elevation of boundary points on the same plane is completely consistent.
Step 2. Determine elevation planes of the 3RE. In the 3RE coordinate system, we determined the value and position of elevation planes of the 3RE according to the reference data in the data sets, such as as-built drawings.
Step 3. Calculate the coordinates for the boundary point of 3RE. In the 3RE coordinate system, from a boundary point (or reference point) on the ground surface plane upward (or downward) along the vertical direction (that is, along the Z-axis) to various elevation planes, the intersection of the projection line and the elevation plane is the position of the boundary point. Using this method, we obtained the spatial locations and coordinates of boundary points.
Step 4. Mapping 3RE that is on the ground surface. According to the spatial locations and coordinates of boundary points obtained by multiple projections and graphical methods, the above-ground 3RE was mapped according to the normative expression of 3RE in the coordinates of the 3RE.
After the collection of the 3D boundary points, we connected them to obtain the boundary lines and boundary planes of the 3RE.
3.1.1.2 Investigation of 3RE ownership
According to the notice issued in March 2015 by the Chinese Ministry of Land and Resources on the investigation of real estate, the investigation of ownership should be organized by the real estate registration authority of the government at or above the county level. The main contents of the investigation of ownership are verifying and investigating the status of the real estate owner and boundary, drawing up the sketch of real estate units, and so on. The main purpose of investigating the 3RE ownership is to further clarify the specific conditions for the space-use rights of the 3RE based on the collected data on the basis of the aforementioned surveying of boundary points. The basic content includes 3RE ownership, real estate utilization category, and building status. The investigation is required to proceed with the 3RE as the basic unit. Before the investigation, archival data related to planning, design, measurement, transferring, and evaluation are collected, and the investigation results are registered and archived according to the corresponding regulations. The investigation of 3RE ownership mainly regards the investigation of the ownership and land-use rights of 3RE, including the property ownership attributes, the name of the property owner, the location and spatial range of the 3RE, the boundary lines of the relevant administrative districts, and the names of geographic elements. The investigation of the utilization category of 3RE refers to the relevant national usage classification criterion and investigates the main utilization categories of the 3RE. When the 3RE unit contains multiple utilizations and owners, we used the ownership of its main utilization category and added the comments of other ownerships and their ranges on a form. The investigation of building status serves to investigate and register the structure, number of floors, name, and ownership of buildings in the 3RE.
3.1.2 Results of data collection in the experimental region
Because the NG-CBD data in the experimental region were divided into two parts, the above-ground, and underground part, different methods of data collection were adopted, as follows:
For the survey of boundary points for complicated real estate units on the ground surface, such as the annex of ZFT used as commercial offices, some floors are regular in shapes; others are irregular, however. The regularly shaped parts were modeled using the supplementary elevation information based on the collected 2D cadastral map and 2D boundary point coordinates, and then the model was directly stretched to become a 3D parcel of land. The irregularly shaped parts were modeled using the supplementary data obtained by surveying.
For the subway under the ground surface, because the method of measurement above ground was not suitable, we adopted the method of subtracting the depth limit of the subway from the elevations of ground surface boundary points to obtain the coordinates of underground boundary points. The depth limit of the subway was calculated by the height of the elevations of the subway in the as-built drawings. In the real estate survey of subway stations in the NG-CBD, we acquired the turning points and height of every floor through the subsurface layered topographic map and elevations in the as-built drawings for the current subway stations and thus calculated the 3D coordinates for the turning points of buildings.
So far, we have completely acquired the data of 3D boundary points for the parcels of the subway stations in the NG-CBD and established the basis for the subsequent spatial modeling.
3.2 Method for establishment of 3D partitioned units for buildings
At present, the 2D partitioned units for buildings are usually used for the administration of building property rights. The 2D partitioned units for buildings is a 2D table. The rows of the table represent different floors, and the columns of the table represent the units. Every unit cell represents a room and can display the rights status of the room. The 2D partitioned units for buildings has some ability to express simple buildings, but it fails to depict complicated building complexes, such as large commercial complexes and annexes. These buildings have various shapes and the complicated right to use the space. Therefore, it is necessary to construct 3D models of buildings and real estate for the 3D administration of the real estate on the basis of 2D partitioned units for buildings.
The method of modeling 3D partitioned units for buildings achieves the 3D spatial expression of real estate, and the spaces of various property rights can be combined with the property-rights information of real estate registration to render multiple colors for different rights statuses. The construction of 3D partitioned units for buildings is mainly limited by the efficiency and accuracy of processing and treatment of original data. It is the key that determines the promotion and application of 3RE models, such as how to construct an efficient and intensive modeling method of 3D partitioned units for buildings. To solve this problem, we propose a method that uses the floor plan maps obtained by the surveying and mapping of real estate to conduct the modeling of 3D partitioned units for buildings (as shown in ).
8 Flow chart for the modeling of 3D partitioned units for buildings
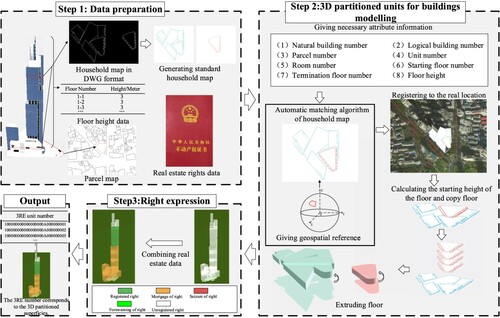
Step 1. Data preparation. The data used include the floor plan maps in DWG format, land parcel data where the building is located, height data for the floors of the building, and real estate rights registration. We converted the format of the site data and extracted the closed 2D room vector plane.
Step 2. Modeling of 3D partitioned units for buildings model. Because the floor plan maps did not have the absolute spatial coordinates, after acquiring the floor plan maps of different structures, we had to achieve its spatial position socket with the 3D parcel of land. We proposed the adoption of a fuzzy spatial registration algorithm of floor plan map based on the tangent space curve (see Appendix A), whose core idea was to extract the contours form different floor plan maps and simplify them, separately construct the descriptive function of the tangent space curves, then conduct the distance matching with minimum similarity, and finally obtain the coordinate correction of the main calibration points in the floor plan maps, thereby forming the floor plan map data that can be used for the spatial registration. Then, we assign the values to the attributes of floor plan maps, including the parcel number, natural building number, logical building number, unit number, room number, beginning floor number, termination floor number, and heights of floors. Meanwhile, the corrected realistic geospatial reference information was assigned, and the positions of various floors in the maps were corrected according to the position of the bottom plane of the actual building. We replicated the floors according to beginning floor number, ending floor number, and heights of floors and there by acquired the 2D vector plane of each floor. In this process, the base height of each floor was automatically calculated, which was an indispensable attribute in constructing the 3D partitioned units for buildings. By superposition of the base height of every floor to the actual height, the models of 3D partitioned units for buildings were established.
Step 3. Rights expression in models of 3D partitioned units for buildings. Through the existing attributes of parcel number and room number, we linked with the real estate registration data and acquired the information of other attributes, including area, planned usage, names of property rights holders, and rights status. We set the rights status of real estate as the key attribute field and dynamically rendered the 3D model in different colors. The colors were used to express the various rights statuses of real estate units. The real estate rights statuses usually include first registered right, mortgage of right, seizure of right, forewarning of right, unregistered right (the house has been built but not sold, or has been sold but the owner has not completed the registration of real estate procedures). They have specific reference values for the behaviors of real estate transactions and demolition. The real estate rights status will change when a transfer, mortgage, or seizing of real estate ownership occurs.
4. Results
For ZFT and GSS in the NG-CBD (a), from two perspectives of modeling using 3D partitioned units for buildings and expression by 3D parcels of land, we validated the simulation and display of the model of 3D partitioned units for buildings on the expression of 3RE rights, and the property rights composition and conflict analysis of 3D parcels of land. Moreover, we proposed a practical solution method, which was as follows.
Fulfilling the modeling of 3D parcels and partitioned units for buildings. The objects of specific property rights modeling include the main building, annex, and underground space of ZFT; the underground third floor of GSS; and the subway track. We can see from b that the model of 3D partitioned units for buildings of the entire research area can reflect the realistic building structure, achieve the integrated modeling from above-ground to the underground, and clearly express the rights statuses of different floors and their 3D distributions using different colors.
The model 3D partitioned units for buildings can be detailed to room expression. We can see from c that the model of 3D partitioned units for buildings is detailed to the room and achieves refined administration, associates the 3D partitioned units for buildings with the real estate registration data, and can query the real estate attribute information of each room.
3D parcels of land can achieve a unified expression. Through the pull-up modeling of a 2D parcel of land that different buildings belong to (Wu et al. Citation2019), the 3D parcel of land was obtained, as shown in d. The model of 2D/3D hybrid land parcels can together represent the use range of above/below land. The various rights statuses and their locations at the 3D parcel of land can be obtained by different colors marked. In particular, the relatively obvious conflict property rights between parcels in space can be manifested. We propose two resolution schemes to solve the issue of conflict between 3D property rights in space use. Of course, which scheme to adopt depends on the relevant laws and regulations for the local underground property right.
9 Simulation of SIM-3RE on the right expression of 3RE
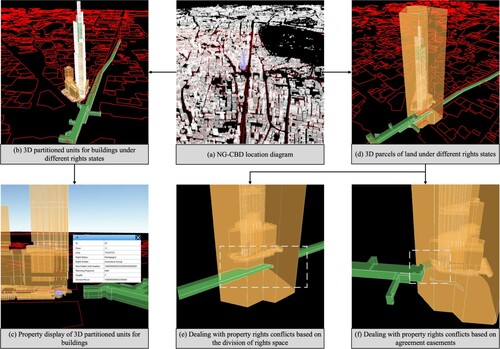
First scheme for the resolution of the conflict between property rights: The conflict between property rights of parcels of land is processed based on the manner of right space division. As shown in e, the tracked parcel of land of GSS passes through the underground part of the parcel of land of ZFT, causing conflict between property rights. Because it is very obvious that the intersection of parcels of land of GSS and ZFT belongs to the continuous part of the subway rail, we divided the use rights on the parcel of land of ZFT based on the way the space was divided and proposed that the intersection belongs to the subway track, therefore solving the problem of conflict between property rights.
Second scheme for the resolution of the conflict between property rights. The conflict between property rights of parcels of land in their space use is processed based on easement agreement. As shown in f, the parcel of GSS is embedded in the parcel of land of ZFT. What should be clarified is that the land usage rights of the intersection separately belong to ZFT and GSS. The land parcel actually used by GSS is called the dominant tenement; for ZFT, the land parcel serves others and is called the servient tenement. The land user of the dominant tenement is considered to possess the easement and is called the dominant owner; the person who uses the servient tenement is considered to have the obligation to serve and is called the server of the servient owner.
5. Discussion and conclusion
In this paper, we selected the NG-CBD in China as a typical 3D spatial research area of urban construction, and it has certain representativeness as a research area. At present, there are many big cities with relatively developed economies in China, and it is a trend of future development to adopt the 3D administration model for the registration of real estate rights (Li et al. Citation2016). However, for some small cities with relatively low levels of economic development, the urgent need to establish a 3RE administration model probably is not strong (Griffith-Charles and Sutherland Citation2019). The method proposed in this paper is more embodied in the intensive characteristic compared with previous researches. We make an attempt to reuse the existing cadastral data and the survey data of real estate as far as possible in order to minimize the modeling expense. According to the experimental process and results, because the collected data were relatively complete and involved multiple departments—construction, cadastre, and house property—the workload of data collection was small, and the data on elevation did not need much supplementation with elevation data collected by surveying. Cost minimization would also rely on the level of automation in the modeling. Based on the research results on the SIM-3RE model proposed in this paper, we have formed a complete set of tools for automated 3RE modeling and visual management, which does not require much manual intervention. Of course, from the perspective of visualization effects, because our toolset is mainly established on the needs of legal property registration and administration, the models of 3D partitioned units for buildings and 3D parcels of land established in this paper are likely not detailed enough. This is different from the tools, operational requirements of some intelligent cities, or Building Information Modeling based physical building administration, which areas more focused on the virtualization display and maintenance of inner facilities and structural details. Therefore, in the future, we can further integrate the 3D real estate model and BIM or CityGML models, committed to the urban information sharing and intelligent governance and to better serve the urban residents.
Acknowledgements
This work is supported by the project of the National Natural Science Foundation of China under grant number41471318. And the data used in this paper were provided by Nanjing Urban Planning and Natural Resources Bureau.
Data availability statement
All data used during the study were provided by a third party, Nanjing Urban Planning and Natural Resources Bureau. Direct requests for these data must be made to the provider as indicated in the Acknowledgments. The confidential data include cadastral map of the NG-CBD region, floor plan map of ZFT, as-built drawings and construction completion report. So these data cannot be shared at this time.
Disclosure statement
No potential conflict of interest was reported by the author(s).
Additional information
Funding
Notes on contributors
Changbin Wu
Changbin Wu PH.D., associate professor, engaged in GIS and land information system research for a long time.
Xinxin Zhou
Xinxin Zhou PH.D., his research interests are 3D modeling and machine learning.
Hua Tang
Hua Tang Director of Nanjing land and resources information center, expert of land and real estate information system, with rich practical experience.
Yuan Ding
Yuan Ding PH.D., his research interests are 3D modeling and map label auto placed.
References
- Aien, A., et al., 2013. Towards integration of 3D legal and physical objects in cadastral data models. Land use policy, 35, 140–154. doi: 10.1016/j.landusepol.2013.05.014
- Alkan, M., and Polat, Z.A., 2016. Design and development of LADM-based infrastructure for Turkey. Survey review, 356 (49), 370–385.
- Arroyo Ohori, K., Ledoux, H., and Stoter, J., 2015. A dimension-independent extrusion algorithm using generalised maps. International Journal of Geographical Information science, 29 (7-8), 1166–1186. doi: 10.1080/13658816.2015.1010535
- Chen, L., 2014. Land registration, property rights and institutional performance in China: progress achieved and challenges ahead. Hong Kong Law J, 43 (3), 841–864.
- Ding, Y., et al., 2017. Extrusion approach based on Non-overlapping footprints (EABNOF) for the construction of geometric models and topologies in 3D cadasters. Isprs International Journal of Geo information, 6 (8), 232. doi: 10.3390/ijgi6080232
- Döner, F., et al., 2010. 4D cadastres: first analysis of legal, organizational, and technical impact—With a case study on utility networks. Land use policy, 27 (4), 1068–1081. doi: 10.1016/j.landusepol.2010.02.003
- El-mekawy, M., Paasch, J., and Paulsson, J., 2014. Integration of 3D cadastre, 3D property formation and BIM in Sweden. 4th International Workshop on 3D cadastres. Dubai: United Arab Emirates, 9–11.
- Felus, Y., et al. 2014. Steps towards 3D Cadastre and ISO 19152 (LADM) in Israel: Proceedings 4th International Workshop on 3D Cadastres, Dubai, United Arab Emirates, 9-11 November 2014.
- Griffith-Charles, C., and Sutherland, M., 2013. Analysing the costs and benefits of 3D cadastres with reference to Trinidad and Tobago. Computers, environment and urban systems, 40, 24–33. doi: 10.1016/j.compenvurbsys.2012.07.002
- Griffith-Charles, C., and Sutherland, M., 2019. 3D cadastres for densely occupied informal situations: necessity and possibility. Land use policy, 98, 104372. doi: 10.1016/j.landusepol.2019.104372
- Guo, R., et al., 2013. Developing a 3D cadastre for the administration of urban land use: A case study of shenzhen, China. Computers Environment and urban systems, 40, 46–55. doi: 10.1016/j.compenvurbsys.2012.07.006
- Guo, R., et al., 2016. ACSEBUL: An approach for the construction of spatial entities based on unified logic. Transactions in GIS, 20 (2), 299–327. doi: 10.1111/tgis.12169
- Interim Regulation on Real Estate Registration. 2014. (in Chinese).
- Ioannidis, C., et al., 2015. 5D Multi-Purpose land information system. eurographics Workshop on urban data modelling and visualisation. the Netherlands: Delft.
- ISO, 2012. IS 19152, geograpic information –Land Administration Domain model(LADM), ed. 1. Geneva, Switzerland: ISO.
- Kalantari, M., et al., 2015. A roadmap to adopt the Land Administration Domain Model in cadastral information systems. Land use policy, 49, 552–564. doi: 10.1016/j.landusepol.2014.12.019
- Kaňuk, J., Gallay, M., and Hofierka, J., 2015. Generating time series of virtual 3-D city models using a retrospective approach. Landscape and urban planning, 139, 40–53. doi: 10.1016/j.landurbplan.2015.02.015
- Lee, B., et al., 2015. Improvement of the Korean LADM country profile to build a 3D cadastre model. Land use policy, 49, 660–667. doi: 10.1016/j.landusepol.2015.10.012
- Lemmen, C., and Van Oosterom, P., 2011. ISO 19512: The land administration domain model. Proceedings International Conference land policies in east Africa, Kampala, Uganda, 3-4 November 2011.
- Li, L., et al., 2016. 3D modeling of the ownership structure of condominium units. Computers, environment and urban systems, 59, 50–63. doi: 10.1016/j.compenvurbsys.2016.05.004
- Oyetayo, B.S., et al., 2015. An analysis of 3d situation as A prospect for land Administration Domain model (ladm) in Nigeria: A Malaysian initiative. Jurnal teknologi, 77 (14), 7–13. doi: 10.11113/jt.v77.6441
- Prieto, I., Izkara, J.L., and Béjar, R., 2018. A continuous deployment-based approach for the collaborative creation, maintenance, testing and deployment of CityGML models. International Journal of Geographical Information science, 32 (2), 282–301. doi: 10.1080/13658816.2017.1393543
- Property Law of the People’s Republic of China. 2007. (in Chinese).
- Rahman, A.A., et al., 2012. 3d modelling for multipurpose cadastre. 3rd International Workshop on 3D cadastres: developments and practices, shenzhen, China, 25-26 October 2012.
- Rajabifard, A., Atazadeh, B., and Kalantari, M., 2018. A critical evaluation of 3D spatial information models for managing legal arrangements of multi-owned developments in Victoria, Australia. International Journal of Geographical Information science, 32 (10), 2098–2122. doi: 10.1080/13658816.2018.1484125
- Shojaei, D. 2014. 3D cadastral visualisation: understanding users’ requirements. (PHD). The University of Melbourne, Australia.
- Shojaei, D., et al., 2017. Geometrical data validation in 3D digital cadastre− A case study for Victoria, Australia. Land use policy, 68, 638–648. doi: 10.1016/j.landusepol.2017.08.031
- Siejka, M., Ślusarski, M., and Zygmunt, M., 2014. 3D+ time cadastre, possibility of implementation in Poland. Survey review, 46 (335), 79–89. doi: 10.1179/1752270613Y.0000000067
- Stoter, J.E. 2004. 3D cadastre. (PHD). Delft University of Technology, The Netherlands.
- Van Oosterom, P., et al., 2006a. Aspects of a 4D cadastre: a first exploration. Proceedings of shaping the change, XXIII international FIG congress.Munich, Germany, 8-13 October, 2006.
- van Oosterom, P., et al., 2006b. The core cadastral domain model. Computers, Environment and urban systems, 30 (5), 627–660. doi: 10.1016/j.compenvurbsys.2005.12.002
- Višnjevac, N., et al., 2018. Developing serbian 3D cadastre system-challenges and directions. Proceedings of the 6th International FIG 3D cadastre workshop, delft, The Netherlands, 2-4 October 2018.
- Wu, C., Ding, Y., and Zhou, X., 2019. Three-dimensional data modeling of real estate objects in China. Journal of geographical systems, 4, 1–18.
- Yu, C., et al., 2017. LADM-based modeling of the unified registration of immovable property in China. Land Use policy, 64, 292–306. doi: 10.1016/j.landusepol.2017.02.034
- Zhang, J., et al., 2016. 3D cadastral data model based on conformal geometry algebra. ISPRS International Journal of Geo-information, 5 (2), 20. doi: 10.3390/ijgi5020020
- Zulkifli, N., Abdul Rahman, A., and Van Oosterom, P., 2014. 3D strata objectsregistration for Malaysia within the LADM framework. 4th International Workshop on 3D cadastres. Dubai: United Arab Emirates. 9–11 November 2014.
Appendix A
A fuzzy spatial registration algorithm based on the tangent space curve
In this paper, we proposed a fuzzy spatial registration algorithm based on the tangent space curve (FSRA-TSC) for house floor plan map, which can be applied to space registration of most floor plan maps. This algorithm can realize the spatial control points mapping between source floor plan Map (S-FPM, to realize matching) and target floor plan (T-FPM, the matching benchmark). The specific steps are shown in . In consideration of the floor plan structure of buildings with various forms, artificial space registration is the most tedious step in 3D Visualization of Buildings Construction. So, we proposed an automatic space registration algorithm, which is to be of great significance for users to improve SIM-3D efficiency and save the workforce.
10 Algorithm flow chart of FSRA-TSC
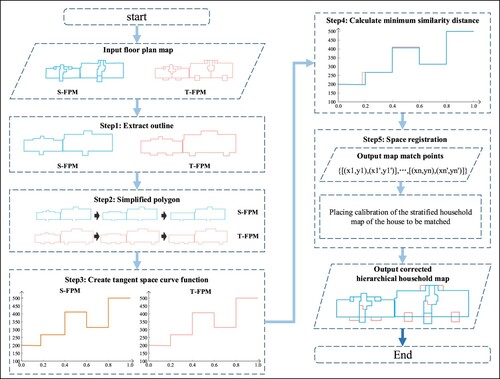
Step 1: Extracting the outline of S-FPM and T-FPM. As the interior features of the floor plan map are numerous and complex, and the information density is low, so the outer contour information of the floor plan map can be extracted from the primary data of the real estate before the fuzzy space registration operation. This operation can improve the efficiency and accuracy of the application.
Step 2: Simplifying polygon of S-FPM and T-FPM. Simplified operation requires users to remove the unimportant shape features and retain the essential shape features; This operation can improve the accuracy and speed of space registration. Simplification Step (1): Calculating the value of (Equation 1), and comparing the magnitude relationship between
value and the specified threshold parameter
, if
<
, It reaches the termination condition so that it will end the iteration. Otherwise, it will continue the calculation and removal of vertex relevancy. Simplification Step (2): Calculating the value of vertex relevancy K (Equation 2) of each vertex in S-FPM or T-FPM, and remove the vertex with the lowest value of vertex relevancy, until
is less than
. To ensure the accuracy and efficiency of space registration,
is generally in the range from 0.6–1.
(1)
(1) where
- threshold value;
- the number of S-FPM vertices;
- the number of T-FPM vertices.
(2)
(2) where
,
, … ,
-the outline of S-FPM or T-FPM;
,
, … ,
- the vertices of S-FPM or T-FPM;
- the normalized length of the line segment;
- the absolute value of the rotation angle of
and
,
.
Step 3: Creating the tangent space curve of S-FPM and T-FPM. FSRA-TSC needs to set the starting points respectively on the outer contour polygon of S-FPM or T-FPM. From the starting point, FSRA-TSC constructs the relation function between the normalized length of the target point and the angle sum of the adjacent edges of the vertex, then construct the initial tangent space description function. Generation Step (1): There is a point named on S-FPM or T-FPM, and the tangent space description function expressing shape features of S-FPM or T-FPM is constructed from
as the starting point. Generation Step 2: from
, the vertical axis of the tangent space describes the curve
(Equation 3) is the accumulation of rotation angles formed by two adjacent edges of each vertex of S-FPM or T-FPM, and the horizontal axis is the normalized distance
(Equation 4) along S-FPM or T-FPM from the starting point
.
(3)
(3) where
- the vertical axis of the tangent space describes curve;
- azimuth, representing the angle
between line segment
and any reference line, such as the X-axis.
(4)
(4) where
- the horizontal axis of the tangent space describes curve;
- the perimeter of S-FPM or T-FPM;
- the length of the passing side.
Step 4: Calculating the minimum similarity distance between S-FPM and T-FPM. The last steps can get S - FPM and T - FPM initial translation collection for the tangent space describing function refactoring. In this collection, FSRA - TSC needs to iterate over the data in the collection and update the starting point, then solve the new function. So we can get the most similarity and minimum distance of two starting points between S - FPM and T – FPM. The similarity distance between S-FPM and T-FPM can be expressed as Equation 5. The value of most similarity and the minimum distance is more similar, the two polygons are more similar.
By moving the starting point along the outline of the polygon, a new tangent space description curve can be obtained. The formula for solving the most similarity and minimum distance among all the moving distances can be expressed as Equation 6.
(5)
(5) where
- the most similarity and minimum distance of S-FPM and T-FPM;
- the tangent space description curve with any start point in S-FPM;
- the tangent space description curve with any start point in T-FPM.
(6)
(6) where
- the most similarity and minimum distance between S-FPM and T-FPM;
t- displacement degree.
Assuming that the vertices value of S-FPM and T-FPM respectively is m and n, the most similarity and minimum distance value need to be calculated m*n times, that is, the most similarity and minimum distance value takes the tangent space curve with a vertex as the starting point of the polygon, and the time complexity of the calculation is O(m*n*log (m*n)).
Step 5: Space registration between S-FPM and T-FPM. The above operation can obtain the difference value of two starting points, and the value of most similarity and minimum distance, then the space registration distance of S-FPM and T-FPM can be solved.
At this time, the two polygons described with and
as the starting points were most similar. Therefore, space registration was conducted on the floor plan map with
and
selected as space registration points of polygons. The comparison of tangent space functions is shown in .