
 ?Mathematical formulae have been encoded as MathML and are displayed in this HTML version using MathJax in order to improve their display. Uncheck the box to turn MathJax off. This feature requires Javascript. Click on a formula to zoom.
Abstract
This study presents a computational model for investigation of the air permeability coefficient and water-vapor resistance coefficient through 3D textile layer. The effective values of the coefficients are highly dependent on the volumetric internal structure of the layer. The computational study of air and water vapor flow has been performed a microscale finite element model of the representative volume of the textile layer by taking into account the real configuration the yarns and filaments. The effective values of the coefficients were obtained by using taking average values of air and water vapor fluxes through the thickness of the representative volume. The steady state computational models in micro scale are based on Navier-Stokes and Brinkman partial differential equations. The simulations were performed in Comsol Multiphysics 5.3a software environment by using laminar flow (.spf) application mode. Numerical results for the air permeability of the samples were obtained, analyzed and validated by comparing against experimental data. Good agreement with experimental data has been achieved.
COMSOL software was used to simulate air permeability and water-vapor resistance of 3D textile layer.
The numerical model has demonstrated its efficiency comparing with experimental air permeability measurements.
Highlights
1. Introduction
Spacer fabrics are three-dimensional textile structures (3D textiles) formed of two separate outer layers (top and bottom layer) that are combined together by a volumetric spacer yarns system or spacer layer (Ertekin & Marmarali, Citation2011). Spacer fabrics can be manufactured by warp knitting, weft knitting, weaving, non-woven, braiding, etc. (Liu & Hu, Citation2011). Nowadays, 3D fabrics are widely used in aerospace, automotive, military, medical, human body and engineering structures protection, sports and leisure, and many other applications, in underwear and outerwear clothing. The open internal structure is able to ensure good heat and moisture transfer, thus providing thermo-physiological comfort (Hearle, Citation2015). Theoretical investigations of the physical behavior of 3D textiles are complicated due to complex internal structure, which leads to extremely complex air flow patterns around the spacer yarns and through bounding layers. The air flow through the fabric is a physically coupled with heat and moisture transfer and other physical processes. The practically applicable models are multi-scale by virtue, as the internal physical processes and overall behavior of the 3D textile layer are considered in different space and time scales (Barauskas & Abraitiene, Citation2011).
During the last decade various aspects of air and water vapor exchange through 3D textiles have been investigated. It is generally considered that one of the most important comfort properties of textile is its air permeability (Kulichenko, Citation2005). It may affect the wearing comfort properties in several different ways. For instance, liquid and water vapor transmission properties are closely related to the air permeability value. Besides this, thermal resistance property of a fabric is highly influenced by the air mass trapped within the fabric itself (Pezzin, Citation2015). According to UNI EN ISO 9237 standard, air permeability is defined as air flow rate penetrating the unity area of the test specimen under specified values of the pressure difference and the test duration. Kyosov et al. (Citation2016) investigated air permeability of ensembles of two woven structures by applying the FLUENT CFD software. The mathematical model was based on Reynolds-averaged Navier–Stokes (RANS) partial differential equations plus the continuity equations. It was found that air permeability was strongly influenced by the order of arrangement of the layers and distance between them. The lowest air permeability coefficient was obtained when distance between layers was 3–5 mm (Kyosov et al., Citation2016). S. S. H. Dehkordi et al. (Citation2017) used two different k-ε and k-ω turbulence models from the group of the Eddy Viscosity Models (EVMs) to simulate air permeability of knitted fabrics with rib and interlock structures. Geometry model of a unit cell of each sample was created by using CATIA software by Vassiliadis model, which considers the real shape of knit loop in three-dimensional space. Nordlund and Lundström (Citation2008) numerically investigated the effect of scale porosity of fiber reinforcements on local permeability. Channel model was described by Brinkman’s and the continuity equations. The simulations were performed with ANSYS CFX5.7.1 software. The results portrayed that fiber bundles with high fiber density can be eliminated from permeability models. Turan and Okur (Citation2013) theoretically predicted fluid flow of woven fabrics in-plane and through-plane directions. The through-plane and in-plane flow mechanisms of fabric were studied together by analyzing effective pore properties separately for these two flow directions. Das et al. (Citation2011) investigated vertical wicking through yarn structure. The model was based on the Laplace equation and the Hagen–Poiseuille’s equation on fluid flow taking into account fiber denier, yarn denier, fiber cross-sectional shape and number of fibers in the yarn and yarn twist. Zhu et al. (Citation2018) measured and analyzed air permeability of cotton woven fabrics by using analytical models such as Kozeny–Carman model, Forchheimer model, and Hagen–Poiseuille mode that consider porosity and pore diameter or porous area. It was found that the Hagen–Poiseuille equation had good accuracy with the experimental results, when the pressure drop was less than 60 Pa. Analytical models of air permeability did not demonstrate good prediction when the gas flow had higher velocity or Reynolds number (Zhu et al., Citation2018). Zupin et al. (Citation2012) measured the construction parameters: the number of pores that was calculated as a product of warp and weft settings; effective hydraulic diameter of pores; and the porosity calculated from the measured mass and thickness of fabrics for 36 woven fabric samples in order to predict the air permeability of one-layer woven fabrics. Air permeability measurements were performed with the Air Permeability tester FX 3300 Labotester III (Textest Instruments) according to the ISO 9237:1995 (E) standard. The pressure difference was set 200 [Pa] on an area of 20 cm2. Cotton warp and weft yarns were of the same linear density for all fabrics, i.e. 17 × 2 tex, only warp being sized (Zupin et al., Citation2012). Pezzin (Citation2015) numerically predicted air permeability of nine different fabric structures that was measured by Zupin et al. (Citation2012). The geometry of one-layer woven fabrics was built using TexGen software, then imported into finite element software Comsol Multiphysics in order to predict the air permeability coefficient (Pezzin, Citation2015).
The other important thermo-physiological parameter describing the moisture transport is the water-vapor resistance coefficient (Ret). Different test methods (cup method, “sweating guarded-hotplate” method, permetest method) can be used to determine the water-vapor resistance of textiles. According to ISO 11092:2014 standard water-vapor resistance is defined as water-vapor pressure difference between the two faces of a material divided by the resultant evaporative heat flux per unit area in the direction of the gradient (ISO 11092:2014(en) (Citationn.d.)). Irandoukht and Irandoukht (Citation2011) developed linear and non-linear regression models that connect water-vapor resistance with structural properties of the fabric (Irandoukht and Irandoukht, Citation2011). Neves et al. (Citation2015) proposed methodology and experimental procedures to determine parameters that are required for numerical studies of heat and mass transfer through textiles. The water-vapor resistance was determined in laboratory using “sweating guarded-hotplate”. The developed methodologies allowed to consider the presence of water in the fibers, and thus, to increase the accuracy of measurements of textile characteristics and corresponding transport properties (Neves et al., Citation2015). According to Horrocks and Anand (Citation2000) water-vapor resistance of clothing layers can be rated into three classes. The first class has Ret values greater than 150 m2 Pa W−1, and is impermeable, i.e. they offer no perceivable comfort to the wearer. The second class has Ret values between 20 and 150 m2 Pa W−1 and are rated as medium performance. The third class presents Ret values less than 20 m2 Pa W−1 and have the best performance in terms of ‘breathability’ (Horrocks & Anand, Citation2000).
The aim of this study was to create a close to reality 3D micro scale model for simulation of air and water vapor flow phenomena that occurs between human skin and outer environment through 3D textile layer. This research work consists of two parts. In the first part air permeability coefficient was developed and validation was done basing on experimental data presented in (Zupin et al., Citation2012), theoretical investigations in (Pezzin, Citation2015). In the second part the water-vapor resistance coefficient has been found by performing simulation, which imitates the experimental process in accordance with ISO 11092:2014/LST EN 31902:2002 standard and theoretical investigations presented in (Barauskas & Abraitiene, Citation2011).
2. Materials and methods
2.1. Materials
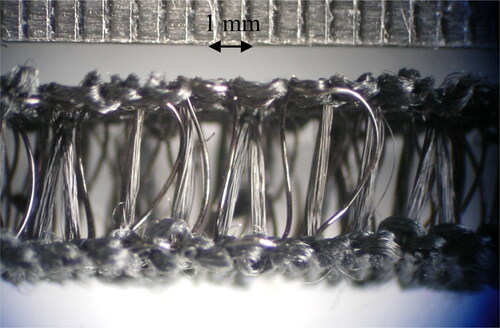
Creation of a detailed representative geometry of textile layer that enables to examine the effect of air flow through 3D textile is an important challenge in such kind of analysis. presents the cross-section picture of 3D textile.
Figure 1. The sample of 3D textile.
In the first part air permeability coefficient was calculated and validation was done basing on experimental data presented by Pezzin (Citation2015) and Zupin et al. (Citation2012). In , the obtained air permeability coefficients of one-layer plain weave woven fabrics are shown. In this research, the models of two different plain-woven fabric structures were created which represent the top and bottom layers of 3D textile.
Table 1. Measured construction parameters and air permeability of samples (Zupin et al., Citation2012).
In the second part the water-vapor resistance Ret coefficient of 3D textile was developed and validated on the results of the experimental research presented by Barauskas and Abraitiene (Citation2011). The experimental value Ret was obtained using The Sweating Guarded Hot Plate. The heat exchange processes occurring close to the surface of the human skin were simulated in accordance with the Sweating Guarded Hot Plate M259B experimental scheme given in . In accordance with LST EN 31902:2002/International standard ISO 11092:2014 the measurement test of the water-vapor resistance Ret is carried out at the temperature T = 35 °C, relative humidity 40% (ϕ = 0.4) and air flow velocity 1 m/s. The classification of fabrics according to their Ret values is evaluated as in .
Figure 2. Scheme of the model simulating A Sweating Guarded Hot Plate M259B (Neves et al., Citation2015) experiment.
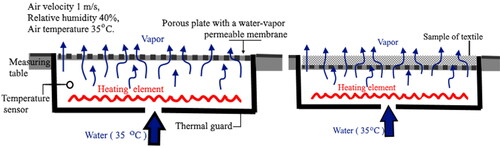
Table 2. Thermal-physiological comfort rating system in accordance with Ret coefficient values (Relji et al., Citation2016).
In accordance with ISO 11092:2014(en), such isothermal conditions prevent water-vapor condensation within the test specimen. During the test, the heating power H required to maintain the plate temperature at T = 35 °C is measured. The water-vapor resistance coefficient is calculated as where A is the surface area of the specimen, pv is the water-vapor partial pressure, psat is the saturation water-vapor partial pressure given in pascal.
2.2. Methods
2.2.1. Geometric models
The unit cell models of specific textile layers were developed in order to simulate the physical processes influencing the air permeability and water-vapor resistance coefficients of the fabrics. Model 6 was used for the representation of two-layer woven fabric combined of two replicas of Model 3. The dimensions of air domain in Models 1, 3, 5, 6, 7 are 1.4 mm × 1 mm × 10 mm in and the thickness of textile layer domain is 0.439 mm as seen in . The dimensions of the air domain in Models 2 and 4 are 1.05 mm × 1 mm × 10 mm and the thickness of the textile layer domain is 0.438 mm.
Figure 3. Geometry of Model 1, Model 2, Model 3, Model 4, Model 5, Model 6.
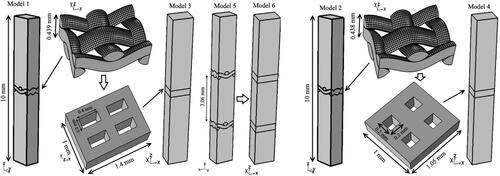
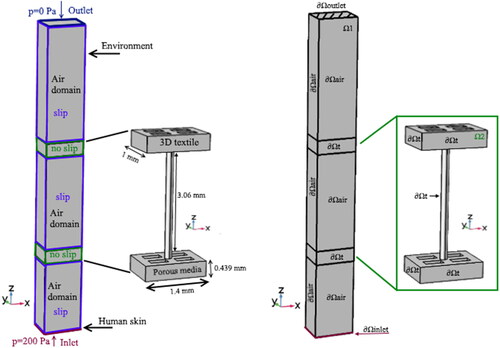
Model 7 is equivalent to the 3D textile layer representative unit cell model, where top and bottom layers were based on Model 6 and combined together with spacer yarn as seen in . In Models 5, 6, 7 distance between two textile layers is 3.06 mm. In Model 7 the radius of spacer yarn is 0.08 mm. The spacer yarn is made from polypropylene that has 18 tex linear density.
Figure 4. Model 7 geometry with boundary conditions for air permeability simulation.
The complex geometry (Model 1, Model 2) of woven textile layer (unit cell) was created by using TexGen software. Models 1 and 2 (see in ) were used as representative models for one-layer woven fabric. Models 3 and 4 present the simplified fabric internal geometry structure based on Models 1, 2. Model 5 represents the two-layer woven fabric combined of two replicas of Model 1. The summary of Models 1–7 properties is shown in .
Table 3. Air domain and textile layer parameters.
The properties of the finite element grid are presented in . For discretization of the air domain the first order finite elements for velocity and for pressure approximation (P1 + P1) were used.
Table 4. Statistics of completed mesh.
2.2.2. Equations for air permeability and water-vapor resistance coefficient
In order, to simulate the processes influencing the air permeability and water-vapor resistance of the fabric the following assumptions were made:
Steady-state flow
Single phase flow
Low Re number
The flow is incompressible (constant mass density ρ) because the conditions are considered as nearly isothermal. Therefore, the variation of ρ with p is very small.
Newtonian fluid (constant dynamic viscosity μ)
The laminar incompressible flow numerical simulations were performed. In COMSOL Multiphysics the Laminar flow interface allows to use Navier-Stokes and Brinkman equations for simulating the air flow through fabric. Domain notation Ω stands for the union of computational domains that consist of two subdomains Ω1 (air domain) and Ω2 (porous media domain (textile)). The domain boundary is defined as ∂Ω. Vector n stands for the outer unit normal vector and t denotes the tangential vector.
The Navier-Stokes equations were used to represent the air motion around through internal yarn structure of the textile layer. Navier-Stokes equations consist of momentum Equationequation (1)(1)
(1) and mass continuity Equationequation (2)
(2)
(2) as (Vafai, Citation2015)
(1)
(1)
(2)
(2)
where ∇—the gradient operator, u—velocity vector of air flow in m/s, ρ—mass density of air in kg/m3, p—pressure of air in Pa, μ—dynamic viscosity of air Pa·s, I—identity tensor and F denotes external force (for instance gravity, body forces) vector. The momentum Equationequation (1)
(1)
(1) consists of inertial term (Stokes flow), pressure gradient, effects of viscous and external forces.
The Brinkman equation was used for simulation of the air flow around the yarn structure considered as a porous medium. The Brinkman equation for steady-state porous media flow reads as (Vafai, Citation2015)
(3)
(3)
(4)
(4)
where ϵp—constant porosity, κ—intrinsic permeability tensor in m2,
—Forchheimer drag coefficient (inertial flow coefficient and the turbulence factor). In our case factor value
=0 is assumed. For zero mass source (Qm = 0) the continuity Equationequation (4)
(4)
(4) reduces to EquationEq. (2)
(2)
(2) .
The simplified version of Brinkman equation reads as
(5)
(5)
Constant ambient temperature of 20 °C was assumed in the vicinity of all domains. The inlet pressure boundary condition was set 200 Pa and the outlet pressure was set as the atmospheric pressure. Full slip air flow boundary conditions were set at all external walls surrounding the representative model. No-slip condition was set on all internal walls, where the air flow velocity is assumed as zero (see in ). All boundary conditions applied in the models are summarized in .
Table 5. Boundary conditions for the simulation of air permeability.
The air permeability coefficient depends on the internal structure of the 3D textile. In order to obtain the close-to reality models the porosity and intrinsic permeability of the yarns were taken into account. Material porous matrix properties that were used in Ω2 is shown in .
Table 6. Porous matrix properties (Pezzin, Citation2015).
For prediction of water-vapor resistance coefficient the same models were used, where dry air material properties (dynamic viscosity and density) were changed to water-vapor properties at temperature T = 35 °C and relative humidity 40% (see ). Dynamic viscosity of water-vapor was determined by the linear expression in Pa·s
investigated in literature (Tsilingiris, Citation2008). This expression is valid in temperature range
Density of water-vapor was obtained from ideal gas law. The ∂Ωinlet boundary condition value was changed into normal inflow velocity in accordance with standard LST EN 31902/International standard ISO 11092:2014 (see ).
Table 7. Material properties.
Table 8. Boundary conditions for the simulation of water-vapor resistance coefficient.
3. Results and discussion
3.1. Air permeability
The purpose of the performed calculations was to obtain the average air and water-vapor rates passing through the unity area of the textile layer. The obtained results are presented in where second column indicates the number of layers, structural density of models and simplified geometry models (Models 3–7).
Table 9. Calculated air permeability and water-vapor resistance values.
The results of simulated air permeability values are shown in . The fourth column refers to differences between the simulated and experimental (see in ) air permeability coefficient values. The error was calculated from EquationEq. (6)(6)
(6) .
(6)
(6)
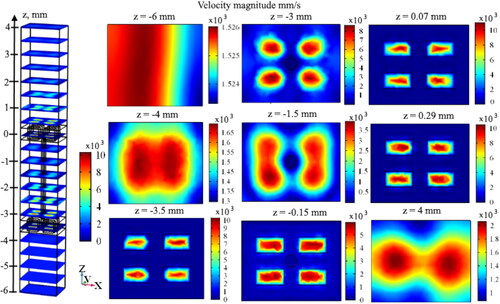
It was obtained that air permeability error did not exceed 3%. The number of textile layers was increased in Model 5, where air permeability value was obtained as lesser compared against Model 1. Also, the air permeability value was lower in Model 6 compared to Model 3 where complex geometry was simplified in order, to save computation time. The values of effective diameters of the openings in the simplified geometry models were calculated by taking into account the mass flow rate simulation results obtained from representative models (Models 1 and 2). summarizes the flow velocity distribution for Model 7 at different through-thickness positions along axis Oz. The average value of air permeability is 1525.9 mm/s at the inlet (∂Ωinlet, z = −6 mm) and outlet (∂Ωoutlet, z = 4 mm) positions are shown in the top left and bottom right subplots of . From Model 7 the mass flow rate of the air was obtained as 2.5727 × 10⁻⁶ kg/s.
Figure 5. Simulation results of Model 7. Distribution of the velocity flow.
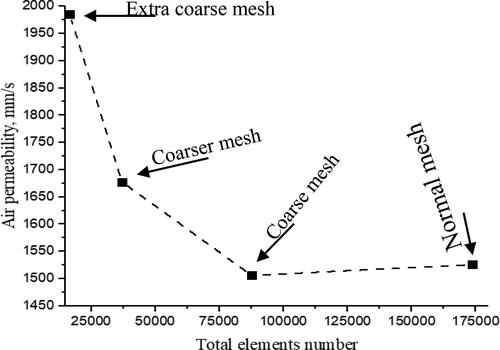
In order to verify the convergence of the solution the influence of mesh refinement on the values of computed results was analyzed for Model 7.
illustrates the dependencies of calculated air permeability coefficient values against the mesh refinement. In this simulation (Model 7) four different finite element meshes from 16,539 to 1,73,561 elements were used. Coarse mesh and normal mesh provided the average air velocity values as 1506.1 mm/s, 1525.9 mm/s. Therefore, the computations could be reasonably regarded as convergent.
Figure 6. Dependence of calculated air permeability coefficient values against the number of elements.
3.2. Water-vapor resistance
The water-vapor resistance coefficient under isothermal conditions was recalculated in accordance with reference (Barauskas & Abraitiene, Citation2011). The water-vapor resistance coefficient reads as
where
—density of water-vapor at T = 35 °C temperature
—water-vapor transmission coefficient
—the mass flow rate of water vapor (kg/s), A—is the area of the measuring unit (m2),
—pressure difference (between boundaries ∂Ωinlet and ∂Ωoutlet), psat—the saturation water-vapor partial pressure at T = 35 °C temperature (5620 Pa), pv—the water-vapor partial pressure at 40% humidity (2250 Pa), on ∂Ωinlet.
presents the obtained values of water-vapor transmission and water vapor resistance coefficients. Models 1 and 3 demonstrate that water-vapor resistance values are dependent on the internal geometrical structure of the layer. The value of the water-vapor resistance coefficient increases with the number of textile layers. Models 5 and 6 consist of two textile layers and the water-vapor resistance values as Ret=7.8337 s/m and Ret=6.3595 s/m, respectively. In Model 6 the water-vapor resistance value is lower than in Model 5 due to roughly approximated geometry. The experimental value of the water-vapor resistance coefficient of 3D textile layer was obtained in reference (Barauskas & Abraitiene, Citation2011) as 6.36 s/m. In this investigation the calculated value was 6.0769 s/m, which is lower than the experimental one. However, the correspondence of the results can be considered as satisfactory. Anyway, the simulated geometry could inevitably have certain distinctions from the real one. For two-layered textile numerical models the water-vapor resistance values were in-between 6.0769–7.8337 s/m. According to the rating system (see in ) the investigated textile is very breathable and comfortable.
4. Conclusion
Computer simulations of air permeability and water-vapor resistance coefficients through textile layer were carried out by using Comsol Multiphysics 5.3a software. The air permeability simulation demonstrated that two Models 1 and 2 provided a good agreement of the results against the known experimental data. Based on the results obtained in Models 1 and 2, increase weft density of fabric led to decrease of air permeability value.
While performing the air and water vapor flow simulations through geometrically complex structures, such as woven, knitted or spacer fabric yarn systems, the convergence of the model is a very important issue, which requires special attention. In Models 3 and 4 that employed a representative cell based on very simplified 3D geometry of textile layer, the solving time was reduced, as well as a satisfactory agreement with previous results was achieved. Though simulation error did not exceed 3%, this result was largely depended on proper selection of the effective diameter of the openings, which only imitate the actual air flow transparency of the top and bottom layers of the spacer fabric.
However, the water-vapor resistance simulation results were more dependent on the internal geometry. Model 1 and Model 2 describe the internal geometrical structure of the textile layer that is rough and jagged when observed at the microscopic scale. Probably this is the reason that near such a surface certain amounts of the fluid are trapped and temporarily immobilized. The fluid particle is trapped until another fluid particle having sufficient momentum forces it out. The viscosity of the flow plays an important role in this momentum exchange, which influences the simulation results. Certain differences in simulated pressure values may be obtained when using close to real geometry and approximate geometry models at low Reynolds number. In Model 1 pressure difference between boundaries ∂Ωinlet and ∂Ωoutlet is 335 Pa, whereas in Model 3 it is 249 Pa. Obtained differences of simulated pressure values in Model 1 and Model 3 indicate the necessity to be very careful when using simplified models and establishing their effective geometrical parameters. Anyway, we demonstrated that simulations by using Model 7 are acceptable as they demonstrate good agreement with experimentally measured water-vapor resistance value.
List of symbols
Table
Disclosure statement
No potential conflict of interest was reported by the authors.
References
- Barauskas, R., & Abraitiene, A. (2011). A model for numerical simulation of heat and water vapor exchange in multilayer textile packages with three-dimensional spacer fabric ventilation layer. Textile Research Journal, 81(12), 1195–1215. https://doi.org/https://doi.org/10.1177/0040517510392468
- Das, B., Das, A., Kothari, V. K., & Fangueiro, R. (2011). Development of mathematical model to predict vertical wicking behaviour. Part I: Flow through yarn. Journal of the Textile Institute, 102(11), 957–970. https://doi.org/https://doi.org/10.1080/00405000.2010.529281
- Dehkordi, S. S. H., Ghane, M., Abdellahi, S. B., & Soultanzadeh, M. B. (2017). Numerical modeling of the air permeability of knitted fabric using computational fluid dynamics (CFD) method. Fibers and Polymers, 18(9), 1804–1809. https://doi.org/https://doi.org/10.1007/s12221-017-7238-0
- Ertekin, G., & Marmarali, A. (2011). Heat, air and water vapor transfer properties of circular knitted spacer fabrics. Tekstil ve Konfeksiyon, 21(4), 369–373.
- Hearle, J. W. S. (2015). Introduction. In Xiaogang Chen (Ed.), Woodhead Publishing Series in textiles, advances in 3D textiles (pp. 1–18). Woodhead Publishing. https://doi.org/https://doi.org/10.1016/B978-1-78242-214-3.00001-2
- Horrocks, A. R., & Anand, S. C. (Eds.) (2000). Woodhead Publishing Series in textiles, handbook of technical textiles (pp. 425-458). Woodhead Publishing. https://doi.org/https://doi.org/10.1533/9781855738966.372
- Irandoukht, S., & Irandoukht, A. (2011). Development of the predictive models for the fabric water vapor resistance. Journal of Engineered Fibers and Fabrics, 6(2), 40-49. https://doi.org/https://doi.org/10.1177/155892501100600205
- ISO 11092:2014(en). (n.d.). Textiles—Physiological effects—Measurement of thermal and water-vapour resistance under steady-state conditions (sweating guarded-hotplate test). https://www.iso.org/obp/ui/#iso:std:iso:11092:ed-2:v1:en
- Kulichenko, A. V. (2005). Theoretical analysis, calculation, and prediction of the air permeability of textiles. Fibre Chemistry, 37(5), 371–380. https://doi.org/https://doi.org/10.1007/s10692-006-0011-6
- Kyosov, M., Angelova, R. A., & Stankov, P. (2016). Numerical modeling of the air permeability of two-layer woven structure ensembles. Textile Research Journal, 86(19), 2067–2079. https://doi.org/https://doi.org/10.1177/0040517515619358
- Liu, Y., & Hu, H. (2011). Compression property and air permeability of weft-knitted spacer fabrics. Journal of the Textile Institute, 102(4), 366–372. https://doi.org/https://doi.org/10.1080/00405001003771200
- Neves, S. F., Campos, J. B. L. M., & Mayor, T. S. (2015). On the determination of parameters required for numerical studies of heat and mass transfer through textiles - Methodologies and experimental procedures. International Journal of Heat and Mass Transfer, 81, 272–282. https://doi.org/https://doi.org/10.1016/j.ijheatmasstransfer.2014.09.038
- Nordlund, M., & Lundström, T. S. (2008). Effect of multi-scale porosity in local permeability modelling of non-crimp fabrics. Transport in Porous Media, 73(1), 109–124. https://doi.org/https://doi.org/10.1007/s11242-007-9161-0
- Pezzin, A. (2015). Thermo-physiological comfort modelling of fabrics and garments [PhD thesis]. Politecnico di Torino. https://doi.org/https://doi.org/10.6092/polito/porto/2591973
- Relji, M., Stepanovi, J., Lazi, B., & Cerovi, D. (2016). The change of water vapour resistance of materials used. Advanced Technologies, 5(2), 73–78.
- Tsilingiris, P. T. (2008). Thermophysical and transport properties of humid air at temperature range between 0 and 100 °C. Energy Conversion and Management, 49(5), 1098–1110. https://doi.org/https://doi.org/10.1016/j.enconman.2007.09.015
- Turan, R. B., & Okur, A. (2013). Prediction of the in-plane and through-plane fluid flow behavior of woven fabrics. Textile Research Journal, 83(7), 700–717. https://doi.org/https://doi.org/10.1177/0040517512460300
- Vafai, K. (Ed.). (2015). Handbook of porous media (3rd ed.). CRC Press. https://doi.org/https://doi.org/10.1201/b18614
- Zhu, G., Fang, Y., Zhao, L., Wang, J., & Chen, W. (2018). Prediction of structural parameters and air permeability of cotton woven fabric. Textile Research Journal, 88(14), 1650–1659. https://doi.org/https://doi.org/10.1177/0040517517705632
- Zupin, Ž., Hladnik, A., & Dimitrovski, K. (2012). Prediction of one-layer woven fabrics air permeability using porosity parameters. Textile Research Journal, 82(2), 117–128. https://doi.org/https://doi.org/10.1177/0040517511424529