Abstract
In this paper, the lateral interaction between a rail vehicle and the track is investigated during cases of an occurrence of dynamic gauge widening. This is composed of the nominal track gauge, wear of the rail profiles and track widening due to wheel-rail forces on sections of curved track. A multibody simulation model is used to investigate the various influencing parameters. This model not only analyses the single rail’s lateral displacement but also tilting. Furthermore, the simulation of rail pads with adjustable stiffnesses is enabled. The resulting different contact points between the wheel and rail are represented, affecting the wheel-rail contact forces. The results reveal that changes in contact geometry caused by rail tilting depend strongly on the specific wheel and rail profiles. This is illustrated by comparing a new rail profile with a heavily worn rail profile. Particular attention is also paid to the distinction between leading and trailing wheelsets. Finally, the model is validated using measured wheel-rail forces and rail head movement, as measured on the track. A better understanding of dynamic track widening can improve the running behaviour of the wheelset on small radius curves, help protect against derailment and reduce wear on the wheel and rail.
1. Introduction
Small curve radii are common in mountainous regions, and the track systems there are exposed to heavy loads due to the high lateral forces (Y-Forces) in the contact of rail and wheel. In curved tracks, a rail vehicle faces the fundamental problem that its wheels on the left and right-hand side are connected to form a wheelset, and thus cannot build up different speeds. Therefore, conical wheel profiles are needed to allow for the required rolling radius differential that is necessary for curved running [Citation1]. In tight curves, however, this possibility reaches its limits. With the usual wheel diameters of locomotives, the curved radii that can be traversed without creepage lie within the range of 800 and 940 m. In this study, a curve with a radius of 183 m and a superelevation of 135 mm is considered. Here, considerable creep forces must inevitably arise [Citation2]. To counteract this, the nominal track gauge is increased in small radius curves. This avoids constraining forces and reduces the risk of flange climbing. For a standard gauge of 1435 mm, the smallest value allowed is 1430 mm, and the largest value allowed is 1470 mm [Citation3]. In [Citation4], several international standards for track gauge widening are compared, and their influence on the running behaviour of trains in curves with different radii is investigated. The focus is on multi-axle locomotives running on small radii, however, the effects on maintenance costs are also considered. Nonetheless, due to the wear and centrifugal forces along the curve, the dynamic gauge reaches much higher values. There are numerous parameters on which dynamic gauge widening depends, e.g. [Citation5]
Track geometry (track curve radius, cant, gauge, etc.)
Superstructure components (rail fastening type, stiffness, etc.)
Track quality (vertical track alignment)
Bogie design (type of bogie, wheelset spacing)
Running speed
Weather conditions (wet, dry)
There have already been numerous research papers written on the vertical dynamic interaction between the vehicle and track [Citation6–8]. However, there is limited research on dynamic track widening and its influence on lateral dynamic wheel-rail interaction in tight curves. In [Citation9], it is shown that rail rotation has a significant effect on the wheel-rail contact position. In contrast, the effects of rail displacement in a purely lateral direction on the contact position are negligible. Standard track models in multibody simulations for the acceptance of running characteristics of railway vehicles [Citation10] only allow for the motion of rail in two directions: lateral and vertical. Therefore, for the investigation of track widening, an elastic rail model is used that also allows for rotation of the rail. The changes in contact geometry caused by rail rotation depend greatly on the specific wheel and rail profiles and must be considered in the simulation. Optimising the rail rotation flexibility within safety limits can affect the wheelset movement and reduce wear. Reference [Citation11] deals with the improvement of the prediction method of nonlinear wheel-rail forces. The profiles of rails and wheels were measured, which enables the possibility to significantly improve the calculation of wheel-rail forces. Wheel-rail forces were measured with measuring wheelsets, the lateral position of the wheelset in relation to the track and the angle of attack of the wheelset. In addition, the longitudinal component of the force could also be measured, which is essential for understanding the vehicle’s cornering behaviour. The determined input data was used to validate the prediction methods. Extensive test runs in sharp curves were performed, and the primary suspension parameters were varied. The effect of the changed parameters on the cornering ability is shown and possible optimisation potential for the bogie design is given.
The work in [Citation5] deals with the influence of the rail fastening components on the lateral deformation and load distribution behaviour of the rail. The track widening and narrowing of the leading and trailing wheelsets are investigated by measurement and simulation. It is recognised that the rail head movement not only depends on the current acting centrifugal force, as assumed, but can also depend on many other parameters such as the load application point.
The parameter studies carried out in this work using multibody simulations are based in part on the aforementioned previous research results. Herein, they are significantly supplemented by recent vehicle and track measurements. In particular, this paper scientifically contributes to the following topics:
| – | Influence of the selected nominal gauge, the current traction force and speed on gauge widening and lateral rail-wheel forces | ||||
| – | Influence of different stiffnesses of rail pads and worn profiles on gauge widening and lateral rail-wheel forces | ||||
| – | Better understanding of the lateral load distribution between leading and trailing wheelsets | ||||
| – | Working out the advantages and disadvantages of different measurement systems for describing the lateral dynamics of the track gauge | ||||
| – | Increasing the accuracy of simulation results, thus enabling better wear calculations and predictions | ||||
| – | Shows the necessity of assigned input parameters for the simulation, based on measured track data | ||||
2. Analysis of the dynamic gauge widening based on multibody simulation
2.1. Simulation method
To simulate the rail rotation, as mentioned earlier, a track model is built in the multibody simulation tool SIMPACK [Citation12]. Figure (a) depicts the schematic representation of the used model, which consists of the three rigid bodies: the inner rail, outer rail and sleeper. The rails are connected to the sleeper by a spring-damper system in vertical and lateral directions [Citation13]. In addition, a torsion spring system is implemented under the rails to allow the rail to tilt.
Figure 1. Schematic representation of the multibody track model (a) and the multibody model of the locomotive in SIMPACK (b).
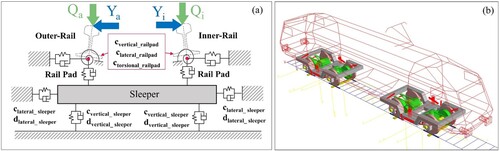
The multibody model of the locomotive used for the simulations is shown in Figure (b). The model structure and the vehicle’s parameters are not changed, as the focus is on the track.
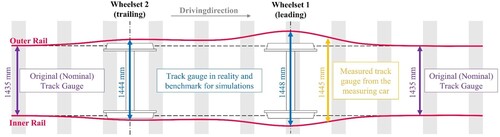
Figure demonstrates schematically how a dynamic gauge change can occur in a curve. The difference between the leading and trailing wheelsets can be seen. It also shows the influence of the positioning of the measuring equipment on the measuring carriage to determine the track gauge [Citation14]. The measuring carriage determines the track gauge under loaded condition, including its own weight, and thus outputs a higher value than the unloaded condition. However, it also does not provide for the dimensions of the track gauge occurring under the leading wheelset, since accessibility for measurement is not ensured there. These facts must be considered for validations based on the measured track gauge.
Figure 2. Schematic representation of the different dynamic track gauges of the leading and trailing wheelset.
2.2. Description of the simulated track section
The investigated section is one of the tightest curves in the Austrian rail network, i.e. a radius of 183 m. For the parameter studies, a section with a length of 600 m is modelled, which means that the straight lines before and after the curve can also be considered to understand the entry and exit conditions. For the later comparison of the measured gauge widening and the simulation, a detailed section of 300 m is used.
The existing track layout, characterised by radius, superelevation and vertical track position, is used for the parameter studies. Track irregularities are only considered for the later comparison between measurement and simulation. The same velocity profile is defined for all parameters in the study, i.e. a constant speed of 60 km/h.
2.3. Track data collection for simulation input
The virtual track is parameterised by several measurement data sets for the multibody simulation of a curved track. The track geometry, alignment and rail profiles are determined by the use of a measuring car [Citation15]. Figure illustrates all the rail profiles measured along the 600 m section and the cross section (which was measured every 10 m). The software SIMPACK uses Bézier curves to interpolate between the measured rail profiles in the longitudinal direction. This allows a smooth transition from one profile to the next [Citation12]. During the course of the measurement operation to determine the lateral rail head movement, the rail profiles were checked at three measurement positions using the MiniProf Rail manual measuring device [Citation16].
Figure 3. Measured rail profiles of inner rail (a) and outer rail (b) in a curve.
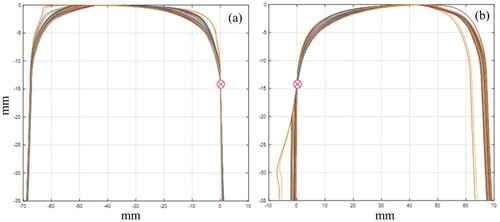
Two very heavily worn profiles stand out here. This severely worn section has a length of 20 m and can also be seen in the wheel-rail forces in Figure .
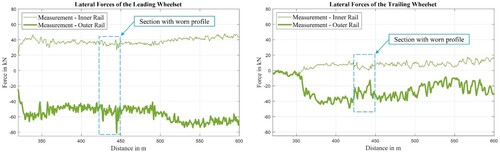
Figure 4. Measured lateral forces of the leading- and the trailing wheelset.
The stiffnesses of the superstructure are calculated by using measured deflection and measured Q-forces. The measurement of the deflection was carried out on the exact section of track under consideration using optical measuring techniques [Citation17].
2.4. Measurement of the rail-wheel forces
The vehicle measurement data used in the present study was obtained from the measurement study of a locomotive. Two measuring wheelsets are installed to the leading bogie, and the Y- and Q- forces in the wheel-rail contact are measured [Citation18]. Figure shows the wheel-rail forces of the leading and trailing wheelsets and illustrates the force progression over the curve. At the beginning, the vehicle enters the tight curve with a radius of 183 m. A section with a remarkable change in the wheel forces comes after the beginning of the curve. In this area, both rail profiles are heavily worn.
There are increased dynamic force peaks at the welding joints between the new and old profile, which are particularly visible on the leading wheelset. The trailing wheelset does not show these peaks, however, it does show a reduction in lateral forces due to the larger track gauge caused by wear.
From the measurements of vertical and lateral forces, the prevailing friction value taken on the day of measurement is estimated for the simulation. The coefficient of friction is determined on the inner rail as the straight cone part of the wheel is in contact with the rail [Citation11]. For 10 passages, this resulted in an average coefficient of friction of µ = 0.35 for the running surface. A reduced friction value of µ = 0.12 was specified for the wheel flange [Citation19]. Furthermore, the coefficient of friction for the outer rail was assumed to be the same [Citation20].
2.5. Simulative investigation of the dominant influencing parameters on the dynamic track gauge
The gauge is affected by several basic parameters that can change with time and distance. The main influences are stated and further investigated as follows:
| – | Nominal track gauge | ||||
| – | Traction force | ||||
| – | Vehicle speed | ||||
| – | Lateral stiffness of rail pads | ||||
| – | Rotational stiffness of the rail/railpads | ||||
| – | New or worn rail profile | ||||
Figure (a and b) show the coordinate systems used for the wheelset, inner rail and outer rail. To depict the different effects for the leading and trailing wheelset in detail, the lateral displacement and the angle of attack of the wheelsets are also plotted in Figure (a).
Figure 5. (a) Definition of the coordinate systems for the wheelset, the lateral wheelset displacement and the angle of attack [Citation21]. (b) Coordinate system for the two rails with positively defined directions.
![Figure 5. (a) Definition of the coordinate systems for the wheelset, the lateral wheelset displacement and the angle of attack [Citation21]. (b) Coordinate system for the two rails with positively defined directions.](/cms/asset/85cff6ca-b6ff-4d5a-9055-eb4209d56b57/nvsd_a_2276762_f0005_oc.jpg)
2.5.1. Influence of the nominal track gauge
This parametric study demonstrates the influence of the nominal track gauge. In addition to the standard gauge in Austria of 1435 mm, gauge widening is also common, especially in tight curves [Citation3]. Due to wear and settlement, the track gauge can change over time, especially in curves with small radii. Table shows that the gauge is varied and that the other parameters remain the same.
Table 1. Parameter study: variation of the nominal track gauge.
This first parameter study will be used to describe the basic correlations of the most important characteristic parameters of vehicle dynamics in a curve. Figure shows the influence of the nominal track gauge on the lateral forces in the wheel-rail contact for the leading and trailing wheelset. In addition, it depicts the lateral wheelset movement and angle of attack calculated in the simulation. For a further detailed analysis, the simulation results of this respective parameter study are attached in the appendix.
Figure 6. Lateral wheel-rail forces, lateral wheelset displacement and angle of attack with variation of track gauge.
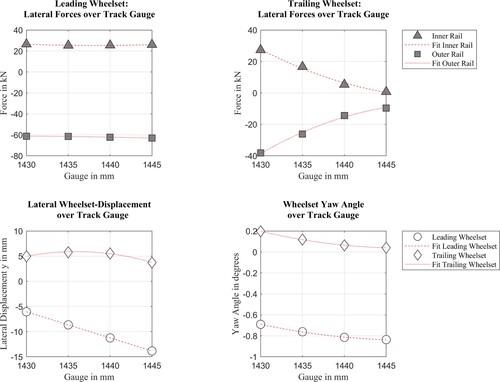
The nominal track gauge is assumed to be constant along the track. In Figure the influence on the lateral guiding forces of the leading wheelset can be seen to be rather small.
The forces on the trailing wheelset become smaller as the track gauge increases. However, the influence of the track gauge on the trailing wheelset is continuously more significant. With comparably large track gauges, the lateral force on the inner rail approaches zero, and the force on the outer rail is also only small. As a result, the track widening of the trailing wheelset is also minor.
The parametric study proves the suitability of the gauge widening, which is currently in use on the curve. Figure indicates an almost constant behaviour of the lateral forces over the track gauge in the case of the leading wheelset. Conversely, the trailing wheelset reveals that the absolute value of the lateral forces on the outer rail decreases from 40 kN to 10 kN and on the inner rail from 28 kN to 0 kN. This trend can be predicted by an almost linear relationship.
Detailed simulation results are attached in Appendix 1. The diagrams clearly show that constrained curving occurs at a gauge of 1430 mm. In this case, the flange of the inner wheel of the trailing wheelset is also in contact with the inner rail of the curve. This leads to a large angle of attack and, consequently, to high lateral creep forces. If the track gauge is increased, the angle of attack is also reduced, and the lateral creep forces decrease. The bogie reaches free curving.
2.5.2. Influence of the traction force
In the present work, the relationship between traction and the resulting forces between the rail and wheel in curves will be analysed. Reference [Citation22] investigates this relationship for a two-axle bogie in curves with a radius of 600–1800 m, both with and without traction.
Without traction forces, the wheelset tends to run radially to the curve. This tendency naturally worsens with smaller curve radii. With applied traction forces, on the other hand, the tendency of the wheelsets is to run parallel to each other and, accordingly, to resist radial running in a curve. So, in the case of a high tractive force, the bogie steers worse if the yaw stiffness is low.
During the parameter studies carried out here, the applied tractive force of the locomotive is varied, and the effects on the lateral forces are presented. The traction force is specified in SIMPACK by defining a drive torque per wheelset using an input function. The speed is controlled by a pushed dummy body with a given speed profile. In the simulation, Kalker’s FASTSIM algorithm was used to model creep forces [Citation23]. Table shows that the traction force is varied, while the other parameters remain the same.
Table 2. Parameter study: variation of the traction force.
Figure indicates a slight influence on the forces and gauge widening of the leading wheelset. Herein, increasing the traction force leads primarily to a reduction in the lateral forces on the inner rail. A more significant influence is seen on the trailing wheelset. Here, the lateral force on the outer rail of the trailing wheelset particularly increases. The force on the outer rail increases from 4 kN to 32 kN, compared a powerless run with a traction of 150 kN. This observable tendency can be effectively approximated by a predominantly linear correlation. Detailed simulation results are attached in Appendix 2. The figure depicts a small gauge widening on the trailing wheelset as the traction force increases. It is noticeable here that the tilting of the inner rail hardly changes. The outer rail tilts slightly outwards when the traction force rises.
Figure 7. Lateral wheel-rail forces, lateral wheelset displacement and angle of attack with variation of the traction force.
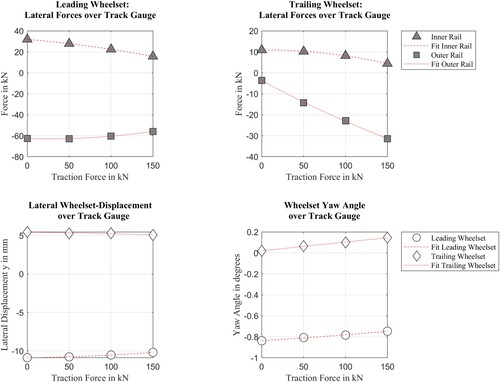
As already discussed in [Citation22], the angle of attack of the trailing wheelset increases with tractive force. This means that it tends to become more parallel rather than radial. The leading wheelset behaves the other way around and shows a reduction of the angle of attack.
2.5.3. Influence of the vehicle velocity
In general, the vehicle’s velocity significantly influences the leading wheelset’s guiding forces. The investigated curvature exhibits a standard speed of 60 km/h. In this study, the velocity is varied, as shown in Table , whereas the other parameters remain constant.
Table 3. Parameter study: variation of the vehicle velocity.
As can be seen in Figure , the change in speed greatly affects the guiding forces of the leading wheelset, which mainly affects the outer rail. Furthermore, at higher speeds, an increased force on the trailing wheelset at the outer rail occurs.
Figure 8. Lateral wheel-rail forces, lateral wheelset displacement and angle of attack with variation of the vehicle velocity.
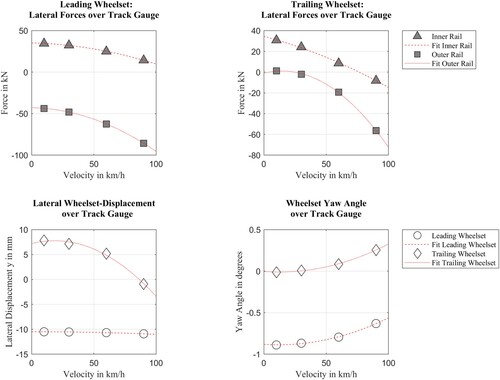
The contact point on the outer wheel of the leading wheelset is located in the flange root. If the speed gets higher, the contact point on the outer wheel of the trailing wheelset will also move to the flange root in order to balance the centrifugal force.
When this happens, the load increases sharply when the permitted vehicle speed is exceeded. Both for the trailing and the leading wheelset. When the speed increases from 60 km/h to 90 km/h, the load on the trailing wheelset increases from 20 kN to 58 kN. This trend can be estimated by a quadratic relationship. Therefore, this leads to increased wear on the outer rail.
Despite the increase in speed, the leading wheelset can no longer move laterally because the wheel flange is already in contact. The trailing wheelset behaves differently here. With increasing speed, it experiences movement toward the outside of the curve. The angle of attack of the leading wheelset decreases with increasing speed, while it increases for the trailing wheelset.
Detailed simulation results are attached in Appendix 3 and show a slight gauge widening on the trailing wheelset as the speed increases. It is noticeable here that the tilting of the inner rail hardly changes. The outer rail tilts more outward with an increase in speed, which leads to a greater increase in the track gauge.
2.5.4. Influence of the lateral stiffnesses of the rail pads
The rail pads are positioned directly under the rail foot. This reduces vibrations and structure-borne noise, which is particularly noticeable when it comes to an increase in ride comfort. Due to their stiffness, the pads between the rail and the sleeper have a major influence on the vertical movement of the rail [Citation24]. Table shows that the lateral stiffness is varied, while the other parameters remain the same.
Table 4. Parameter study: variation of the lateral stiffness of the railpads.
Despite a relatively large lateral displacement of the rail foot for soft pads, especially when considering the leading wheelset, the effect on the lateral forces is quite small. Figure indicates an almost constant behaviour of the lateral forces over the lateral stiffness in this case. On the trailing wheelset, there is only an increase of 3 kN for the inner and the outer rail and the trend can be estimated by an almost linear relationship.
Figure 9. Effect of a reduced lateral stiffness of the rail pad on the lateral wheel-rail forces, lateral wheelset displacement and angle of attack.
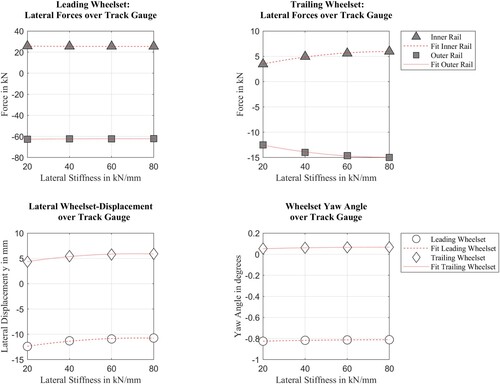
In reality, such lateral foot displacement occurs even more rarely because the mounting plate represents a mechanical stop. This further prevents lateral movement of the rail even after a long lifetime and rather serves as a centre of rotation for tilting the rail.
Detailed simulation results are attached in Appendix 4.
2.5.5. Influence of the torsional stiffness of rail pads
The influence of rail pads on lateral displacement has already been discussed. Now the effect due to the tilting of the rail is to be investigated. Figure shows the lateral wheel-rail forces at different rotational stiffnesses of the rail. There is an increase in the lateral forces on the trailing wheelset with an increase of the torsional stiffness.
Figure 10. Lateral wheel-rail forces, lateral wheelset displacement and angle of attack with different stiffnesses of the rail pads.
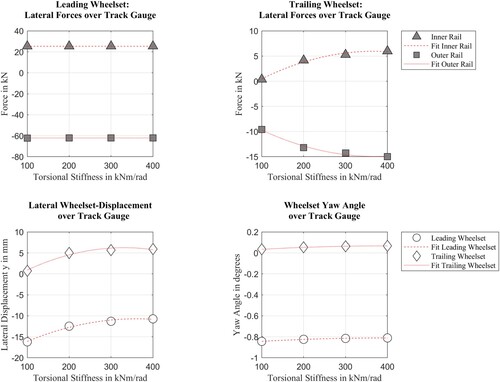
When looking at lateral wheelset displacement, as the stiffness increases, the leading wheelset moves less as far to the outside of the curve. The trailing wheelset is in the middle position with a soft rail pad and shifts to the inside of the curve with increasing stiffness.
Detailed simulation results are attached in Appendix 5. It shows the resulting gauge widening and the torsion angle of the inner and outer rail. In the case of the leading wheelset, it is noticeable that the guiding forces do not change, but the track gauge and the tilting of the outer and inner rail vary. A reduction in the torsional stiffness thus leads to a large increase from 1439 mm to 1455 mm.
The torsional stiffness variation shows that there is no change in the forces of the leading wheelset, even when accounting for a larger tilt of 4°. The trailing wheelset sees less tilting (about 0.5°), but the forces increase by about 6 kN with stiffer rail pads.
Focusing on the trailing wheelset, less tilting of the rails and thus less gauge widening is observable. A conspicuous effect of track narrowing in the run-out area of the curve is noticeable with a comparably soft rail pad, where there is also an increase in the guiding forces on the inner and outer rails (Table ).
Table 5. Parameter study: variation of the torsional stiffness of the railpads.
2.5.6. Influence of worn rail profiles
As far as the profiles of the locomotive’s wheels are concerned, new wheel profiles are always used in the simulation for the present investigations. This is done to exclude these influences on the rail-wheel forces. A new wheel profile is also used for the measurement runs. Now measured rail profiles are used for the following parameter variation. This is to show the influence of the torsional rail pad stiffness when considerable wear has already occurred on the curve. In curves with small radii, wear occurs at the rail head, especially on the outer rail, which increases the track gauge.
Figure depicts the profiles measured by the measuring car in the curved section. The figure already illustrates the profile data post-processed for the simulation software. This process must involve removing the measurement errors and moving the rail profiles to the definition point of the track gauge 14 mm below the top of the rail head [Citation1].
Table presents the exemplary variation of the torsional stiffness considering a measured and worn profile. All other parameters remain constant.
Table 6. Parameter study: variation of the torsional stiffness of the railpads with new and worn rail profiles.
Figure shows the influence of different rail pad stiffnesses on lateral guiding forces. In addition, the difference between a new profile in the curve and a heavily worn one can also be seen here. The gauge widening, which occurs due to rail wear alone, is visible. In the wider gauge’s area, it can be seen that the lateral forces are reduced on the trailing wheelset.
Figure 11. Influence of different rail pad stiffnesses on the lateral wheel forces, track gauge and tilting of the rail in case of new and worn profiles.
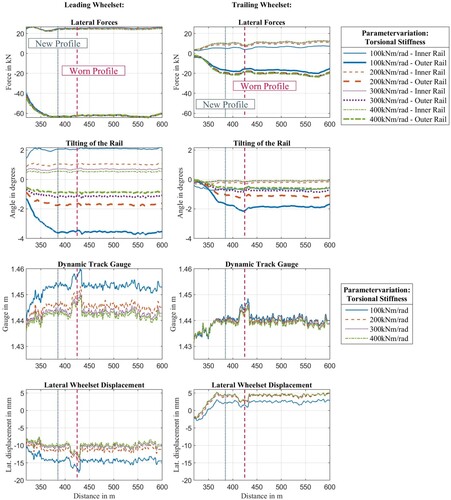
Figure shows that the effect on the forces, when the lateral stiffnesses are varied, ranges around 4 kN and is therefore small. However, the effect on the tilting of the rail is striking. Detailed simulation results are attached in Appendix 6.
Figure 12. Lateral wheel-rail forces, lateral wheelset displacement and angle of attack over torsional stiffness considering a worn rail profile.
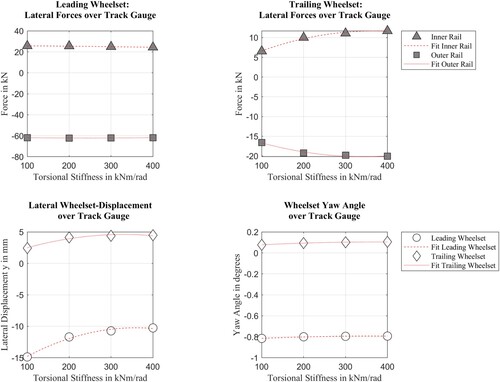
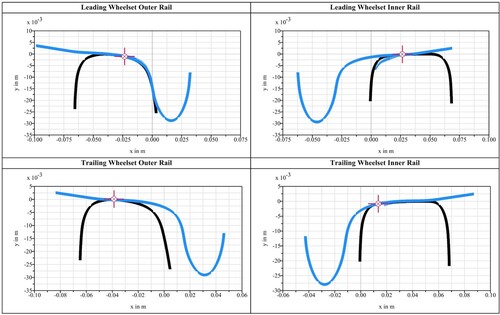
The inner rail tilts more inward because the contact point also shifts inward, and a higher tilting moment occurs. Due to wear, the contact point of the outer wheel moves outward and thus also forms a greater tilting moment, in this case to the outside of the curve. This means that with worn rail profiles, in combination with soft rail pads, there is greater tilting than with new profiles. The position of the rail-wheel contact points can be seen in Figure .
Figure 13. Representation of the wheel-rail contact with worn rail profiles during a simulated curved run.
3. Analysis of the dynamic gauge widening based on measurement data
Figure shows the measurement setup for determining lateral rail head movement using linear displacement sensors. Sensors are applied to the inner and outer rails. The measurement campaign is carried out by the Institute of Rail Infrastructure Design at Graz University of Technology [Citation25].
Figure 14. (a) Overview of the entire measuring set-up with several measuring positions on the inner and outer rail, (b) Linear displacement sensors for determining the lateral rail head movement.
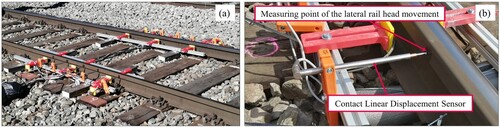
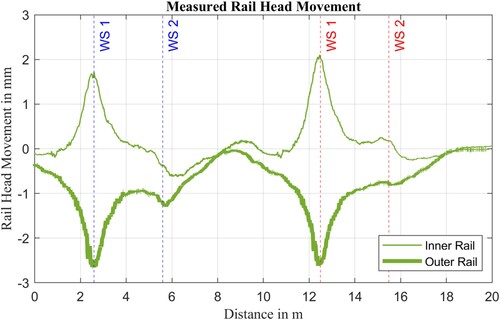
Figure shows the measured rail head movement when a locomotive pass over. As the simulations demonstrate, the outer rail of the leading wheelset WS1 tilts to the outside of the curve, while the inner rail tilts to the inside of the curve. With the trailing wheelset, the outer rail also tilts to the outside. The trailing wheelset WS2 exhibits the effect already shown in the parameter studies, namely that the inner rail tilts slightly inward due to the point of contact’s displacement. With the second bogie, due to the different position of the bogie in the track, this effect is less strong. However, the tilting of the inner rail is only minor.
Figure 15. Measurement of the rail head movement of the leading wheelset (WS1) and the trailing wheelset (WS2).
4. Comparison of measurement and simulation results
The described multibody model is parameterised and compared with the measurement data of this section. The moving mass-spring-damper track model has been calibrated against the conditions at the field measurement site with the parameters listed in Table . The values for the stiffnesses in the lateral, vertical and torsional directions were determined in a short section of track on the basis of measured wheel-rail forces and the occurring deflection, lateral displacement and tilting of the rail.
Table 7. Track parameters for the comparative simulation.
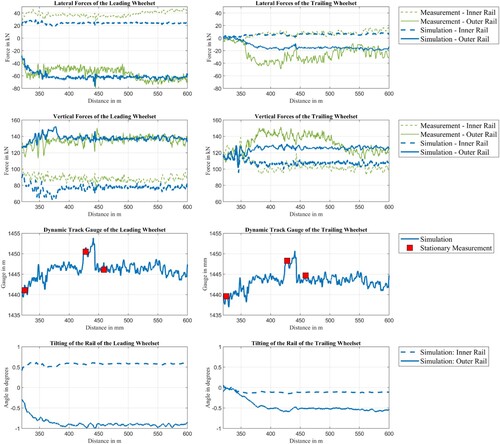
Figure illustrates the comparison between the measured and simulated lateral and vertical forces.
Figure 16. Comparison of the simulated and measured wheel-rail forces, dynamic track gauge widening and titling of the rails.
The influence of gauge widening due to wear is evident, both in the simulation and in the measurement data. Deviations of the forces may result from the following reasons:
| – | No current weighting record of the locomotive is available. For this reason, the centre of gravity position was assumed to be ideally located in the symmetric centre for the simulation. Investigations have shown that a slight shift in the centre of gravity can cause a shift of the vertical forces. | ||||
| – | There is no measurement of the vehicle’s drive torque. Based on the course of the Y-forces of the trailing wheelset and the knowledge gained from the parameter study in section 2.5.2, it can be assumed that traction was increased during the curve entry, thus increasing the lateral force on the outer rail. In the simulation, a constant traction torque was used. | ||||
| – | This is also related to the uncertainty regarding traction creepage. The locomotive might have accelerated at the entry of the curve, which may have led to large traction creepages. For this case the FASTSIM creep force model may not be suitable [Citation23] and could be one of the reasons for the discrepancy between measurement and simulation. | ||||
Figure also presents the simulated gauge widening for each wheelset. This shows good agreement with the track widening determined at three measurement positions on the track. Due to the higher forces, the leading wheelset reveals a more significant track widening than the trailing wheelset. The figure also shows the tilting movement of the individual rails. In the case of the leading wheelset, the inner rail tilts toward the inside of the curve, while the outer rail tilts toward the outside.
The trailing wheelset behaves differently here. Both the inner and the outer rail tilt toward the outside. This causes only a slight widening of the track for the trailing wheelset. The lateral displacement of the foot of the rail is very small, as can be seen in the parameter study in section 2.5.6. The lateral displacement of the head results mostly from the tilting of the rail.
5. Conclusions
This paper investigates the lateral interaction between a rail vehicle and the track when a dynamic gauge widening occurs in a tight curve. For this purpose, a detailed multibody model is built. In a parametric study, fundamental parameters are varied, and the effects on the lateral guiding forces and the translational and rotational motions of the rail are investigated. Special attention is paid to track stiffnesses, worn rail profiles, runs with traction and different vehicle speeds.
The parameter study proves the usefulness of the still exercised practice of gauge widening in tight curves. The lateral forces on the outer rail can be reduced on the trailing wheelset from 40 kN to 10 kN and on the inner rail from 28 kN to nearly 0 kN. The results of the parameter studies indicate a moderate possibility by gauge widening to reduce lateral forces at the leading wheelset.
The variation of the traction force shows the direct influence on the lateral contact forces. If the traction is increased from powerless up to 150 kN, the lateral force on the outer rail of the trailing wheelset increases from 4 kN to 32 kN. The correlations between the traction force and the lateral forces are almost linear.
The parameter variation of the lateral stiffness of the rail pads shows only a minor effect on the wheel-rail forces. Despite a rather large lateral displacement of the rail base for soft pads, especially for the leading wheelset, the effect on the lateral forces is quite small. For the trailing wheelset, there is only an increase of 3 kN for the inner and outer rail. The torsional stiffness variation shows no change in the forces of the leading wheelset, even with a larger tilt of 4°. The trailing wheelset sees less tilting (about 0.5°), but the forces increase by about 5 kN with stiffer rail pads.
The same variation of torsional stiffness is performed with worn profiles and shows more significant tilting movements on the trailing wheelset. Up to 2° tilting angles are observed here, resulting from a shift of the contact point and thus a larger tilting moment.
During the evaluations, special attention is paid to the difference between the leading and trailing wheelsets. They can be subjected to very different track conditions depending on speed, wear and gauge. To obtain reliable simulation results, this fact must be considered in the future when gauge measurement data is used for the parameterisation of multibody simulation models.
Finally, the model is validated using measured wheel-rail forces and railhead movement, as measured on the track.
A better understanding of dynamic track widening can improve the running behaviour of the wheelset on small radius curves, decrease the probability of derailment and reduce the local stresses and wear on the wheel and rail.
Acknowledgement
The publication was written at the Institute of Structural Durability and Railway Technology at Graz University of Technology, Austria. The authors would like to acknowledge the financial support from the COMET K-project Rail4Future from the Austrian Federal Ministry for Climate Action (BMK), the Austrian Federal Ministry for Digital and Economic Affairs (BMDW), the Province of Styria (Dept. 12) and the Styrian Business Promotion Agency (SFG). The Austrian Research Promotion Agency (FFG) has been authorised for the programme management.
Open access funding provided by Graz University of Technology.
Disclosure statement
No potential conflict of interest was reported by the author(s).
Additional information
Funding
References
- Fendrich L, Fengler W, editors. Handbuch Eisenbahninfrastruktur. 3rd ed. Berlin, Heidelberg: Springer Vieweg; 2019.
- Pittner C. Auswertung von Radkraft-Messdaten zur Ermittlung eines Lastkollektives für die Lebensdauerabschätzung von Schienen [Diplomarbeit]. Wien: Technische Universität Wien; 2017.
- Lichtberger B. Handbuch Gleis: Unterbau – Oberbau – Instandhaltung – Wirtschaftlichkeit. 3rd ed. Hamburg: Eurailpress; 2010.
- Wang P, Si D, Wang S, et al. Study on gage widening methods for small-radius curves. Appl Sci. 2021;11:5334. doi:10.3390/app11125334
- Liu J. Einfluss der Schienenbefestigungskomponenten auf das laterale Verformungs- und Lastverteilungsverhalten der Schiene [Dissertation]. München: Technischen Universität München; 2013.
- Liu X, Zhai W. Analysis of vertical dynamic wheel/rail interaction caused by polygonal wheels on high-speed trains. Wear. 2014;314:282–290. doi:10.1016/j.wear.2013.11.048
- Popp K, Kaiser I, Kruse H. System dynamics of railway vehicles and track. Arch Appl Mech. 2003;72:949–961. doi:10.1007/s00419-002-0261-6
- Sun YQ, Dhanasekar M. A dynamic model for the vertical interaction of the rail track and wagon system. Int J Solids Struct. 2002;39:1337–1359. doi:10.1016/S0020-7683(01)00224-4
- Shu X, Wilson N. Simulation of dynamic gauge widening and rail roll: effects on derailment and rolling contact fatigue. Veh Syst Dyn. 2008;46:981–994. doi:10.1080/00423110802037214
- DIN EN 14363:2019-11. Bahnanwendungen_- Versuche und Simulationen für die Zulassung der fahrtechnischen Eigenschaften von Eisenbahnfahrzeugen_- Fahrverhalten und stationäre Versuche; Deutsche Fassung EN_14363:2016 + A1. Berlin: Beuth Verlag GmbH; 2018.
- Elkins JA, Eickhoff BM. Advances in nonlinear wheel/rail force prediction methods and their validation. J Dyn Sys, Meas, Control. 1982;104:133–142. doi:10.1115/1.3139688
- Simulia. Simpack: Simulationssoftware für Mehrkörpersysteme. Version 2023x.2. Vélizy-Villacoublay: Dassault Systemes; 2023.
- Chaar N. Wheelset structural flexibility and track flexibility in vehicle track dynamic interaction. Stockholm: Rail Vehicles, Aeronautical and Vehicle Engineering, Royal Inst. of Techn. (KTH); 2007.
- Landgraf M. Zustandsbeschreibung des Fahrwegs der Eisenbahn - Von der Messdatenanalyse zum Anlagenmanagement [Dissertation]. Graz: Graz University of Technology; 2016.
- Hansmann F, Nemetz W. Der Gleislage auf der Spur: Grundlagen - Fehlerermittlung – Korrektur – Qualität: ein vergleichender Überblick über die DACH-Staaten. Leverkusen: PMC; 2019.
- MBM Industry & Rail Tech GmbH. MiniProf Rail – Profilmessgerät [Internet] [cited 2023 Jun 28]. Available from: https://www.mbm-tech.at/Produkt%C3%BCbersicht/miniprof-rail/.
- Lienhart W, Schönberger C. Technischer Bericht: Kamerabasiertes Schienenmonitoring [IGMS_2020_32]. Graz: Graz University of Technology; 2020.
- DB Systemtechnik GmbH. Provision of instrumented wheelsets [Internet] [cited 2023 Jun 28]. Available from: https://www.db-systemtechnik.de/dbst-en/Product-Groups-/Provision-of-instrumented-wheelsets-7302854.
- Müller R. Reibwertmanagement Rad-Schiene: Gleislauftechnik Müller [Internet] [cited 2023 Jul 26]. Available from: http://www.ihrus.ch/index_htm_files/2018_Schnittstelle%20Rad%20Schiene.pdf.
- Petrov V, Berg M, Persson I. Estimation of wheel–rail friction for vehicle certification. Veh Syst Dyn. 2014;52:1099–1114. doi:10.1080/00423114.2014.922197
- Wu Q, Wang B, Spiryagin M, et al. Curving resistance from wheel-rail interface. Veh Syst Dyn. 2022;60:1018–1036. doi:10.1080/00423114.2020.1843689
- Grassie SL, Elkins JA. Tractive effort, curving and surface damage of rails. Wear. 2005;258:1235–1244. doi:10.1016/j.wear.2004.03.064
- Spiryagin M, Polach O, Cole C. Creep force modelling for rail traction vehicles based on the Fastsim algorithm. Veh Syst Dyn. 2013;51:1765–1783. doi:10.1080/00423114.2013.826370
- Czolbe C. Schlussbericht: Akustisch optimierte Schienenzwischenlage [Internet]. Available from: https://laermforschung-eisenbahn.ch/site/wp-content/uploads/2022/02/2020_Bericht-Entwicklung-Zwischenlage_Prose-AG.pdf.
- Pospischil F, Lehmann M. Technischer Bericht: Messung der lateralen Schienenkopfbewegung. Graz: Graz University of Technology; 2022.
- FFG-COMET project Rail4Future. Railways for Future: Resilient Digital Railway Systems to enhance performance [Internet] [cited 2023 Apr 14]. Available from: https://projekte.ffg.at/projekt/3915326.
Appendix
Appendix 1. Simulation results with variation of the nominal track gauge
Appendix 2. Simulation results with variation of the traction force
Appendix 3. Simulation results with variation of the vehicle velocity
Appendix 4. Simulation results with variation of the lateral stiffness of the railpads
Appendix 5. Simulation results with variation of the torsional stiffness of the railpads
Appendix 6. Simulation results with variation of the torsional stiffness of the railpads and worn rail profiles