
 ?Mathematical formulae have been encoded as MathML and are displayed in this HTML version using MathJax in order to improve their display. Uncheck the box to turn MathJax off. This feature requires Javascript. Click on a formula to zoom.
Abstract
The paper presents measurements of the lateral force and self-aligning torque from cargo and city bicycle tyres. Based on the experimental data, we have determined the parameters for the Magic Formula model, for lateral force and self-aligning torque. We performed tests with VeTyT, an indoor test rig specific for bicycle tyres, under different vertical loads (ranging from 343 N to 526 N), camber angles (−5, 0, 5) deg and inflation pressure (from 300 kPa to 500 kPa). For each condition, we evaluated the cornering stiffness and found that it generally decreases with the increase in inflation pressure for the tour/city bicycle tyres. However, the cargo tyre tested showed an opposite trend, with an increase in the cornering stiffness as the inflation pressure increased from 300 kPa to 400 kPa.
1. Introduction
Tyres play a large role in vehicle dynamics [Citation1,Citation2]. Therefore, a lot of effort is devoted to tyre development and modelling for cars [Citation3,Citation4] and motorcycles [Citation5,Citation6]. By way of analogy, we expect that the tyres are also relevant in bicycle dynamics. As indicated in refs [Citation7–9], understanding the tyre characteristics may be essential for investigating the wobble (or shimmy) phenomenon [Citation10,Citation11]. However, tyres’ contribution has often been neglected in bicycle models due to implementation complexities and lack of data on bicycle tyres [Citation12]. The measurements are usually challenging and feature a low signal-to-noise ratio. In the last decade, proper methods and testing machines have been developed to characterise bicycle tyres with reasonable accuracy [Citation13,Citation14]. Even if outdoor tests can be performed in a real environment, test rigs for indoor testing seem to provide repeatable and accurate tests [Citation15].
There is an increase in the use of bicycles, particularly after the Covid-19 pandemic [Citation16]. Also, cargo bikes are growing in use. Leading delivery companies are updating their fleets with cargo bicycles for ‘last mile’ deliveries [Citation17,Citation18] as environment-friendly and efficient means of transportation in urban areas. The cargo bicycles are mostly two-wheeled vehicles with an extended wheelbase to carry loads in front of the rider (known as ‘front-loader’ bicycles), or behind the rider (models known as ‘longtail’) [Citation19]. There are also three-wheeled cargo bicycles, with a large basket for goods or children usually in front of the rider. These vehicles are usually designed so that they cannot tilt in a curve (with a few exceptions, as [Citation20]). These peculiarities require the development of specific tyres, capable of handling high vertical loads and high accelerations (usually conceived for pedal-assisted bicycles).
In this context, we tested both cargo and tour/city bicycle tyres. The data have been measured with the indoor test rig VeTyT (acronym of Velo Tyre Testing), located in the facilities of the Department of Mechanical Engineering of Politecnico di Milano [Citation15,Citation21]. To the best of the authors’ knowledge, the VeTyT is currently the only bicycle tyre test rig which has been certified ISO 9001-2015. The results have been then compared and discussed (Section 3). After that, we fitted our experimental data to the ‘Magic Tyre Formula’ (MF) [Citation22] for modelling the tyres (Section 4). Data, code and results are made publicly available [Citation23].
The paper tries to close a still-existing gap in the availability of bicycle tyre data. These results may be of great interest for enhancing the understanding of bicycle dynamics, updating existing models with tyre contributions or providing a dataset of measurements on bicycle tyres.
2. Methods
The experimental tests were performed with the VeTyT, a test rig specifically designed for bicycle tyres [Citation21] (Figure (A)). An aluminium frame carries the wheel on top of a flat track while measuring lateral force and self-aligning torque. The VeTyT is laterally constrained by a universal joint (acting as a hinge) and a Watt’s linkage (Figure (B)). This combination allows a pure vertical motion at the tyre/ground contact point. The vertical displacement occurs without any longitudinal component if the displacement is limited. The vertical displacement must be allowed to filter out the effect of possible wheel or flat track unevenness. Using two instrumented bars (two bars, one load cell per bar), we can measure the lateral force at the contact patch between the tyre and the ground. First, we need to calculate the force measured on the Watt’s linkage (Figure (B)), as follows (1).
(1)
(1) where
and
are the forces from the load cells (we define
and
to distinguish the load cells). The sign of the forces
and
will be always different. When the load cell
is under traction, the correspondent
is under compression. This is due to the kinematic properties of the system. The lateral force
can be evaluated as follows (2).
(2)
(2) The distances
and
are known (Figure (A)),
is the self-aligning torque (measured),
is the slip angle.
Figure 1. Test-rig VeTyT. In (A), you can see the main subsystems of the testing device. It carries a bicycle tyre running on a flat track. In this picture, the tyre is mounted on a high-stiffness laboratory rim (adapted from [Citation21,Citation43]). In (B), the Watt’s linkage. It constrains the lateral motion, while it allows a limited vertical motion.
![Figure 1. Test-rig VeTyT. In (A), you can see the main subsystems of the testing device. It carries a bicycle tyre running on a flat track. In this picture, the tyre is mounted on a high-stiffness laboratory rim (adapted from [Citation21,Citation43]). In (B), the Watt’s linkage. It constrains the lateral motion, while it allows a limited vertical motion.](/cms/asset/ee1311ac-3dc3-4b20-a0b5-5f757cb76f85/nvsd_a_2338143_f0001_oc.jpg)
Figure 2. Some VeTyT features: (A) is a top view of the VeTyT, with the indications of lateral force Fy, the force measured by the Watt’s linkage FW and the distances L1 and L2, useful for the evaluation of equilibrium of momentum for the centre of the universal joint. The latter can be assumed as the kinematic hinge. Picture adapted from [Citation44]. (B) VeTyT frame and construction axes. The vertical axis crosses the longitudinal one in the contact point tyre ground. Here you can see a schematic lateral view of VeTyT mounted on top of a drum. (C) Signals from VeTyT: raw data from load cells in Watt’s linkage as a function of acquisition time, before the filtering procedure (first plot). In the plot below, the non-filtered force for the evaluation of self-aligning torque is depicted as a function of acquisition time. (tyre CST Brooklyn (T02), camber 0°, vertical load 411 N, inflation pressure 300 kPa). (D) Data from three repeated tests (tyre CST Brooklyn, camber −5°, vertical load 449 N, inflation pressure 400 kPa). In the first plot, we can see the force measured by Watt’s linkage as a function of acquisition time. In the plot below, the slip angle α is depicted as a function of acquisition time, for three repeated tests.
![Figure 2. Some VeTyT features: (A) is a top view of the VeTyT, with the indications of lateral force Fy, the force measured by the Watt’s linkage FW and the distances L1 and L2, useful for the evaluation of equilibrium of momentum for the centre of the universal joint. The latter can be assumed as the kinematic hinge. Picture adapted from [Citation44]. (B) VeTyT frame and construction axes. The vertical axis crosses the longitudinal one in the contact point tyre ground. Here you can see a schematic lateral view of VeTyT mounted on top of a drum. (C) Signals from VeTyT: raw data from load cells in Watt’s linkage as a function of acquisition time, before the filtering procedure (first plot). In the plot below, the non-filtered force for the evaluation of self-aligning torque is depicted as a function of acquisition time. (tyre CST Brooklyn (T02), camber 0°, vertical load 411 N, inflation pressure 300 kPa). (D) Data from three repeated tests (tyre CST Brooklyn, camber −5°, vertical load 449 N, inflation pressure 400 kPa). In the first plot, we can see the force measured by Watt’s linkage as a function of acquisition time. In the plot below, the slip angle α is depicted as a function of acquisition time, for three repeated tests.](/cms/asset/adcb2db0-77f0-4ee5-80e2-1e618d065e58/nvsd_a_2338143_f0002_oc.jpg)
The vertical load acting on the tyre can be varied by simply adding masses to the frame. We measure the actual vertical force with a load cell on top of the steering shaft. The latter is mounted so that its axis corresponds to the vertical axis of the testing machine. Such an axis crosses the longitudinal axis of the VeTyT in the contact patch (Figure 2(B)).
The forces acting on the VeTyT were recorded at a 1612 Hz sample rate. Raw data were filtered using a 4th-order low-pass band Butterworth filter, implemented in the commercial software MATLAB® R2021a (MathWorks, Natick, USA) [Citation24]. To avoid detrimental high-frequency components, the cut-off frequency of the filter was set to 2 Hz. Signals with high-frequency components coming from Watt’s linkage load cells and from the load cell for the self-aligning torque are depicted in Figure 2(C). The results come from averaging multiple tests. However, before averaging, different test runs need to be realigned for time (the x-axis in Figure 2(D)) using an appropriately implemented algorithm.
Tests were performed on the flat track [Citation25]. The flat track consists of a poly-V belt supported by a specifically manufactured aluminium plate. To minimise friction and wear of the belt, an air system inflates a mixture of pressurised air and silicone oil between the belt and the aluminium plate.
During this experimental campaign, we tested bicycle tyres under different vertical loads, camber angles and inflation pressures. An overview of the tyres we tested is depicted in Table . In Section 3, we present all the tests performed, clarifying the test conditions. For better clarity, we assign three-digit codes to the tyres alongside the full name of the tyre model.
Table 1. Tyres tested with VeTyT. Tyre brand, commercial series label, dimensions and ETRTO standards (European Tyre and Rim Technical Organisation) are reported alongisde the rim used for each tyre we tested. In the last column, you can find the three-digit codes used to identify the tyres in the paper.
3. Tyre testing
In this section, we present the measurement results referring to the tyres listed in Table . Each tyre is discussed in a subsection, providing details on the configuration and the peculiarities of the test. To collect the test results, tables are largely used. The data linked to the results presented hereafter are publicly available [Citation23].
We limited the tested camber angle to ±5° to avoid detrimental resonance of the test rig, which may affect the measurements. In addition, it is worth noticing that this paper presents the results of a batch of bicycle tyres commonly used on tour/city bicycles, primarily conceived for work, commuting or leisure activities. Therefore, we do not expect significant variations in camber angle.
All the tests were performed at a rolling speed of 9.3 km/h, to ensure result repeatability while avoiding detrimental increase in the temperature of the rolling surface [Citation26]. The latter was constantly monitored with a thermal camera and/or pyrometer, to be in the admissible range for tests (22–30°C) [Citation27]. We measured both the lateral force and the self-aligning torque, varying working parameters (vertical force, inflation pressure and camber angle). The cornering stiffness can be evaluated from the lateral force as a function of the slip angle, according to (3)
(3)
(3) The cornering stiffness estimates have a 1.5% uncertainty and a self-aligning torque of 2.5% based on the procedure described in [Citation21].
3.1. Cargo bicycle tyres
We tested two cargo bicycle tyres, with the same overall dimensions but manufactured by different companies. Due to the smaller size of the tyres (20′′), it was necessary to design a special steel fork to carry the wheel on top of the flat track (Figure (A)). In addition, we manufactured steel plates to attach the wheel to the fork, with tight tolerances to ensure proper alignment of the tyre for the rolling surface (Figure (B)).
Figure 3. Test-rig VeTyT with the cargo bicycle tyre mounted. You can notice the long steel fork used to accommodate the cargo bicycle tyre. In (B), the steel plates are used to mount the wheel on the steel fork. Pictures adapted from [Citation19].
![Figure 3. Test-rig VeTyT with the cargo bicycle tyre mounted. You can notice the long steel fork used to accommodate the cargo bicycle tyre. In (B), the steel plates are used to mount the wheel on the steel fork. Pictures adapted from [Citation19].](/cms/asset/f31e097b-8a6f-438e-95cf-a8e5a54677d0/nvsd_a_2338143_f0003_oc.jpg)
3.1.1. Schwalbe Balloon (Big Ben Plus) – T01
The Schwalbe Balloon tyre (labelled as T01), series ‘Big Ben Plus’, has been specifically designed for e-bikes and cargo bikes. It features by 3 mm puncture protection layer and reinforced sidewalls, enabling it to carry heavy loads (according to the Schwalbe website [Citation28]). We tested the 20′′ × 2,15 tyre, applying vertical loads of 411 and 526 N, inflation pressure of 400 kPa, camber angle (−5, 0, 5) deg. With this load configuration, we simulated the scenarios of a cargo bicycle without any additional load and a medium load case with a package in the front basket. Testing at higher vertical loads is still not possible due to the technical limitations of the test rig and the existing set-up [Citation19].
The results for the vertical load of 411 N, varying the camber angle, are shown in Figure (A,B), for lateral force and self-aligning torque, respectively. As for the camber angle equal to 0°, with variations in vertical load, the results are depicted in Figure (C,D). Given the large number of figures, we decided to provide an overview of the most significant plots and collect all the relevant findings into tables.
Figure 4. Lateral force [N] and self-aligning torque
[Nm] (B) as a function of slip angle
[deg], tyre Schwalbe Balloon (T01). In (A) and (B), results for inflation pressure of 400 kPa, vertical load of 411 N, camber angle equal (−5, 0, 5) deg. In (C) and (D), results for inflation pressure of 400 kPa and camber angle equal to 0° (pictures adapted from [Citation19]).
![Figure 4. Lateral force Fy [N] and self-aligning torque Mz [Nm] (B) as a function of slip angle α [deg], tyre Schwalbe Balloon (T01). In (A) and (B), results for inflation pressure of 400 kPa, vertical load of 411 N, camber angle equal (−5, 0, 5) deg. In (C) and (D), results for inflation pressure of 400 kPa and camber angle equal to 0° (pictures adapted from [Citation19]).](/cms/asset/bf73d381-972a-4b42-ae62-67db63924196/nvsd_a_2338143_f0004_oc.jpg)
As the vertical load increases, both the lateral force and the self-aligning torque increase in magnitude (Figure (C,D)). The tyre can generate higher forces with a higher vertical load. The peak value of the lateral force will be reached for very large slip angles (> |6| degrees, the maximum value tested in this study), as shown in Figure (A,C). Tyres for cargo bicycles are designed to carry large loads; therefore, we expect to reach saturation conditions for higher vertical forces. Cornering stiffness values evaluated according to (3) are collected in Table , for different vertical loads and camber angles. Then, the variation of cornering stiffness due to vertical load is expressed in % in the last column, for the same camber angle. Cornering stiffness values
for the same vertical load but different camber angles are expected to be similar [Citation29], as shown in Table . Conversely, remarkable variations in
are reported due to vertical load increase. With an additional vertical load of 115 N or so, we found a variation of 24% in cornering stiffness for a camber angle equal to 0°, which could result in different bicycle handling.
Table 2. Cornering stiffness under different vertical loads (third and fourth columns), for the same inflation pressure (400 kPa), tyre Schwalbe Balloon (T01). In the last column, the variation (in percentage) of cornering stiffness due to increasing vertical load, referring to the lowest vertical load tested (here 411 N).
3.1.2. CST Brooklyn – T02
Similar to what is described for the Schwalbe Balloon, the CST Brooklyn (T02) features a carcass designed to handle heavy loads, stiff sidewalls and an anti-puncture layer [Citation30].
The results of lateral force and self-aligning torque for different working conditions are depicted in Figure (inflation pressure 400 kPa, = 411 N, camber angle (−5, 0, 5) deg in (A) and (B); inflation pressure 300 kPa,
(411, 449, 526) N, camber angle 0° in (C) and (D)).
Figure 5. Lateral force [N] and self-aligning torque
[Nm] as a function of slip angle
[deg], tyre CST Brooklyn (T02). In (A) and (B), results for inflation pressure of 400 kPa, vertical load 411 N, camber angle equal to (−5, 0, 5) deg. In © and (D), results for inflation pressure of 300 kPa, camber angle 0°, a vertical load of (411, 449, 526) N.
![Figure 5. Lateral force Fy [N] and self-aligning torque Mz [Nm] as a function of slip angle α [deg], tyre CST Brooklyn (T02). In (A) and (B), results for inflation pressure of 400 kPa, vertical load 411 N, camber angle equal to (−5, 0, 5) deg. In © and (D), results for inflation pressure of 300 kPa, camber angle 0°, a vertical load of (411, 449, 526) N.](/cms/asset/1c792281-7fab-4741-9575-db75bc4c2581/nvsd_a_2338143_f0005_oc.jpg)
The cornering stiffness increases with the vertical load while keeping the pressure constant (Table ). Similar observations may be drawn for inflation pressure. has a limited increase as the inflation pressure increases from 300 to 400 kPa. However, we cannot clearly define a trend as we only have data for two different pressures.
Table 3. Cornering stiffness [N/deg] under different vertical loads, inflation pressures (300 and 400 kPa), tyre CST Brooklyn (T02). In the last column, the variation (in percentage) of cornering stiffness due to increasing vertical load, referring to the lowest vertical load tested (here 411 N).
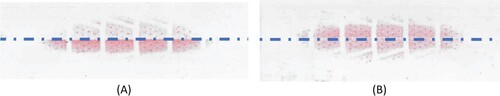
The self-aligning torque as a function of the slip angle (Figure (B,D)) is asymmetrical for the origin of the axis, leading to unexpected results. To ensure the accuracy of the data acquisition process, we repeated multiple tests on different days, coming to similar outputs. We analysed the contact patches using a pressure-sensitive film and we found a remarkable asymmetry in the contact pressure distribution (Figure . Blue dash-dot line represents the median plane line). The varying intensity of the colour in the film corresponds to a different pressure level, where a more intense colour means higher pressure. A visual inspection of the tyre’s external surface also revealed a ‘step’ between the left and right side of the tyre, for the median plane line. This may account for some unexpected results. The misalignment left-right sides is not constant over the entire tyre (Figure (B)). Furthermore, this feature only affects self-aligning torque as we do not find any specific peculiarities in lateral force measurement (Figure (A,C)).
Figure 6. Contact patch on pressure-sensitive film for inflation pressure 400 kPa, vertical load 449 N (contrast set to −40% to increase readability), tyre CST Brooklyn (T02). Dash-dot lines represent the median plane lines. In (A) and (B) we can see the results from the same tyre, but different locations on the tyre itself.
In Figure , the cornering stiffness values are depicted as a function of the vertical force . The values of
are higher for the highest tested inflation pressure (in this case 400 kPa). This peculiar trend was not found for the other tyres we tested. This behaviour may be due to the specific properties of the carcass of cargo bicycle tyres, which may account for these unexpected results. Also, consider that cargo tyres are conceived to carry high vertical loads. Therefore, an increase in inflation pressure may lead to a further increase in the tyre’s lateral characteristics as we are still far from the saturation limit. Unfortunately, we could not test under higher vertical loads, due to the technical limitations of the test rig.
Figure 7. Cornering stiffness [N/deg] as a function of vertical force
[N], tyre CST Brooklyn (T02). Results for inflation pressure of 300 and 400 kPa, camber angle equal to 0°.
![Figure 7. Cornering stiffness CFy [N/deg] as a function of vertical force Fz [N], tyre CST Brooklyn (T02). Results for inflation pressure of 300 and 400 kPa, camber angle equal to 0°.](/cms/asset/68945472-5ef9-42d3-ab43-3725f54d185e/nvsd_a_2338143_f0007_oc.jpg)
3.2. Tour/city bicycle tyres
We tested four tyres commonly used on bicycles for commuting and/or leisure. Cornering stiffness values are collected in tables. We set the inflation pressure to (300, 400 and 500) kPa, camber angle (−5, 0 and 5) deg, vertical load (343, 404 and 488) N. The Scalato Mondano tyre was tested only for inflation pressures (300, 400) kPa.
3.2.1. Schwalbe 50 km Energizer (Plus G-Guard 5/Addix-E) – T03
According to the manufacturer’s specs, this tyre was specifically designed for e-bikes. It is certified ECE-R75, making it suitable for fast e-bikes (over 25 km/h motor assist bicycles) (information available on Schwalbe website [Citation28]).
Lateral force and self-aligning torque are presented for different working conditions (Figure ).
Figure 8. Lateral force [N] and self-aligning torque
[Nm] as a function of slip angle
[deg], tyre Schwalbe Plus (T03). In (A) and (B), results for inflation pressure of 300 kPa, vertical load 488 N, camber angle equal to(−5, 0, 5) deg. In (C) and (D), results for inflation pressure of 300 kPa, camber angle 0°, a vertical load of (343, 404, 488) N.
![Figure 8. Lateral force Fy [N] and self-aligning torque Mz [Nm] as a function of slip angle α [deg], tyre Schwalbe Plus (T03). In (A) and (B), results for inflation pressure of 300 kPa, vertical load 488 N, camber angle equal to(−5, 0, 5) deg. In (C) and (D), results for inflation pressure of 300 kPa, camber angle 0°, a vertical load of (343, 404, 488) N.](/cms/asset/e694ef04-63cd-4b62-9174-0f3ad2ac002c/nvsd_a_2338143_f0008_oc.jpg)
The variation of camber angle for constant inflation pressure and vertical load causes a shift in the curve of lateral force relative to the reference camber angle of 0°. The shift is downward for negative camber angles and upward for positive camber angles (according to standard ISO 8855 [Citation31]).
As for the self-aligning torque, a non-linear behaviour is observed for slip angles >|1,5| deg. Furthermore, an increase in the vertical load results in an increase in the self-aligning torque as the lateral force also increases. The influence of camber angle on the self-aligning torque is similar to its effect on the lateral force, however, with a reduced impact at lower slip angles. It is difficult to notice a clear trend for twisting torque, which is defined as the self-aligning torque for slip angles equal to 0° at different camber angles [Citation13,Citation32]. The cornering stiffness values are collected in Table .
Table 4. Cornering stiffness for different vertical loads and inflation pressures (300, 400 and 500 kPa). In the last column, the variation (in percentage) of cornering stiffness due to increasing vertical load, referring to the lowest vertical load tested (here 343 N).
Figure presents a comparison of for different inflation pressures. The lowest inflation pressure tested (300 kPa) provided the largest cornering stiffness. As the inflation pressure increases, the cornering stiffness decreases.
also increases along with the vertical load, for all the pressures tested.
Figure 9. Cornering stiffness [N/deg] as a function of vertical force
[N], tyre Schwalbe (T03). Results for inflation pressure of (300, 400, 500) kPa, camber angle equal to 0°.
![Figure 9. Cornering stiffness CFy [N/deg] as a function of vertical force Fz [N], tyre Schwalbe (T03). Results for inflation pressure of (300, 400, 500) kPa, camber angle equal to 0°.](/cms/asset/8ddf9009-4344-4229-b71c-bd21ba5a5ff8/nvsd_a_2338143_f0009_oc.jpg)
3.2.2. Schwalbe 50 km Energizer (Active Plus P-Guard 5) – T04
Similar to the tyre presented in 3.2.1, this tyre shares the same tread patterns and layers, but it is featured by a different compound.
The results for different camber angles and vertical loads are presented in Figure . Although the lateral force does not show any unexpected behaviour, the self-aligning torque does not have a clear peak when the inflation pressure is equal to 500 kPa. It is hard to observe a defined curve trend, for all the camber angles we tested. Excessive inflation pressure may elicit unpredictable results.
Figure 10. Lateral force [N] and self-aligning torque
[Nm] as a function of slip angle
[deg]. In (A) and (B), results for inflation pressure of 500 kPa, vertical load 404 N, camber angle equal to (−5, 0, 5) deg. In (C) and (D), results for inflation pressure of 400 kPa, camber angle 0°, a vertical load of 343, 404, 488 N.
![Figure 10. Lateral force Fy [N] and self-aligning torque Mz [Nm] as a function of slip angle α [deg]. In (A) and (B), results for inflation pressure of 500 kPa, vertical load 404 N, camber angle equal to (−5, 0, 5) deg. In (C) and (D), results for inflation pressure of 400 kPa, camber angle 0°, a vertical load of 343, 404, 488 N.](/cms/asset/0ce10745-596f-4203-82f0-41d14a3ddeff/nvsd_a_2338143_f0010_oc.jpg)
The results for cornering stiffness obtained for different tests are collected in Table .
Table 5. Cornering stiffness for different vertical loads and inflation pressures (300, 400 and 500 kPa). In the last column, the variation (in percentage) of cornering stiffness due to increasing vertical load, referring to the lowest vertical load tested (here 343 N).
Both the lateral force and the cornering stiffness increase with the vertical load, at constant inflation pressure (Figure ). However, a peculiar behaviour was observed at inflation pressure equal to 500 kPa. Similar to the self-aligning torque, the unexpected trend could be attributed to very high inflation pressure, overtaking the values the manufacturer’s recommended values.
Figure 11. Cornering stiffness [N/deg] as a function of vertical force
[N], tyre Schwalbe Active (T04). Results for inflation pressure of (300, 400, 500) kPa, camber angle equal to 0°.
![Figure 11. Cornering stiffness CFy [N/deg] as a function of vertical force Fz [N], tyre Schwalbe Active (T04). Results for inflation pressure of (300, 400, 500) kPa, camber angle equal to 0°.](/cms/asset/8d4b9402-0bbc-4dc4-bc57-6215471c4d6f/nvsd_a_2338143_f0011_oc.jpg)
3.2.3. Scalato Mondano – T05
The tyre ‘Scalato Mondano’ is designed for city bikes, especially for e-bikes (usually heavier than muscular bicycles). As mentioned before, this tyre was tested only for inflation pressures of (300, 400) kPa.
The results from tests are depicted in Figure , for different camber angles (in (A) and (B)), and different vertical loads (in (C) and (D)).
Figure 12. Lateral force [N] and self-aligning torque [Nm] as a function of slip angle
[deg], tyre Scalato Mondano (T05). In (A) and (B), results for inflation pressure of 400 kPa, vertical load 404 N, camber angle equal to (−5, 0, 5) deg. In (C) and (D), results for inflation pressure of 300 kPa, camber angle 0°, a vertical load of 343, 404, 488 N.
![Figure 12. Lateral force Fy [N] and self-aligning torque [Nm] as a function of slip angle α [deg], tyre Scalato Mondano (T05). In (A) and (B), results for inflation pressure of 400 kPa, vertical load 404 N, camber angle equal to (−5, 0, 5) deg. In (C) and (D), results for inflation pressure of 300 kPa, camber angle 0°, a vertical load of 343, 404, 488 N.](/cms/asset/bf8e4cd7-9e04-4602-b841-06e5184e6336/nvsd_a_2338143_f0012_oc.jpg)
While maintaining a constant inflation pressure, the camber angle is responsible for the increase in the lateral force (Figure (A)). The same can be stated for the self-aligning torque, for high-side slip angles (Figure (B)). The cornering stiffness increases with the vertical load, keeping the inflation pressure constant (Figure (C)). Conversely, the cornering stiffness decreases with the increase of the inflation pressure when the vertical load is kept constant (Table ).
Table 6. Cornering stiffness for different vertical loads, inflation pressures (300, 400 kPa), tyre Scalato Mondano (T05). In the last column, the variation (in percentage) of cornering stiffness due to increasing vertical load, referring to the lowest vertical load tested (here 343 N).
Regarding the self-aligning torque, the peak values increase in magnitude as the vertical load increases. This is particularly visible for high slip angles (>|1,5| deg) (Figure (D)).
Numerical results from tests are summarised in Table .
When the pressure increases the cornering stiffness decreases (Figure ). The trend exhibits an increase with vertical load, and the curves appear to be shifted by a magnitude of approximately 10 N/deg.
Figure 13. Cornering stiffness [N/deg] as a function of vertical force
[N], tyre Scalato Mondano (T05). Results for inflation pressure of (300, 400) kPa, camber angle equal to 0°.
![Figure 13. Cornering stiffness CFy [N/deg] as a function of vertical force Fz [N], tyre Scalato Mondano (T05). Results for inflation pressure of (300, 400) kPa, camber angle equal to 0°.](/cms/asset/445d54ab-0e66-43a9-87de-3313b8eccbca/nvsd_a_2338143_f0013_oc.jpg)
3.3. Comparisons
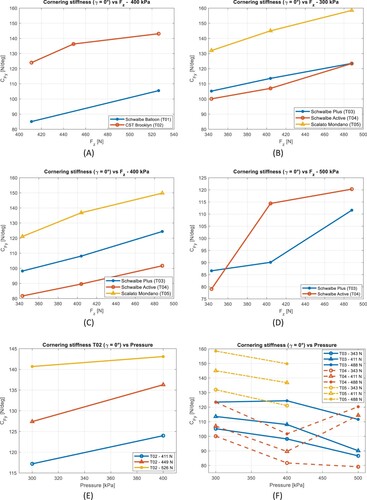
Comparing the results obtained for the Schwalbe Balloon (Big Ben Plus – T01) and the CST Brooklyn T02 (same wide tyres), we notice that the cornering stiffness of the CST tyre T02 is remarkably higher than that of Schwalbe Balloon T01, for the same inflation pressure (400 kPa) and vertical load (411 and 526 N) (Figure (A)). Specifically,
is on average +47% for a vertical load of 411 N, and +36% for
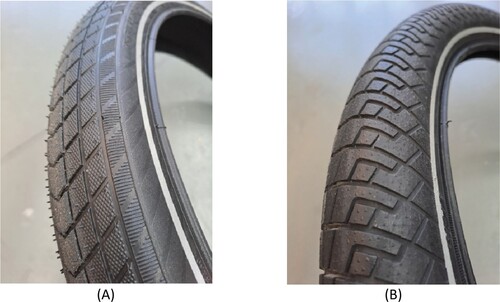
= 526 N. We guess that this may be due to differences in sidewall stiffness, hard compound and tread pattern geometry. While the Schwalbe Balloon T01 features 2.3 mm tread pattern depth, the CST Brooklyn T02 tread pattern is smoother and just 1.9 mm depth (−17%) (see Figure ), therefore, to some extent closer to a slick tyre. These features may justify the remarkable difference in cornering stiffness. Note that the tyres were mounted on the same rim (Mach1 Kargo) for the tests.
Figure 14. Detail of tread pattern. In (A), Schwalbe Balloon (Big Ben Plus – T01) 20″ × 2,15. In (B), CST Brooklyn (T02) 20″ × 2,15.
The CST Brooklyn (T02) results are similar to the ones of the Scalato Mondano (T05) (Figure (C)), under the same working conditions (inflation pressure 400 kPa, camber angle 0°). Among the tested tyres, the Schwalbe Balloon (T01) has the lowest value of cornering stiffness.
Figure 15. Cornering stiffness comparison for different tyres. (A) cargo bicycle tyres T01 and T02, for camber angle equal to 0° and inflation pressure 400 kPa. (B) tour/city bicycle tyres, for a camber angle equal to 0° and inflation pressure of 300 kPa. (C) tour/city bicycle tyres, for camber angle equal to 0° and inflation pressure of 400 kPa. (D) tour/city bicycle tyres, for camber angle equal to 0° and inflation pressure of 500 kPa. We do not have data for inflation pressure of 500 kPa for the Scalato Mondano (T05) tyre, so we can only compare results from two tyres (respectively, T03 and T04). (E) shows the cornering stiffness as a function of the inflation pressure, depicted for different vertical loads (411, 449, 526 N), for CST Brooklyn (T02). (F) is equivalent to (E), but reports the results for the tyres T03, T04 and T05.
In [Citation33], a Schwalbe cargo bicycle tyre was tested employing a truck for outdoor testing. Unfortunately, a direct comparison of the results cannot be carried out since they tested under higher vertical loads (for 625 N to 765 N, camber angle equal to 0°). They pointed out a decrease in cornering stiffness as the inflation pressure increases (from 300 to 400 kPa), contrariry to what was observed for the CST Brooklyn (T02) we tested. This may be due to the differences in vertical loads (100 N higher in [Citation33]). Regarding the vertical load of 625 N, the cornering stiffness found in [Citation33] was about 180–190 N/deg, resulting in 35% higher than the value measured for CST Brooklyn (T02) at 526 N.
As for tour/city bicycle tyres, the Scalato Mondano (T05) exhibits the highest cornering stiffness, both for inflation pressure 300 and 400 kPa. The tyre T05 indeed shows a stiffer and smoother tread pattern. As stated before for CST Brooklyn T02, this may justify larger cornering stiffness. The Schwalbe tyres (T03 and T04) feature very similar tread patterns and an inflation pressure of 300 kPa (Figure (B)), with an average difference of 4% (Table 7). Then, the
of the Schwalbe Plus (T03) is higher than the Schwalbe Active (T04) at an inflation pressure of 400 kPa (maximum pressure recommended by the manufacturer). Surprisingly, the T03
at an inflation pressure of 500 kPa is higher than Schwalbe Plus (T03) as the vertical load increases (Figure (D)). Schwalbe Plus (T03) features an additional anti-puncture layer. This may partially justify the differences in the measured
.
As already stated, road racing bicycle tyres feature the superimposition of different layers (as anti-puncture protection) [Citation34] which may cause a remarkable deviation in tyre characteristics as a function of working parameters. The interaction between different compound layers is hard to predict, resulting in unclear trends. On the contrary, for tyres with a few layers (without specific anti-puncture protection,) it seems to be easier to find a specific trend [Citation27].
The inflation pressure also plays a relevant role in tyre cornering stiffness, as depicted in Figure (E,F). In (E), we report the as a function of the inflation pressure, for the cargo bike tyre CST Brooklyn T02. We have no data for different inflation pressures for tyre Schwalbe Balloon T01, indeed. As we only have results for two different inflation pressures (300 and 400 kPa), we can see the increase in
for all the tested vertical loads. Whether we focus only on pressure 300 and 400 kPa, this is exactly the contrary of what happens for the tour/city bicycle tyres T03, T04 and T05. This may be explained by considering that the cargo tyre T02 can carry vertical loads higher than the tested ones; therefore, we are still far from the saturation limit. An increase in the inflation pressure may still allow carrying higher vertical loads without impacting negatively the lateral characteristics. Contrarily for the tyres T03, T04 and T05 (Figure (F)), higher inflation pressure mean a decrease in the
(from 300 to 400 kPa). They are conceived to carry lower vertical loads than cargo bike tyres, thus justifying the decreasing trend. Although this applies for inflation pressure up to 400 kPa, the tyre T04 increases in
for higher pressures (we cannot state anything for pressure higher than 500 kPa as we constrained the research to the range of pressures recommended by the manufacturer – 300–500 kPa). The T04 mainly differs from the T03 in the presence of an anti-puncture protection layer. As mentioned before referring to (D), the addition of multiple layers during the manufacturing process may affect the tyres’ characteristics. To some extent, in [Citation34] we also found that the cornering stiffness of racing bicycle tyres obtained from multiple layers of different compounds is more sensitive to pressure variation, sometimes leading to unexpected results.
of tour/city tyres is collected in Table , and the percentage variation between tyres
is reported in the last column.
Table 7. Comparison of cornering stiffness for different tour/city tyres Schwalbe Plus (T03), Schwalbe Active (T04) and Scalato Mondano (T05). In the last column, the variation (in percentage) for different tyres, with the same working conditions (same inflation pressure and vertical load).
As expected, all the tyres show an increase in cornering stiffness as the vertical load increased, with all the inflation pressures tested [Citation27,Citation35].
4. Modelling
After collecting the experimental data, we fit the Pacejka Magic Formula [Citation36,Citation37] to the data. The current study refers to steady-state working conditions, neglecting the transient effects [Citation38]. We investigate the use of a simplified semi-empirical Magic Formula (4) [Citation39], which is easy to manage and still suitable for our purposes. It requires the identification of 14 parameters for lateral force and 18 parameters for self-aligning torque, using an iterative optimisation process. More complex Magic Formula models can also take into account the effect of pressure variation; nonetheless, they need to be integrated with more parameters, which are currently hard to measure with our experimental set-up. The literature on bicycle tyre modelling is still poor, and technological limitations of the experimental apparatus used for testing do not allow the measurement of a large part of parameters needed for more complex tyre modelling (for example, acceleration/braking situations, real-time inflation pressure measurement). Furthermore, as for simulations, we are mostly interested in a linear range of curves (slip angles in the range + −4°), for which simplified Magic Formula models still work well.
The lateral force and the self-aligning torque
can be predicted according to the following model (
is a generic term to be replaced with
or
) (4)
(4)
(4) An iterative best-fitting method was implemented in MATLAB® R2021a (MathWorks, Natick, USA) [Citation24] to find the best set of parameters.
locates the centre point of the curve for the origin.
is the stiffness factor while
is estimated from the maximum peak value of the curve.
is known as a shape factor,
determines the curvature at the peak.
We identified all the optimal parameters, for each tyre we tested. Optimal parameters and scripts for processing are made publicly available [Citation40,Citation41]. The set of coefficients ,
,
,
are shown in Table , for each tested tyre and inflation pressure.
Table 8. Coefficients of fitting for all the tested tyres under different inflation pressures and vertical loads.
Magic Formula was initially conceived for car/truck tyres, designed to carry much higher vertical loads than bicycle tyres. This made somehow challenging the identification of the optimal parameters for our batch of bicycle tyres, especially the strategy to identify the initial parameters. To cope with it, at the very beginning, we used a set of initial parameters from ADAMS/Tire [Citation37] to fit a single set of bicycle tyre data. Afterwards, we deployed the optimal parameters for the first tyre we processed as initial parameters for the next set of data. We repeated the procedure for all the tyres. This strategy might explain the reason why we have strong consistency among the values found for the tour/city bicycle tyres T03, T04 and T05.
parameters deviate for the cargo tyres T01 and T02 instead, which is expected due to their different sizes and features.
The order of magnitude of the coefficients for the same tyre is consistent throughout the different inflation pressures and vertical loads, with only a few exceptions. The latter are mainly because we did not reach the saturation limit, or a clear trend of experimental data close to the saturation limit was not clear as in the case of cargo tyres (this may justify the plus and minus sign of the coefficient – curvature at the peak). The results for tyre Schwalbe Active, tested at an inflation pressure of 300 kPa, under different vertical loads and camber angles are shown in Figure . Experimental data (blue circles) have been down-sampled only for enhanced plot visualisation. Then, the fitting lines are the results of the Magic Formula model (4). Optimal parameters have been calculated for each tyre, one set per each inflation pressure [Citation40].
Figure 16. Lateral force [N] and self-aligning torque [Nm] for Schwalbe Active, inflation pressure of 300 kPa. Experimental data from VeTyT are depicted as blue circles. Lines are the fitting curves from Magic Formula (4). In (A) and (B), results for camber angle 0°. In (C) and (D), results for camber angle −5°. In (E) and (F), results for camber angle 5°.
![Figure 16. Lateral force [N] and self-aligning torque [Nm] for Schwalbe Active, inflation pressure of 300 kPa. Experimental data from VeTyT are depicted as blue circles. Lines are the fitting curves from Magic Formula (4). In (A) and (B), results for camber angle 0°. In (C) and (D), results for camber angle −5°. In (E) and (F), results for camber angle 5°.](/cms/asset/a3d2e1f8-60a9-442f-a0e7-9cb7705ab9ff/nvsd_a_2338143_f0016_oc.jpg)
Visual inspection of the results gave positive feedback for the majority of the tested tyres. However, some difficulties were found for the self-aligning torque of the CST Brooklyn tyre (Section 3.1.2, Figure (B,D)). The unexpected trend observed in may result from misalignments in the tyre itself, supposed to come from the manufacturing process (as discussed in Section 3.3). Despite our attempts to address the issue, theMagic Formula model could not fit well the experimental results. We think that this discrepancy was mainly due to the unique features of the tyre we tested.
5. Conclusion
The paper presents the measurements of the lateral characteristics for cargo and tour/city bicycles. The tests were performed with the VeTyT, a test rig specifically designed for bicycle tyres. Then, based on experimental data, we found the optimal parameters for the Magic Formula model, both for the lateral force and the self-aligning torque. A strong relationship between the cornering stiffness and the vertical load was observed, with the latter being the main parameter affecting the results. Also, inflation pressure played a large role, as it changed the tyre stiffness both in the radial and lateral directions.
The main findings are as follows.
Cargo bicycle tyres usually reach saturation conditions for high vertical loads and/or large slip angles. However, due to the limitations of our experimental set-up, we could test up to
526 N, and the saturation limit was not yet pointed out.
Significant variations in both cornering stiffness and self-aligning torque were observed among cargo bicycletyres of different brands. The cornering stiffness of the CST Brooklyn was on average 40% higher than the Schwalbe Balloon. We supposed that this difference may be due to compound, sidewall stiffness and tread pattern (smother and less depth for the CST Brooklyn). Concerning the self-aligning torque, unexpected results were measured for the CST Brooklyn, without a symmetric trend for a slip angle of 0°. We also found a biased contact patch, with a step left/right side of the tyre, for the median plane line. This might result from the manufacturing process.
As for tour/city bicycle tyres, Scalato Mondano had higher values of cornering stiffness than the Schwalbe tyres (on average 25% larger than the Schwalbe tour/city tyres) at the tested inflation pressures (300 and 400 kPa).
The CST Brooklyn (cargo bicycle tyres) had an increase in cornering stiffness as the inflation pressure increased. On the contrary, the other tested tyres displayed the opposite trend. Regarding tour/city bicycle tyres, an increase in inflation pressure usually means a decrease in cornering stiffness. We may explain this unexpected result considering the strong and hard carcass of cargo tyres, specifically designed to carry high loads.
Tests were constrained to ±5° of camber angle, to minimise excessive tread pattern wear. In this way, it was possible to test different vertical loads and inflation pressures.
Simpler Magic Formula models can still provide valuable results for bicycle tyres. However, advanced models should be considered for modelling inflation pressure variations. They are required to implement a proper set-up to measure a lot of parameters, but nowadays still hard to do due to technical and cost limitations.
The data and the code used in this publication have been made publicly available to enhance advancements in the research fields of bicycle tyres and bicycle dynamics.
Acknowledgements
The authors thank Prof. G. Magnani and Prof. Giorgio Previati for their contribution to the construction of the VeTyT. Isabel Pollini, Vincenzo Tartaglione and Federico Maria Ballo are acknowledged for their support during the months of experimental tests. Special thanks to Mario Pennati, who was always willing to help us. Sometimes it was difficult to perform the tests, but we also had a lot of fun together. We thank Prof. Barys Shyrokau, who helped us with tyre modelling. Last but not least, we thank Sierd Heida and Royal Dutch Gazelle, for providing the tyres we tested.
Disclosure statement
No potential conflict of interest was reported by the author(s).
Authors’ disclaimer
The data produced in this paper are not -and cannot be- related in any way to the quality of the products that have been tested. Only one single tyre per type has been tested and the data have been acquired in a laboratory, which is not the real environment. Relevant factors defining the quality of tyres are not -and cannot be- addressed in this paper.
List of abbreviations
List of abbreviations used in this paper.
VeTyT: acronym of Velo Tyre Testing, a test rig specifically designed for bicycle tyres. It is currently located at the Department of Mechanical Engineering of Politecnico di Milano (Italy) [Citation21].
MF: Magic Formula, a semi-empirical model used to fit the model curve to the experimental measured data from tyres [Citation36].
ETRTO: European Tyre and Rim Technical Organisation [Citation42].
Additional information
Funding
References
- Mastinu G, Ploechl M. Road and off-road vehicle system dynamics handbook. Boca Raton, FL: Taylor & Francis Group, LLC; 2014.
- Blundell M, Harty D. Tyre characteristics and modelling. In: The multibody systems approach to vehicle dynamics. 2nd edition. Oxford, UK: Elsevier; 2015. p. 335–450. doi:10.1016/b978-0-08-099425-3.00005-4.
- Sankar Mohanta B, Kumar A. A parametric analysis on the performance of vehicle tires. Mater Today Proc. 2023;81(2):238–241. 10.1016/j.matpr.2021.03.167.
- Chicu N, Prioteasa A-L, Deaconu A. Current trends and perspectives in tyre industry. Stud Univ “Vasile Goldis” Arad – Econ Ser. 2020;30(2):36–56. doi:10.2478/sues-2020-0011
- Cossalter V, Doria A, Formentini M, et al. Experimental and numerical analysis of the influence of tyres properties on the straight running stability of a sport-touring motorcycle. Veh Syst Dyn. 2012;50(3):357–375. doi:10.1080/00423114.2011.587520
- Cossalter V, Lot R, Maggio F. The modal analysis of a motorcycle in straight running and on a curve. Meccanica. 2004;39(1):1–16. doi:10.1023/A:1026269926222
- Previati G, Magnani G, Mastinu G. Analysis of bicycle shimmy and relevant bicycle compliances. Proceedings, Bicycle and Motorcycle Dynamics 2019 Symposium on the Dynamics and Control of Single Track Vehicles, 2019 [cited 2023 Jan 5]. [Online]. Available from: https://bmd2019.figshare.com/articles/conference_contribution/Analysis_of_Bicycle_Shimmy_and_Relevant_Bicycle_Compliances/12363707
- Tomiati N, Colombo A, Magnani G. A nonlinear model of bicycle shimmy. Veh Syst Dyn. 2019;57(3):315–335. doi:10.1080/00423114.2018.1465574
- Kalsbeek IM. Experimental investigation into the shimmy motion of the bicycle for improving model-based shimmy estimations. 2016.
- Plöchl M, Edelmann J, Angrosch B, et al. On the wobble mode of a bicycle. Veh Syst Dyn. 2012;50(3):415–429. doi:10.1080/00423114.2011.594164
- Klinger F, Nusime J, Edelmann J, et al. Wobble of a racing bicycle with a rider hands on and hands off the handlebar. Veh Syst Dyn. 2014;52(SUPPL. 1):51–68. doi:10.1080/00423114.2013.877592
- Dressel AE. Measuring and modeling the mechanical properties of bicycle tires [dissertation]. University of Wisconsin-Milwaukee. 2013. [Online]. Available from: https://dc.uwm.edu/etd/386
- Doria A, Tognazzo M, Cusimano G, et al. Identification of the mechanical properties of bicycle tyres for modelling of bicycle dynamics. Veh Syst Dyn. 2013;51(3):405–420. doi:10.1080/00423114.2012.754048
- Dressel A, Sadauckas J. Characterization and modelling of various sized mountain bike tires and the effects of tire tread knobs and inflation pressure. Appl Sci. 2020;10(9):1–22. doi:10.3390/app10093156.
- Dell’Orto G, Ballo FM, Mastinu G. Experimental methods to measure the lateral characteristics of bicycle tyres – a review. Veh Syst Dyn. 2023;61(11):2738–2760. doi:10.1080/00423114.2022.2144388.
- Corwin S, Zarif R, Berdichevskiy A, et al. The futures of mobility after COVID-19. Scenarios for transportation in a postcoronavirus world. Deloitte Development LLC. 2020; p. 1–21.
- Caggiani L, Colovic A, Prencipe LP, et al. A green logistics solution for last-mile deliveries considering e-vans and e-cargo bikes. Transp Res Procedia. 2021;52:75–82. doi:10.1016/j.trpro.2021.01.010
- Llorca C, Moeckel R. Assesment of the potential of cargo bikes and electrification for last-mile parcel delivery by means of simulation of urban freight flows. Eur Transp Res Rev. 2021;13(1):1–14. doi:10.1186/s12544-021-00491-5.
- Dell’orto G, Ballo FM, Mastinu G, et al. Indoor measurement of the lateral characteristics of a cargo bicycle tyre. Evol Scholar. 2023. doi:10.24404/644ba1e13c57633bb23a9dc6
- Babboe carve - tilting cargo bicycle [cited 2023 June 20]. [Online]. Available from: https://www.babboe.nl/
- Dell’Orto G, Ballo FM, Mastinu G, et al. Bicycle tyres – development of a new test-rig to measure mechanical characteristics. Measurement. 2022;202: 111813. doi:10.1016/j.measurement.2022.111813
- Pacejka HB, Bakker E. The magic formula tyre model. Veh Syst Dyn. 1992;21(sup1):1–18. doi:10.1080/00423119208969994
- Dell’Orto G, Moore JK, Mastinu G, et al. Bicycle tyre data - lateral characteristics. 2023. doi:10.5281/ZENODO.7866646
- T. M. Inc. MATLAB version 9.10.0.1684407 (R2021a) Update 3. Natick, Massachusetts. 2021.
- Mastinu G, Gobbi M, Previati G, et al. Measurement of forces and moments of bicycle tyres. Bicycle and Motorcycle Dynamics 2019 Symposium on the Dynamics and Control of Single Track Vehicles, 9–11 September 2019, University of Padova, Italy. 2019;51(3):405–420. doi:10.1080/00423114.2012.754048
- Dell’Orto G, Mastinu G. Effect of temperature on the mechanical characteristics of bicycle tyres. In: International Cycling Safety Conference 2022. Dresden; 2022.
- Dell’Orto G, Ballo FM, Mastinu G, et al. Racing bicycle tyres – Influence on mechanical characteristics of internal pressure, vertical force, speed and temperature. Eur J Mech A Solids. Jul. 2023;100; 105010. doi:10.1016/j.euromechsol.2023.105010
- Ralf Bohle GmbH. Schwalbe GmbH, ‘Products’ [cited 2023 June 8]. [Online]. Available from: https://www.schwalbe.com/en/city-tour
- Pacejka HB, Besselink IJM. Magic formula tyre model with transient properties. Veh Syst Dyn. 1997;27(Suppl):234–249. doi:10.1080/00423119708969658
- CHENG SHIN RUBBER (XIAMEN) IND.: LTD. (2023). [cited 2023 June 9]. [Online]. Available from: https://www.csttires.com/int/tire/brooklyn-pro-c1996/
- Unrau H, Zamow J. TYDEX-Format Manual Release 1.3. Description and Reference Manual; 1997. p. 1–55. [Online]. Available from: http://scholar.google.com/scholar?hl=en&btnG=Search&q=intitle:TYDEX-Format#2
- Dell’Orto G, Ballo FM, Gobbi M, et al. Twisting torque – a simplified theoretical model for bicycle tyres. Measurement. 2023;221:113460. doi:10.1016/j.measurement.2023.113460
- Miller M, Pfeil M, Reick B, et al. Measurement and modeling of a cargo bicycle tire for vehicle dynamics simulation. Appl Sci. 2023;13(4):2542. doi:10.3390/app13042542
- Dell’Orto G, Ballo FM, Mastinu G, et al. Racing bicycle tyres: experimental indoor evaluation of relaxation length. Meccanica. 2023;58(8):1523–1537. doi:10.1007/s11012-023-01684-z
- Blundell M, Harty D. Tyre characteristics and modelling. In: The multibody systems approach to vehicle dynamics. Elsevier; 2015. p. 335–450. doi:10.1016/b978-0-08-099425-3.00005-4
- H. B. Pacejka, Tire and vehicle dynamics. Oxford, UK2006. doi:10.1016/B978-0-7506-6918-4.X5000-X.
- MSC Software. Introducing Adams/Tire.
- Mastinu G, Pairana E. Parameter identification and validation of a pneumatic tyre model. Veh Syst Dyn. 1992;21(sup1):58–81. doi:10.1080/00423119208969999
- Bakker E, Pacejka HB, Lidner L. A new tire model with an application in vehicle dynamics studies. SAE Tech Pap. 1989;98:101–113. doi:10.4271/890087
- Dell’Orto G, Moore JK, Mastinu G, et al. Magic formula parameters - bicycle tyres. May 2023. doi:10.5281/ZENODO.7920415
- Dell’Orto G. Magic Formula 89. https://github.com/mechmotum/Magic-Formula-89.
- ETRTO. European tyre and rim technical organisation [cited 2023 June 21]. [Online]. Available from: https://www.etrto.org/home
- Farroni F, Dell’annunziata GN, Ruffini M, et al. Thermal model for bicycle tire internal temperature evaluation in various contact conditions. Evol Scholar. 2023;3. [cited 2024 Feb 24] [Online]. Available from: doi:10.59490/650dd6a3744cc87c1adcd283
- Smurra M, Spinella F. Advanced testing of bicycle tyres [master’s thesis]. Politecnico di Milano; 2018.