
ABSTRACT
For over 30 years GIS has been a major theme in archaeology, leading scholars to debate the way geo-spatial platforms can contribute to a better understanding of the ancient landscape and a more thorough interpretation of the archaeological record. Recently, the introduction of more advanced software and hardware solutions have made it possible to use GIS for visualizing and analysing even geometrically complex 3D contents, in a totally unprecedented way. Still, a theoretical debate on the way three-dimensionality could impact GIS-based research has yet to come and only a few pioneering projects have been conducted to show the potential for the discipline. Among the possible lines of enquiry to be developed in this direction, sensory archaeology seems to be one to benefit more from such an approach. Starting from a review of the current state of research this contribution will attempt to show some important results recently obtained in order to generate some insights on theoretical and methodological issues raised by the use of state-of-the-art 3D GIS and to trace new paths for the future.
1. Introduction
Recent advances in digital technology have opened up interesting new paths in the way archaeological data are collected, analysed and interpreted. Image-based modelling techniques, Unmanned Aerial vehicles and 3D GIS are radically changing the way we do archaeology both in field and lab. Such advances pose new questions on how GIS can empower the interpretative framework through the adoption of new paradigms of representation which should not aim to substitute for reality, but, rather, to provide a more adequate picture to build an archaeological interpretation. In the last four years, research conducted at Lund University has tried to shed new light on the enormous potential of implementing fully three-dimensional GIS platforms and using them to address specific archaeological problems through novel approaches.
This contribution will start from some major critiques of GIS in archaeology to move on to the necessity to develop a more self-aware and ambitious use of three-dimensionality, to promote a heuristic framework for data interpretation rather than just a mere means for improving the visualization experience (which, still, is not a trivial achievement!).
Indeed, so far there has been limited debate on the theoretical implications of the introduction of ‘entirely-3D’ GIS. This could be partially due to the fact the introduction of methods and techniques for importing and managing advanced 3D contents on a GIS platform is relatively recent. Yet, debate around 3D GIS is not a novel topic per se, as more than 20 years ago archaeologists started discussing the possibilities associated with the introduction of three-dimensionality in the context of GIS studies.
It was indeed during the 1990s that a real debate emerged, when some authors first began to discuss three-dimensional data representation in archaeological computing. That was the time when Paul Reilly (Citation1990) advocated for introducing solid-model representation of archaeological stratigraphy in order to improve the quality of data visualization and so to empower the interpretative capability of the archaeological record. Gillings and Goodrick (Citation1996) discussed the need of a more ‘sensual’ GIS, in which relationships between people and place, cultural and environmental issues could be investigated in a more effective way. In particular, they pointed out an important scope in merging VR and GIS: to simulate rather than merely imitate aspects of the reality ‘as a sensual form of communication’. The VRML language was proposed as a possible solution to combine GIS with 3D data representation. The idea lying behind this was that three-dimensionality could have an important role in filling in the gap. In this respect, the term Virtual Archaeology was introduced in the same years to describe the process of digitally reconstructing past landscapes and ancient monuments in order to provide a different narrative of an archaeological site (Forte and Siliotti Citation1997).
2. Previous work: 3D GIS in context
GIS is a widely debated theme in archaeology and it is beyond the scope of this contribution to recapitulate or question all the theoretical and methodological implications related to its use and misuse in the realm of the discipline (Harris and Lock Citation1995; Lock and Stancic Citation1995; Kvamme Citation1999; Lock Citation2001; Wheatley and Gillings Citation2003; Conolly and Lake Citation2006). What it is useful to focus on instead is the way GIS’ representation of reality has been treated so far and, in particular, whether GIS platforms can reach the point to become an exploratory framework to investigate the very subjective nature of human perception of space or, put more simply, whether can GIS ever become a real ‘place to think’ (Gillings and Goodrick Citation1996). To date, some authors have outlined how GIS are not a sufficient instrument to recreate and simulate those conditions that characterized past human experience. In a recent article Llobera (Citation2012) stresses the fact that the complexity of a landscape can hardly be grasped by commonly used spatial representations as they tend to provide a poor picture of the reality. Typically, geometric symbols visualized in the form of vector primitives are used to represent objects that in fact had a three-dimensional appearance. It is apparent that those representations are totally inadequate to recreate the ‘sense of place’ (Lock Citation2003, 176) as it was perceived in ancient times.
The attempt to merge GIS and 3D is attested back in the mid of 1990s when Faust (Citation1995) presented one of the very first case studies on this. He argued that the very advantage of three-dimensionality would be the possibility to develop traditional GIS functions in a three-dimensional space: in particular he mentioned the database query-related functions and visibility tools based on vector graphics, such as the line-of-sight analysis. Interestingly, that was the time when some of the most authoritative works on visibility analysis in archaeology were produced (Wheatley Citation1995; Llobera Citation1996; Loots Citation1997; Van Leusen Citation1999) and all of them were focused on a 2.5D approach.
Again, at the beginning of the 2000s, Rahman, Pilouk, and Zlatanova (Citation2001) pointed out how real 3D GIS had yet to come and identify some critical concerns in the expensive acquisition techniques for getting 3D models, or the inability of software at that time to perform spatial analysis. Nevertheless, some attempts to introduce 3D-based visualization in archaeological GIS were conducted at that time (Barceló et al. Citation2003; Merlo Citation2004; Losier, Pouliot, and Fortin Citation2007; Katsianis et al. Citation2008; Lieberwirth Citation2008). Most of these attempts consisted of site-scale documentation in which the contribution of three-dimensionality was essentially due to the possibility of providing a more thorough representation of the excavation units by analysing their volume. Such an achievement was possible due to the use of voxels as a spatial analytic framework (Bezzi et al. Citation2006).
Thus, it was only in the early 2000s that a more advanced form of data representation was handled by commercial software ESRI Arcview, which allowed users to visualize 3D boundary models, in the form of multipatch geometry (ESRI Citation2012) linked to an attribute table and organized in a spatial database. As it was argued at that time (Smith and Friedman Citation2004), this shapefile could take part in most of the geoprocessing operations. This was a crucial turning point to define a different way of presenting contents in a geospatial context. It was not just a matter of visualizing and moving objects in three-dimensional canvas but also a way to analyse them and to move to a fully 3D space most of the routine operations available in a 2–2.5D GIS. This was basically the beginning of a new era for GIS, an era in which data analysis was no longer restricted by conventional rules of bi-dimensional map representation, but was moving towards a more complex way of describing the reality, which is typically three-dimensional.
3. Theory and methods
3.1. Where are we now?
In recent years the introduction of new techniques of 3D acquisition (Callieri et al. Citation2011; Dellepiane et al. Citation2013; De Reu et al. Citation2013; Dell’Unto et al. Citation2013; Dell’Unto Citation2014; De Reu et al. Citation2014) increased the capability of providing a more detailed picture of any archaeological entity, either a single artefact or an entire landscape. In particular, what has been previously described as a shift towards a high-definition archaeology (Gowlett Citation1997) now seems to be an accomplishable goal. High-resolution textured 3D models can now be easily produced and their overall quality can be reasonably compared to models derived from more traditional acquiring techniques, such as laser scanning (Aguilera and Lahoz Citation2006; Fassi et al. Citation2013; Cardaci and Versaci Citation2013). Additionally, some commercial GIS software packages started managing 3D models in the form of textured meshes made up of a quite high number of vertices and polygons (Opitz and Nowlin Citation2012).
Those aspects laid the foundation to re-think different paradigms of data representation, pushing forward the boundaries of archaeological GIS. As ‘’ Lock (Citation2003) recognized there is enormous potential for combining GIS and Virtual Reality. In particular he acknowledges as a crucial element the possibility of introducing a digital platform with independent x,y,z axis to perform spatial analysis by taking advantage of a ‘truly’ three-dimensional space. This would allow the moving of three-dimensionality from being a simple attribute for improving any user’s visualization experience, to becoming an exploratory tool which has the capability of enabling more complex analysis on datasets. Indeed, most of the research conducted so far in the field of 3D Archaeology (or Virtual Archaeology) very seldom presented three-dimensionality as a framework for spatial analysis (Paliou, Wheatley, and Earl Citation2011; Paliou Citation2011; Opitz Citation2017) and almost no discussion has been raised regarding the need for a functioning 3D GIS, with the exception of very few articles published recently (Richards-Rissetto Citation2017). Interestingly, research conducted at Lund University in the last few years has tried to demonstrate the enormous potential of combining in the same digital environment the analytical capabilities of GIS with the accuracy of data representation provided by advanced 3D graphics (Campanaro et al. Citation2015; Dell’Unto et al. Citation2015; Landeschi et al. Citation2015). This led to the development of a line of enquiry devoted to the combination of integrated techniques of digital acquisition and state-of-the-art commercial GIS software for the investigation of archaeological problems for which 3D-based spatial analysis would have provided more effective solutions.
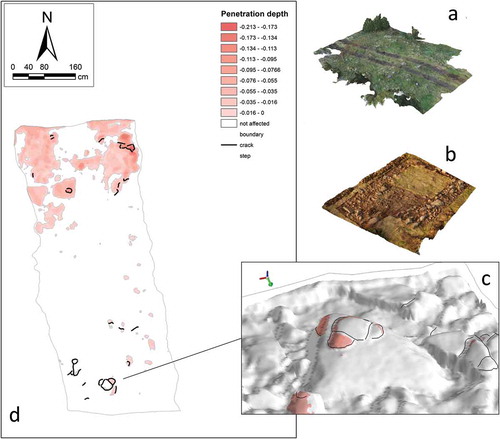
As an example, at intra-site scale, 3D GIS has recently proved to be an essential element in analysing the damage which occurred to a Viking Age site that was affected by the destructive action of a vehicle’s wheels. Image-based 3D modelling allowed archaeologists to acquire a model of the ground surface after the passage of the vehicle and the marks left by the wheels. An additional model was acquired a few months later when the same area was excavated so that the two obtained models could be compared one against each other (). This provided the possibility to quantify, through 3D vector-based intersection operations, how deep the surface of the first model penetrated down into the second model, giving a clear indication of the depth of erosion exerted by the wheels’ action which caused part of the stones belonging to the Viking Age settlement to be smashed and partially destroyed (Landeschi, Nilsson, and Dell’Unto Citation2016b).
Figure 1. 3D vector- and raster-based analytic tools have been employed to make an assessment of the surface erosion exerted by the action of a vehicle’s wheels into an archaeological deposit related to a Viking Age site in southern Sweden. Starting from the comparison between models acquired before (a) and after (b) the stratigraphic investigation, it was possible to map (c) the extension and the depth of penetration and so to define the degree of damage which occurred to the archaeological material ‘’ (Landeschi, Nilsson, and Dell’Unto Citation2016b).
This was in brief an experiment in using 3D GIS and 3D spatial analysis techniques to assess the damage which occurred to an archaeological site, by taking advantage of three-dimensionality and the physical relations between 3D boundary models representing the same portion of land at different times of year. This aspect even allowed us to prove how multi-temporality has expectedly tight connections with the development of a fully 3D GIS, as was predicted by Lock and Harris (Citation1997). A 4D GIS, which includes time as an additional dimension, has thus even more chance to provide archaeologists with a reliable picture of the archaeological record, by shedding light not only on the spatial relations between contexts, but even on the diachronicity of the actions as they occurred in the depositional process. As a further result of this experiment, a work pipeline has been developed to provide field archaeologists with innovative methods of site evaluation that heavily rely on formal methods of analysis based on the use of 3D as a further source of information. Hopefully, such a method could become a standard procedure in the next few years. At least, it is a starting point towards the accomplishment of that ‘3D-thinking turn’ recalled by Campana (Citation2014).
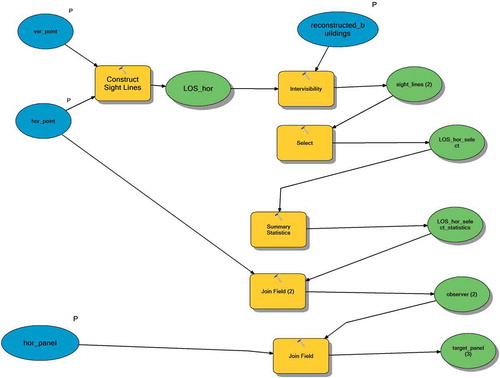
Still, one of the big challenges remains to make 3D GIS a place for performing more advanced analysis and to conduct a deep investigation of the way space was perceived in the past, to better understand how the ‘archaeological landscape’ (Forte Citation2003) has been built up and to read ‘through the eyes of ancient peoples’ the symbolic dimension which often lies ‘unrevealed’ behind material culture, due to the ‘context-dependency’ of its significance. It is therefore important to rely on formal approaches that can allow archaeologists to validate certain assumptions that would be hardly grasped just by relying on an empirical evaluation made by the archaeologists themselves ‘being-in-the-field’ (Tilley Citation1994) and, more importantly, being in the present (Merlo Citation2004). To reach this goal, once again the combination of 3D data accuracy and a GIS-based analytical framework opens up interesting new paths in that direction. In the frame of the Swedish Pompeii Project one of the first attempts in conducting 3D visibility analysis in GIS took place, with the result of generating some important insights on the role of geometrically complex 3D models as visual obstacles capable of affecting the line of sight connecting viewers to targets (Landeschi et al. Citation2016a). This experiment helped us to confirm what other scholars recognized as being one of the main characteristics of 3D visibility analysis: the capability of including real 3D objects in the simulation process and, so, to increase the overall reliability of the outcoming model (Earl Citation2007; Paliou Citation2013). On the other hand, this was an attempt to move forward the line of enquiry about GIS-based visibility analysis in archaeology (Wheatley Citation1995; Lake, Woodman, and Mithen Citation1998; Van Leusen Citation1999; Wheatley and Gillings Citation2000; Lock, Kormann, and Pouncett Citation2014), by pointing out the enormous advantage of a 3D GIS approach, compared to a more traditional 2.5 raster-based viewshed analysis. It was thus possible to test the method on two different categories of datasets: wall inscriptions and frescoes located in the house of Caecilius Iucundus. Due to the communicative value of these objects, using vector-based line-of-sight analysis was a way to ‘measure’ that space to be suitable for people standing by to look and perceive these artefacts ().
Figure 2. To speed up the LOS calculation, the Model Builder has been employed ‘’ (Allen Citation2011). This visual programming language enabled us to chain together several geoprocessing tools in order to run calculations automatically on massive datasets of points, including observers and targets ‘’ (Landeschi, Nilsson, and Dell’Unto Citation2016b).
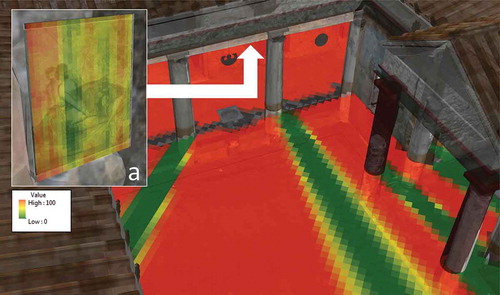
Interestingly, by analysing an erotic fresco located in the peristyle, it was possible to determine that its seemingly visually dominant position just next to the dining room entrance door was actually not so visible, due to the presence of columns and the narrowness of the visual angle compared to the peristylium entrance door which would have prevented passersby from clearly recognizing the figures and the scenes represented in the fresco (). This posed a new problem, related to the visual acuity of the objects (Ogburn Citation2006; Bernardini et al. Citation2013) and any possible effect played by artificial or natural light, which undoubtedly has a major role in the human perception of space (Papadopoulos and Earl Citation2014; Papadopoulos, Hamilakis, and Kyparissi-Apostolika Citation2015). To sum up, this experiment allowed us to define new strategies for an experiential investigation of an ancient built space, which was made possible by combining a set of tools that so far are only available in commercial software package ESRI ArcGIS and which include vector-based LOS, multipatch 3D models and the Model Builder batch processing (Allen Citation2011). Such strategies need to be further improved and tested on a wider dataset and this will be the next goal in the frame of the Swedish Pompeii Project.
Figure 3. In ArcScene results from LOS analysis have been visualized and different maps of visibility produced. A ‘horizontal’ map shows the percentage of the fresco’s visibility from each standing point, while the ‘vertical’ map (a) illustrated the percentage of visibility associated with each portion of the fresco’s surface in relation to the sample of potential observers evenly distributed throughout the space of the house ‘’ (Landeschi et al. Citation2016a).
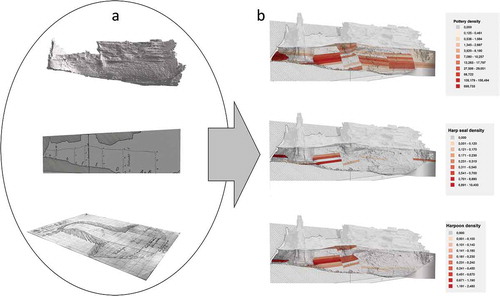
Another promising research area in 3D GIS concerns the use of volume calculation and volumetric analysis, which can be applied to a multitude of contexts ranging from a single trench to a whole landscape. The Prehistoric cave of Stora Förvar, in south-eastern Sweden, has recently been investigated through a comprehensive approach in which the original layers were digitally reconstructed in a 3D GIS, as they were excavated by archaeologists at the end of the nineteenth century, by combining information derived by the 3D model of the cave along with some legacy data retrieved from the historical archives (Landeschi et al. Citationforthcoming). Starting from hand-made drawings of each single arbitrary unit it was possible to digitize each layer so as to define its three-dimensional boundaries. This operation allowed us to calculate the volume associated with each layer, in order to define the amount of soil removed for each excavated unit. Most importantly, each volumetric value was linked to the record of artefacts retrieved throughout the sequence and it was possible to calculate density values for each category of objects brought to light during the excavation phases. This allowed archaeologists to detect patterns of presence linked to the different phases of habitation of the cave (); for example, some categories of artefacts such as pottery or harp-seal bones were important markers to determine late/post-Mesolithic-dated layers; subsequently, the portion of the original sequence presenting lower density of those classes of finds was associated with the Mesolithic phases of habitation of the cave. This piece of information was related to some historical pictures and more descriptive data that were properly georeferenced in the same space of the cave so that it was possible to compare spatially the reconstructed 3D spit units in order to better establish the boundaries of the Mesolithic portion of the sequence. This case study proved again how three-dimensionality has an indisputable value in site analytics, and the combination of volumetric analysis with more traditional hand-made documentation can allow a reinterpretation of a site and a contextualization of descriptive material.
Figure 4. Through the integration and the georeferencing of different datasets (cave 3D-boundary model, digitally scanned profile and plan drawings) it has been possible to reconstruct a volumetric model of the sequence of layers as it was excavated at the end of nineteenth century. The setup of a relational geodatabase enabled us to link each arbitrary layer to the finds as they were documented in the original excavation reports ‘’ (Landeschi et al. Citationforthcoming; ‘’ Landeschi et al. Citationforthcoming) and to make a quantitative assessment of the distribution of different classes of objects.
3.2. Where to go? The agential capability of space: a multisensory GIS?
Since the beginning of the 1990s archaeologists felt the urgency of creating more ‘humanized’ platforms to infer the way prehistoric populations or ancient peoples perceived their own space. In particular, some scholars thought of GIS as a possible means to ‘study formally perceived past environments’ (Green Citation1990, 6). As previously stated, most of the criticism of GIS’s space representation and, subsequently, data analysis, is due to an over-simplification of reality and approximation of geo-spatial phenomena (Freundschuh and Egenhofer Citation1997), given by the very limited nature of vector-primitives visualization. Still, such limitations now seem to be surmountable and more ambitious goals of data representation an achievable enterprise.
Providing more accurate data representation and a better controlled reconstruction process are necessary premises to conduct a more thorough analysis of the experiential value associated with ancient space. Any feature of the landscape can be an important indicator of a set of actions or behaviours that might have had some repercussion on the way people interact with landscape (Gibson Citation1977). The way such experience took place can be captured through the whole spectrum of the senses and this could reasonably become the way to understand the past as a complex sum of social encounters and interactions. Considering the human body as a ‘universal measurement’ (Betts Citation2017, 23) whose physiological characteristics are almost unchanged from antiquity, it makes sense to use it as a proxy for exploring the perceptual activity of past human agents. Artificial environments and digital reconstructions provide the basis to simulate sensorial perception and to map information in ways to make it easier for archaeologists to raise an interpretation (Shepherd and Bleasdale-Shepherd, p. 366).
One of the biggest challenges in digital archaeology today is to provide a dynamic picture of the landscape in which the human factor is well represented. An essential starting point is material evidence and the documented sources that allow archaeologists to build a consistent framework in which to perform simulation processes connected to the interaction between the landscape and its ancient inhabitants. Once again, the crucial aim of current GIS practitioners is to try to provide a human-focused perspective on the landscape (Lock, Kormann, and Pouncett Citation2014) in which digital methods can help in better understanding relations between humans and their surrounding environment.
Such relationships can be viewed as possibilities for action (Withagen et al. Citation2012) where certain landscape features have particular characteristics that can be observed and where their observation can make us deduce their ‘affordance’, that is, their capability of promoting a certain action. If we follow Gillings (Citation2012), Archaeological GIS should be directed towards the detection of affordances rather than just simulating or claiming to simulate ancient people’s perception. It should be focused on the possibility of detecting those features of the landscape/built space that could have fostered certain action; as an example, a wall inscription, due to its size, position on the wall’s surface, colour and texture could have afforded its sight perception and, subsequently, it could have been used to deduct a ‘buffer of presence’ within its proximity.
Still, one of the risks connected with any type of analysis focused on the sensorial perception of space conducted in GIS is to overestimate the role of sight among the senses and thus to build a biased past reality (Hacιgüzeller Citation2012). Such criticism has been widely treated by Wheatley (Citation2014), who recalls proxemics and the role of scale to define areas of ‘capture’ within which certain senses have a certain predominance, pointing out how sight and hearing will still be the only senses capable of reaching over a long distance, typically on a landscape scale, whereas smell, touch and taste are experienced on a more intimate scale.
Yet so far, not many attempts have been conducted to make geospatial technologies suitable for a multi-sensory analysis. An interesting method to explore multisensory data in a geospatial visualization system is presented by Harding and colleagues (Harding et al. Citation2002). Outputs derived from audio-visual and tactile perception of space are integrated in the same visualization space in order to provide a more thorough description of the underwater environment being investigated.
Sometimes embodiment and interaction are presented as instruments to provide a ‘realistic’ experience for a user within a virtual space being capable of affording an experience of the space as it was supposed to be in antiquity (Richards-Rissetto et al. Citation2012). In this respect, GIS and 3D GIS should provide further opportunities: the digital environment must become the place where different and complementary datasets converge and a synthesis is produced; this means mapping any sensory experience that can be relevant in the interpretation process of the place. As previously shown, in the course of recently conducted research in the house of Caecilius Iucundus in Pompeii, we tried to demonstrate how insufficient the use of visibility analysis is to get a complete picture of how the original human perception was. After analysing the visual impact of an erotic fresco located in the peristyle of the house, we realized that the effects played by solar radiance were impacting on the visual acuity of the object (Landeschi et al. Citation2016a). So, basically, just by integrating visual connection and light effects it was possible to better understand how the painting was perceived by a person standing in the peristyle. This means that the quantitative and qualitative information derived by multisensory forms of analysis can be literaly ‘mapped’ into the 3D GIS environment and employed to describe phenomena connected to the perceptual properties of a space or an object in the space. Again, the prominent role of mapping as one of the main goals of any GIS-related study must be stressed. Indeed, according to the Cambridge dictionary, ‘mapping is the activity or process of creating a picture or diagram that represents something’: a map is therefore a drawing ‘that gives you a particular kind of information about a particular area’. In a phenomenological perspective, representing the ‘sense of place’ as it was presumably experienced in the past through an embodied experience of a modern human is not as useful as it would be to use the senses as proxy to map the agential capability of the ancient space, that is, to focus on the sensory affordance exerted by a certain place or a certain object-in-the-space to quantify and qualify its intrinsic communicative properties. As demonstrated by Paliou and Knight (Citation2013), the ritual space of a medieval church constitutes a valid example to show how multiple senses are a good means to understand how participants were involved in the liturgy. They advocate for data integration between different maps of sense catchment which can describe the way one individual perceives the reality in their proxemic space through his or her sensory apparatus. What those methods can do is to quantify aspects of human perception ‘that could be indicative of social order and behaviour’.
Stuart Eve (Citation2012) again recalls the role of digital methods and GIS in conducting reproducible experiments where different variables and parameters can be tested against a starting assumption. GIS analytic tools can be employed to generate several maps of perception derived from different senses and the work he presents aims at merging together the advantage of a computer-based simulation with a situated perspective which is typical of VR environments. Although he mentions the ‘Mixed Reality’ as a possibility to overcome current limitations in GIS software representation, the point is still about combining the potential of quantitative/qualitative analysis and an effective 3D visualization, in which archaeological and environmental features are represented as ‘complex’ objects.
By complex object we can describe a digital entity represented by a relatively high number of polygons defined by points described by independent x,y,z coordinates. So far, commercial software solutions are the only ones available to effectively manage surface boundary models made up of 2–3 million polygons with a texture that can reach up to 4096 pixels. Besides having a high geometrical resolution, this kind of 3D model is part of a geodatabase in which several descriptive fields are linked to the object itself and different types of information can help in better describing it. As a consequence, this complex object provides some possible answers to issues connected to data representation and model validation. As an example, we can take into account the problem of transparency in the process of virtual reconstruction of an ancient space. To perform any type of simulation, the reliability of the dataset that has been used to build up the 3D model is essential; even more important is to state the degree of accuracy associated with the different components belonging to the final model. In a recent article Demetrescu (Citation2015) suggests the adoption of a formalized methodology to make transparent the process of the virtual reconstruction of ‘lost archaeological contexts’. This is called the Extended Matrix and provides archaeologists with the possibility to add information to each single component (or unit) created in the process of virtual reconstruction. This method allows users to ‘map’ all the choices made during the process by including sources employed by the archaeologists. A further step in this direction would be to combine the extended matrix in a 3D geodatabase in order to associate different degrees of reliability with the components employed in the reconstruction of a 3D object.
4. Future developments
As Watson has noted, recognizing the sensory qualities of places has the potential to aid us in our search to understand their uses and meanings (Watson Citation2001, 297).
GIS, no matter whether 2D or 3D, still remains a ‘visual’ means for communicating data output. Still, the data themselves can be very diverse in their nature and the ultimate scope of GIS-based analysis must always be to provide a clear way towards data interpretation. This means that not only can visually constructed data be presented, but even data which are the results of a different type of assessment. In this respect, results of an acoustic simulation or another sense-related experience might be the object of analysis and, subsequently, a final representation. What the real advantage of GIS is is to spatially integrate the data together in a way that new interpretative outputs can be derived.
It is therefore possible to forecast some possible scenarios for the development of GIS in the next few years:
(a) Improvements in fully 3D visual analysis techniques, horizontal and vertical maps, volumetric analysis and empty space assessment. In this respect, the multi-scalar nature of current 3D GIS can allow us to integrate within the same environment landscape with single-site scale analysis. Indeed, the possibility of managing million-faced 3D meshes can allow us to adapt model accuracy based on the scale of analysis without losing the connection between small and large scale. As an example, a single building in the same GIS project can either be represented as a few-faced meshed 3D model, in case the purpose is to run a line-of-sight analysis dealing with the surrounding landscape, or as a more complex, million-faced model in case the line-of-sight calculation is run to assess the visual prominence of its internal space. Both the results of such evaluation can be compared in the same environment so that it would be possible to better understand any interconnection between single site/wide landscape. Expectedly, if we take a Roman or a Greek temple, there will be valid reasons to think of it as an important landmark in the surrounding landscape, which has been deliberately built at a certain location for conveying some symbolic message (Kaiser Citation2003), but also as a single monument whose decorative apparatus was intended to visually communicate to people standing close by. 3D GIS can thus provide the opportunity to bridge the gap between different scales of representation and create an interpretative framework that can allow a better understanding of the meaning of an archaeological object as a result of this ‘dialog’ between ‘object-in-the-space’ and ‘object-as-space’. This is exactly the reason why the use of a fully 3D approach plays a key role in allowing pursuit of this specific aim. Another interesting aspect to be investigated relates to what we can define as the ‘hidden space’ of the landscape or that portion of space which is out of the field of view and is usually neglected in most archaeological research (Gillings Citation2015). Any attempt to explore the existing space between any visually relevant archaeological object can now be supported by a more sophisticated toolset that allows taking into account the volume of space. 3D volumetric visual analysis has been introduced in urban studies but might also have some valuable potential in archaeology (Fisher-Gewirtzman et al. Citation2013); it would constitute an interesting option to analyse the density of visible space and to assess those areas not visually prominent, but which still had an archaeological relevance (Gillings Citation2017).
(b) Another interesting scenario might be multi-layered representation, which can allow the implementation and the 3D mapping of sensorial stimuli other than sight. As noted by other authors (Paliou and Knight Citation2013; Frieman and Gillings Citation2007) multisensory investigation is a very scale-dependent task, which makes it very suitable in the proximate space surrounding an individual (Wheatley Citation2014), where senses like hearing, smell and touch are in catchment distance. There are indeed questions that can be addressed within the architectural space of an ancient building, especially those that had a religious or ritual significance, where a multi-sensory approach can provide a better understanding of cognitive patterns reflecting the ancient inhabitants’ mindset. Again, three-dimensionality would allow inclusion of vertical walls, curtains and furniture along with the empty space itself of the rooms that can be mapped according the sensorial affordance it can provide. This would allow us to quantitatively show perception as a dynamic action rather than a static evaluation made by a simple in sight/out of sight assessment of the space.
5. Conclusions
This contribution has sought to demonstrate some important advances that have occurred in archaeological GIS during the last few years to trace some possible paths for future research. Three-dimensionality has been explored as a heuristic dimension for improving the quality of data interpretation.
Starting from a brief review of 3D GIS and the way it was introduced in archaeology, the focus has been moved onto the way it has been recently employed to perform 3D spatial analysis in the frame of some research projects conducted at Lund University. Three main fields of enquiry let us address specific research questions: (a) 3D vector-based analysis for assessing the damage to an archaeological site affected by an action of surface erosion; (b) LOS analysis to explore quantitatively and qualitatively the symbolic significance of the domestic space in a Pompeian house; (c) reconstruction and volumetric assessment of artefact distribution throughout a Prehistoric sequence based on the combination of different types of legacy data.
The results obtained in the frame of these projects, some of which are still at a preliminary stage, demonstrate the high potential of exploring and extending these methods to a broader sample of datasets and case studies. As pointed out by several authors, sensory and phenomenological archaeology might be one of the research areas to get more benefits from such development. Given the rise in interest in building a more humanized GIS, three-dimensionality can add an important contribution in this direction. Improving the quality of data representation, consisting of an entirely 3D space, would constitute a crucial premise to add more reliability in any simulation process of the cognitive perception of space. In addition, multi-scalarity can afford the opportunity to put in comparison analysis performed both on site and landscape scales. Including the volume calculation would allow us to make a more thorough assessment of the empty or concealed space, which consists of those portions of landscape that are usually neglected in most of the scholarships. Additionally, the multi-layered nature of the GIS environment still represents a key aspect for integrating multisensory data analysis and to map and evaluate the perceptual experience of space centred on a human perspective.
There are indeed critical concerns related to the degree of approximation that unavoidably influence the process of digital reconstruction, ranging from a lack of material evidence to the complexity of factors to be modelled, which in most cases are simply unknown or unknowable (movement, light effects and so on). Still, if every model is a simplification of more complex phenomena, made to enable understanding (Lock Citation2003, 6), what we should focus on is rather the possibility of employing a more advanced simulation/analysis tool to better capture aspects of reality that might be of some interest to formulate new interpretation of a certain archaeological phenomenon. Theorizing the way three-dimensionality and GIS can open up new paths in this direction is now an essential step to be undertaken in order to define new paradigms of data representation and to build a real experiential GIS, in which the human sensorium acts as a proxy to understand the social articulation of space.
Acknowledgements
Part of this research has been funded in the frame of the ESSENCE collaborative research programme in e-science. I wish to thank the Organization committee for giving me the opportunity to conduct these studies. I would also like to thank the anonymous reviewers for their useful comments.
Additional information
Notes on contributors
Giacomo Landeschi
Giacomo Landeschi is a senior researcher in the Department of Archaeology and Ancient History at Lund University. He is an archaeologist whose main research interests lie in the field of digital archaeology with a special focus on the combination between of 3D technology and Geographical Information Systems.
References
- Aguilera, D. G., and J. G. Lahoz. 2006. “Laser Scanning or Image-Based Modeling? A Comparative through the Modelization of San Nicolas Church.” International Archives of Photogrammetry and Remote Sensing 36: B5.
- Allen, D. W. 2011. Getting to Know ArcGIS ModelBuilder. Redlands, CA: Esri Press.
- Barceló, J. A., O. De Castro, D. Travet, and O. Vicente. 2003. “A 3D Model of an Archaeological Excavation.” In The Digital Heritage of Archaeology. Computer Applications and Quantitative Methods in Archaeology, edited by M. Doerr and S. Apostolis, 85–87. Athens.
- Bernardini, W., A. Barnash, M. Kumler, and M. Wong. 2013. “Quantifying Visual Prominence in Social Landscapes.” Journal of Archaeological Science 40 (11): 3946–3954. doi:10.1016/j.jas.2013.05.019.
- Betts, E. 2017. “The Multivalence of Sensory Artefacts in the City of Rome.” In Senses of the Empire: Multisensory Approaches to Roman Culture, edited by E. Betts, 23–38, Oxford: Taylor & Francis.
- Bezzi, A., L. Bezzi, D. Francisci, and R. Gietl. 2006. “L’utilizzo Di Voxel in Campo Archeologico.” Geomatic Workbooks 6: 2006.
- Callieri, M., N. Dell’Unto, M. Dellepiane, R. Scopigno, B. Soderberg, and L. Larsson. 2011. “Documentation and Interpretation of an Archeological Excavation: An Experience with Dense Stereo Reconstruction Tools.” In VAST, edited by F. Niccolucci, M. Dellepiane, S. P. Serna, H. Rushmeier, and L. Van Gool. 33–40. The Eurographics Association Publisher.
- Campana, S. 2014. “1.1 3D Modeling in Archaeology and Cultural Heritage–Theory and Best Practice.” In 3D Recording and Modelling in Archaeology and Cultural Heritage, edited by F. Remondino, & S. Campana, 7. Oxford: BAR International Series.
- Campanaro, D. M., G. Landeschi, N. Dell’Unto, and A.-M. Leander Touati. 2015. “3D GIS for Cultural Heritage Restoration: A ‘White Box’ Workflow.” Journal of Cultural Heritage 18: 321–332. Elsevier. doi:10.1016/j.culher.2015.09.006.
- Cardaci, A., and A. Versaci. 2013. “Image-Based 3d Modeling Vs Laser Scanning for the Analysis of Medieval Architecture: The Case of St. Croce Church in Bergamo.” International Archives Of The Photogrammetry, Remote Sensing And Spatial Information Sciences 40: 155–160. doi:10.5194/isprsarchives-XL-5-W2-155-2013.
- Conolly, J., and M. Lake. 2006. Geographical Information Systems in Archaeology. New York, NY: Cambridge University Press.
- De Reu, J., G. Plets, G. Verhoeven, P. De Smedt, M. Bats, B. Cherretté, W. De Maeyer, et al. 2013. “Towards a Three-Dimensional Cost-Effective Registration of the Archaeological Heritage.” Journal of Archaeological Science 40 (2): 1108–1121. doi:10.1016/j.jas.2012.08.040.
- De Reu, J., P. De Smedt, D. Herremans, M. Van Meirvenne, P. Laloo, and W. De Clercq. 2014. “On Introducing an Image-based 3d Reconstruction Method in Archaeological Excavation Practice.” Journal of Archaeological Science 41: 251–262. doi:10.1016/j.jas.2013.08.020.
- Dell’Unto, N., A.-M. Leander Touati, D. Ferdani, M. Dellepiane, M. Callieri, and S. Lindgren. 2013. “Digital Reconstruction and Visualization in Archaeology Case-Study Drawn from the Work of the Swedish Pompeii Project.” In 2013 Digital Heritage International Congress, edited by A. C. Addison, G. Guidi, L. De Luca, and S. Pescarin, 621–628, Piscataway, NJ: IEEE–Institute of Electrical and Electronics Engineers.
- Dell’Unto, N., G. Landeschi, A.-M. Leander Touati, M. Dellepiane, M. Callieri, and D. Ferdani. 2015. “Experiencing Ancient Buildings from A 3D GIS Perspective: A Case Drawn from the Swedish Pompeii Project.” Journal of Archaeological Method and Theory 23: 73–94. Plenum Press. doi:10.1007/s10816-014-9226-7.
- Dell’Unto, N. 2014. “The Use of 3D Models for Intra-Site Investigation in Archaeology.” In 3D Recording and Modeling in Archaeology and Cultural Heritage, edited by S. Campana and F. Remondino. Oxford: Archaeopress.
- Dellepiane, M., N. Dell’Unto, M. Callieri, S. Lindgren, and R. Scopigno. 2013. “Archeological Excavation Monitoring Using Dense Stereo Matching Techniques.” Journal of Cultural Heritage 14: 201–210. Elsevier. doi:10.1016/j.culher.2012.01.011.
- Demetrescu, E. 2015. “Archaeological Stratigraphy as a Formal Language for Virtual Reconstruction. Theory and Practice.” Journal of Archaeological Science 57: 42–55. doi:10.1016/j.jas.2015.02.004.
- Earl, G. P. 2007. De/Construction Sites: Romans and the Digital Playground. EVA Conferences International.
- ESRI 2012. “The Multipatch Geometry Type - an ESRI White Paper” December 2008. Accessed 25 July 2017. http://www.esri.com/library/whitepapers/pdfs/multipatch-geometry-type.pdf
- Eve, S. 2012. “Augmenting Phenomenology: Using Augmented Reality to Aid Archaeological Phenomenology in the Landscape.” Journal of Archaeological Method and Theory 19 (4): 582–600. doi:10.1007/s10816-012-9142-7.
- Fassi, F., L. Fregonese, S. Ackermann, and V. De Troia. 2013. “Comparison between Laser Scanning and Automated 3D Modelling Techniques to Reconstruct Complex and Extensive Cultural Heritage Areas.” International Archives of the Photogrammetry, Remote Sensing and Spatial Information Sciences 5: W1.
- Faust, N. L. 1995. “The Virtual Reality of GIS.” Environment and Planning B: Planning and Design 22 (3): 257–268. doi:10.1068/b220257.
- Fisher-Gewirtzman, D., A. Shashkov, and Y. Doytsher. 2013. “Voxel Based Volumetric Visibility Analysis of Urban Environments.” Survey Review 45 (333): 451–461. doi:10.1179/1752270613Y.0000000059.
- Forte, M. 2003. “Mindscape: Ecological Thinking, Cyber-Anthropology and Virtual Archaeological Landscapes.” BAR International Series 1151: 95–108.
- Forte, M., and A. Siliotti. 1997. Virtual Archaeology: Re-Creating Ancient Worlds. New York, NY: HN Abrams.
- Freundschuh, S. M., and M. J. Egenhofer. 1997. “Human Conceptions of Spaces: Implications for GIS.” Transactions in GIS 2 (4): 361–375. doi:10.1111/tgis.1997.2.issue-4.
- Frieman, C., and M. Gillings. 2007. “Seeing Is Perceiving?” World Archaeology 39 (1): 4–16. doi:10.1080/00438240601133816.
- Gibson, J. J. 1977. “Perceiving, Acting, and Knowing: Toward an Ecological Psychology.” The Theory of Affordances, edited by R. Shaw, J. Bransford, 67–82. New York, NY: Lawrence Erlbaum Associates.
- Gillings, M. 2012. “Landscape Phenomenology, GIS and the Role of Affordance.” Journal of Archaeological Method and Theory 19 (4): 601–611. doi:10.1007/s10816-012-9137-4.
- Gillings, M. 2015. “Mapping Invisibility: GIS Approaches to the Analysis of Hiding and Seclusion.” Journal of Archaeological Science 62: 1–14. doi:10.1016/j.jas.2015.06.015.
- Gillings, M. 2017. “Mapping Liminality: Critical Frameworks for the GIS-based Modelling of Visibility.” Journal of Archaeological Science 84: pp.121–128. doi:10.1016/j.jas.2017.05.004.
- Gillings, M., and G. T. Goodrick. 1996. “Sensuous and Reflexive GIS: Exploring Visualisation and VRML.” Internet Archaeology 1 (1).
- Gowlett, J. A. J. 1997. “High Definition Archaeology: Ideas and Evaluation.” World Archaeology 29 (2): 152–171. doi:10.1080/00438243.1997.9980371.
- Green, S. W. 1990. “Approaching Archaeological Space: An Introduction to the Volume.” In Interpreting Space: GIS and Archaeology, edited by K. M. S. Allen, S. W. Green, and E. B. W. Zubrow, 3–8. Abingdon: Taylor & Francis.
- Hacιgüzeller, P. 2012. “GIS, Critique, Representation and Beyond.” Journal of Social Archaeology 12 (2): 245–263. doi:10.1177/1469605312439139.
- Harding, C., I. A. Kakadiaris, J. F. Casey, and R. Bowen Loftin. 2002. “A Multi-Sensory System for the Investigation of Geoscientific Data.” Computers & Graphics 26 (2): 259–269. doi:10.1016/S0097-8493(02)00057-2.
- Harris, T. M., and G. Lock. 1995. ““Toward an Evaluation of GIS in European Archaeology: The Past, Present and Future of Theory and Applications.” In Archaeology and Geographical Information Systems: A European Perspective, Edited by G. R. Lock and G. Stancic, 349–365. London: Taylor and Francis.
- Kaiser, A. E. 2003. “The Application of GIS Viewshed Analysis to Roman Urban Studies: The Case-Study of Empúries, Spain.” Internet Archaeology 14: 106–121.
- Katsianis, M., S. Tsipidis, K. Kotsakis, and A. Kousoulakou. 2008. “A 3D Digital Workflow for Archaeological Intra-Site Research Using GIS.” Journal of Archaeological Science 35 (3): 655–667. doi:10.1016/j.jas.2007.06.002.
- Kvamme, K. L. 1999. “Recent Directions and Developments in Geographical Information Systems.” Journal of Archaeological Research 7 (2): 153–201. doi:10.1007/BF02446276.
- Lake, M. W., P. E. Woodman, and S. J. Mithen. 1998. “Tailoring GIS Software for Archaeological Applications: An Example Concerning Viewshed Analysis.” Journal of Archaeological Science 25 (1): 27–38. doi:10.1006/jasc.1997.0197.
- Landeschi, G., B. Nilsson, and N. Dell’Unto. 2016b. “Assessing the Damage of an Archaeological Site: New Contributions from the Combination of Image-Based 3D Modelling Techniques and GIS.” Journal of Archaeological Science: Reports 10: 431–440. Elsevier. doi:10.1016/j.jasrep.2016.11.012.
- Landeschi, G., J. Apel, S. Lindgren, and N. Dell’Unto. forthcoming. “An Exploratory Use of 3D for Investigating a Prehistoric Stratigraphic Sequence.” Proceedings of the 44th Computer Applications and Quantitative Methods in Archaeology Conference, CAA 2016 Oslo, 29 March—2 April 2016.
- Landeschi, G., J. Apel, V. Lundström, J. Storå, S. Lindgren, and N. Dell’Unto. forthcoming. Re-Enacting the Sequence: Combined Digital Methods to Study a Prehistoric Cave.
- Landeschi, G., N. Dell’Unto, D. Ferdani, A. M. Leander Touati, and S. Lindgren. 2015. “Enhanced 3D-GIS: Documenting Insula V 1 in Pompeii.” In Proceedings of the 42nd Annual Conference on Computer Applications and Quantitative Methods in Archaeology, edited by F. Giligny, F. Djindjian, L. Costa, P. Moscati, and S. Robert, 349–360. Oxford: Archaeopress.
- Landeschi, G., N. Dell’Unto, K. Lundqvist, D. Ferdani, D. M. Campanaro, and A.-M. Leander Touati. 2016a. “3D-GIS as a Platform for Visual Analysis: Investigating a Pompeian House.” Journal of Archaeological Science 65: 103–113. Academic Press. doi:10.1016/j.jas.2015.11.002.
- Lieberwirth, U. 2008. “Voxel-Based 3D GIS: Modelling and Analysis of Archaeological Stratigraphy.” In Beyond Illustration: 2D and 3D Digital Technologies as Tools for Discovery in Archaeology, edited by B. Frischer and A. Dakouri-Hild, 85–94. Oxford: Archaeopress.
- Llobera, M. 1996. “Exploring the Topography of Mind: GIS, Social Space and Archaeology.” Antiquity 70 (269): 612–622. doi:10.1017/S0003598X00083745.
- Llobera, M. 2012. “Life on a Pixel: Challenges in the Development of Digital Methods within an “Interpretive” Landscape Archaeology Framework.” Journal of Archaeological Method and Theory 19 (4): 495–509. doi:10.1007/s10816-012-9139-2.
- Lock, G. 2001. “Theorising the Practice or Practicing the Theory: Archaeology and GIS.” Archaeologia Polona 39: 153–164.
- Lock, G. 2003. Using Computers in Archaeology: Towards Virtual Pasts. London: Routledge.
- Lock, G., M. Kormann, and J. Pouncett. 2014. ““Visibility and Movement: Towards a GIS-based Integrated Approach.” In Computational Approaches to the Study of Movement in Archaeology: Theory, Practice and Interpretation of Factors and Effects of Long Term Landscape Formation and Transformation, edited by S. Polla and P. Verhagen, 23–42. Boston, MA: De Gruyter.
- Lock, G., and T. Harris. 1997. “Analysing Change through Time within a Cultural Landscape: Conceptual and Functional Limitations of a GIS Approach.” In Urban Origins in Eastern Africa. World Archaeological Congress, One World series. London: Routledge.
- Lock, G. R., and G. Stancic. 1995. Archaeology and Geographic Information Systems: A European Perspective. Oxford: CRC Press.
- Loots, L. 1997. “The Use of Projective and Reflective Viewsheds in the Analysis of the Hellenistic City Defence System at Sagalassos, Turkey.” Archaeological Computing Newsletter 49: 12–16.
- Losier, L. M., J. Pouliot, and M. Fortin. 2007. “3D Geometrical Modeling of Excavation Units at the Archaeological Site of Tell ‘Acharneh (Syria).” Journal of Archaeological Science 34 (2): 272–288. doi:10.1016/j.jas.2006.05.008.
- Merlo, S. 2004. “The “Contemporary Mind”. 3D GIS as a Challenge in Excavation Practice.” In Enter the Past. The E-Way into the Four Dimensions of Cultural Heritage, Computer Applications and Quantitative Methods in Archaeology (CAA 2003), edited by K. F. Ausserer, W. Börner, M. Goriany, and L. Karlhuber-Vöckl, 276–280. Vol. 1227. Oxford: L. Archaeopress.
- Ogburn, D. E. 2006. “Assessing the Level of Visibility of Cultural Objects in past Landscapes.” Journal of Archaeological Science 33 (3): 405–413. doi:10.1016/j.jas.2005.08.005.
- Opitz, R. 2017. “An Experiment in Using Visual Attention Metrics to Think about Experience and Design Choices in past Places.” Journal of Archaeological Method and Theory 24 (4): 1203–1226. doi:10.1007/s10816-016-9310-2.
- Opitz, R., and J. Nowlin. 2012. “Photogrammetric Modeling+ GIS: Better Methods for Working with Mesh Data.” ArcUser Spring 2012: 46–49.
- Paliou, E. 2011. “The Communicative Potential of Theran Murals in Late Bronze Age Akrotiri: Applying Viewshed Analysis in 3D Townscapes.” Oxford Journal of Archaeology 30 (3): 247–272. doi:10.1111/j.1468-0092.2011.00368.x.
- Paliou, E. 2013. “Reconsidering the Concept of Visualscapes: Recent Advances in Three-Dimensional Visibility Analysis.” In Computational Approaches to Archaeological Spaces, edited by A. Bevan and M. Lake, 243–264. Walnut Creek: Left Coast Press.
- Paliou, E., D. Wheatley, and G. P. Earl. 2011. “Three-Dimensional Visibility Analysis of Architectural Spaces: Iconography and Visibility of the Wall Paintings of Xeste 3 (Late Bronze Age Akrotiri).” Journal of Archaeological Science 38: 375–386. doi:10.1016/j.jas.2010.09.016.
- Paliou, E., and D. J. Knight. 2013. “Mapping the Senses: Perceptual and Social Aspects of Late Antique Liturgy in San Vitale, Ravenna.” In the Proceedings of CAA 2010, Computer Applications and Quantitative methods in Archaeology, International Conference, Granada 6-9 April, 2010, pp. 229–236.
- Papadopoulos, C., and G. Earl. 2014. “Formal Three-Dimensional Computational Analyses of Archaeological Spaces.” In Spatial Analysis and Social Spaces: Interdisciplinary Approaches to the Interpretation Prehistoric and Historic Built Environments, edited by E. Paliou, U. Lieberwirth, and S. Polla, 135–165. Berlin: De Gruyter.
- Papadopoulos, C., Y. Hamilakis, and N. Kyparissi-Apostolika. 2015. “Light in a Neolithic Dwelling: Building 1 at Koutroulou Magoula (Greece).” Antiquity 89 (347): 1034–1050. doi:10.15184/aqy.2015.53.
- Rahman, A. A., M. Pilouk, and S. Zlatanova. 2001. “The 3D GIS Software Development: Global Efforts from Researchers and Vendors.” Geoinformation Science Journal 1 (13).
- Reilly, P. 1990. “Towards a Virtual Archaeology.” In Computer Applications in Archaeology, edited by K. Lockyear and S. Rahtz, 133–139. Oxford: British Archaeological Reports.
- Richards-Rissetto, H. 2017. “What Can GIS+ 3D Mean for Landscape Archaeology?” Journal of Archaeological Science 84: 10–21. doi:10.1016/j.jas.2017.05.005.
- Richards-Rissetto, H., F. Remondino, G. Agugiaro, J. Von Schwerin, J. Robertsson, and G. Girardi, 2012, September. Kinect and 3D GIS in Archaeology. In Virtual Systems and Multimedia (VSMM), 2012 18th International Conference on (pp. 331–337). IEEE.
- Smith, G., and J. Friedman. 2004. A Technology Whose Time Has Come. Littleton, CO: Earth Observation Magazine.
- Tilley, C. 1994. A Phenomenology of Landscape: Places, Paths, and Monuments. Vol. 10. Oxford: Berg.
- Van Leusen, M. 1999. “Viewshed and Cost Surface Analysis Using GIS (Cartographic Modelling in a Cell-Based GIS II).” BAR International Series 757: 215–224.
- Watson, A. 2001. “The Sounds of Transformation: Acoustics, Monuments and Ritual in the British Neolithic.” In The Archaeology of Shamanism, edited by N. Price, 178–192. London: Routledge.
- Wheatley, D. 2014. “Connecting Landscapes with Built Environments: Visibility Analysis, Scale and the Senses.” In Spatial Analysis and Social Spaces: Interdisciplinary Approaches to the Interpretation of Prehistoric and Historic Built Environments, edited by E. Paliou, U. Lieberwirth, and S. Polla, 18, Berlin: Topoi Berlin Studies of the Ancient World.
- Wheatley, D. 1995. “Cumulative Viewshed Analysis: A GIS-based Method for Investigating Intervisibility, and Its Archaeological Application.” In Archaeology and Geographical Information Systems: A European Perspective, edited by G. Lock and Z. Stancic, 171–185. London: Taylor & Francis.
- Wheatley, D., and M. Gillings. 2000. “Vision, Perception and GIS: Developing Enriched Approaches to the Study of Archaeological Visibility.” Nato Asi Series a Life Sciences 321: 1–27.
- Wheatley, D., and M. Gillings. 2003. Spatial Technology and Archaeology: The Archaeological Applications of GIS. New York, NY: CRC Press.
- Withagen, R., H. J. de Poel, D. Araújo, and G. J. Pepping. 2012. “Affordances Can Invite Behavior: Reconsidering the Relationship between Affordances and Agency.” New Ideas in Psychology 30 (2): 250–258. doi:10.1016/j.newideapsych.2011.12.003.