
 ?Mathematical formulae have been encoded as MathML and are displayed in this HTML version using MathJax in order to improve their display. Uncheck the box to turn MathJax off. This feature requires Javascript. Click on a formula to zoom.
ABSTRACT
Andrew Sherratt’s ‘Water, soil and seasonality’, World Archaeology (1980), signposted a long-term debate surrounding early farming adaptations to riverine landscapes in western Asia and Europe. Recent research at Çatalhöyük in central Anatolia, a key case study in Sherratt’s ‘floodplain cultivation’ model, enables integrated, evidence-based assessment of the local hydrology and agroecology, and of farmers’ resilience over more than a millennium. In contrast to previous models, the agroecological niche at Çatalhöyük featured strategic planting of diverse crops across a range of hydrological conditions, within and beyond a broad ‘belt’ of small anastomosing river channels extending a kilometre from the site. Growing conditions likely depended on location relative to settlement, a nutrient-rich ‘hot spot’, with diminishing inputs of organic matter and mechanical disturbance away from the tell. This reconstruction contrasts with the original model of ‘floodplain cultivation’ and demonstrates the complexity with which agroecologies evolved through landscape affordances, creative cropping, and resilience.
1. Introduction
Andrew Sherratt’s ‘Water, soil and seasonality’, published 42 years ago in World Archaeology, signposted a long-term debate surrounding early farming adaptations to riverine landscapes and alluvial settings in western Asia and Europe (Sherratt Citation1980). According to this model, early agriculturalists focussed on alluvial floodplains and relict lakes where periodic flooding and silt deposition fostered naturally high soil fertility and disturbance in a system of ‘floodplain’ or ‘floodwater’ agriculture (Vita-Finzi Citation1969 citing Bryan 1929). This regime necessitated spring sowing, while relatively low investment (little to no tillage, weeding, or fertilisation) was required to enable sufficient productivity (Sherratt Citation1980, 318). In this context, Neolithic settlement was restricted to these wet areas and hydromorphic soils where low-input agriculture could be practiced. It was assumed that by the Bronze Age, with the refinement of agricultural practice and technological developments such as the ard, agriculture was possible in less naturally favourable locales (Sherratt Citation1980, Citation1981).
Despite radically different views of early farming regimes in western Eurasia as involving high labour inputs, emerging around the same time as Sherratt’s model (Halstead Citation1981; see also Bogaard Citation2005), many authors continued to accept floodplain cultivation as a ‘best-fit’ for Neolithic settlement patterns (see Isaakidou Citation2011 and references therein). The Neolithic site of Çatalhöyük (), one of the key early agricultural sites referred to by Sherratt (Citation1980), represents an excellent case study thanks to decades of high-resolution excavation and interdisciplinary study (e.g. Charles et al. Citation2014; Hodder Citation2021). Located on the floodplain of the Çarşamba River in the Konya Plain, site occupation is documented in the following continuous phases: Early (7100–6700 BCE), Middle (6700–6500 BCE), Late (6500–6300 BCE), and Final (6300–5950 BCE) (Hodder Citation2021). Recent excavation has focused on two main areas: one on the northern eminence of the mound called the North Area and another located on the SW edge of the southern eminence known as the South Area. During the period of occupation of the site the western Konya Plain witnessed considerable change in settlement pattern, with an initial abandonment of many of the other sites in the region (Baird Citation2006, Citation2010) prior to (re-)establishment of settlements in the late seventh millennium BCE (Baird Citation2006).
Figure 1. Location map. The outlined area in pale blue is the best estimate of the River Çarşamba catchment area producing flow to the area of the site in the Neolithic (see Wainwright and Ayala Citation2021] for details).
![Figure 1. Location map. The outlined area in pale blue is the best estimate of the River Çarşamba catchment area producing flow to the area of the site in the Neolithic (see Wainwright and Ayala Citation2021] for details).](/cms/asset/a60845b8-f00c-446c-9b73-a77ecdd47250/rwar_a_2125058_f0001_oc.jpg)
We contribute to this archaeological debate about Neolithic settlement and agricultural practice by presenting an alternative land-use model developed for Çatalhöyük through the integration of the results of high-resolution geoarchaeological (Ayala et al. Citation2017, Citation2021; Wainwright and Ayala Citation2021) and archaeobotanical datasets (Bogaard et al. Citation2017, Citation2021). Our aim here is to assess how Çatalhöyük cultivators achieved resilience in a dynamic landscape over the period of Neolithic occupation, especially as it is one that remained marginal for rainfed agriculture. We use high-resolution palaeoenvironmental and palaeohydrological reconstructions to contextualize the archaeobotanical data from the site to understand how and where crops were grown, and how the agroecological niche varied spatially and over time.
2. Background
Palaeoenvironmental reconstruction based on a programme of high-resolution sediment coring in the vicinity of the site (Ayala et al. Citation2017, Citation2021; Ayala and Wainwright Citation2020) demonstrates that the Çarşamba River during the period of occupation was an anastomosing river with an extensive channel belt. This form of anastomosing system would have occupied a wide stretch of the low floodplain, comprised of multiple, small, silty channels of varying depths that would have had intervening higher, drier ground in between the connecting braided channels (). The flooding regime of such a dominant feature of the immediate environment would have had major consequences for the daily lives and subsistence practices of the site’s occupants. Previous geoarchaeological studies both in the direct vicinity of the site, as well as further away on the Konya Plain, interpreted the Çarşamba River as having a main channel which was subject to significant seasonal flooding, creating a very marshy environment or ‘backswamp’ on the alluvial plain during the occupation of the site (Roberts et al. Citation1999; Boyer,Citation1999: 63; Boyer et al. Citation2006, Citation2007: 684; Roberts and Rosen, Citation2009). Land-use models based on this previous environmental interpretation (Fairbairn Citation2005; Roberts and Rosen, Citation2009) suggested that the marshy conditions of the Neolithic phases of the site would have forced the practice of arable agriculture up into the well-drained foothills (13+ km away from site) (see also Rosen and Roberts, Citation2005). Wainwright and Ayala (Citation2021) suggested that the extent and frequency of flooding was less than had previously been thought: the annual variability and flooding regime suggested that only around two in three years would have experienced flooding. Furthermore, its timing was more spread out through the winter and spring months, combined with revised interpretation of a wide anastomosing channel belt, flooding would have also been only in situations where discharge could not be dispersed between the various channels.
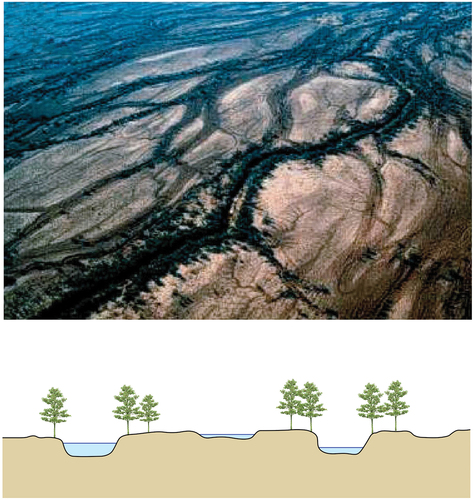
Figure 2. Image of a dryland anastomosing channel (from North, Nanson, and Fagan Citation2007) and a typical cross section, showing multiple channel threads, “islands” and riparian vegetation. The photograph is of Copper Creek, Queensland, Australia, with a similar mean annual rainfall to the Konya Plain, albeit with higher mean annual temperatures.
Large-scale archaeobotanical sampling, recovery, and analysis has enabled a detailed reconstruction of cropping practices over more than a millennium of East Mound occupation, and scope to investigate how crop and plant usage varied spatially across the community (Bogaard et al. Citation2017, Citation2021). This work proposed that the long-term resilience of the community was based on three factors: 1) a diverse initial crop spectrum, which acted as an archive for later innovations; 2) its modular social structure, enabling small-scale experimentation and innovation in cropping at the household level; and 3) its agglomerated social morphology, allowing successful developments to be scaled up across the wider community. Here we consider the site’s ecological setting as a fourth consideration. As relevant background we provide a brief overview of plant-related subsistence practice (Bogaard et al. Citation2017, Citation2021), complemented by stable carbon and nitrogen isotope work on charred crop material (Wallace et al. Citation2015; Vaiglova Citation2016; Stroud et al. Citation2021; Vaiglova et al. in prep) as direct evidence of crop-growing conditions. The farming community was established with a diverse range of cereals (the glume wheats, einkorn, emmer and Timopheev’s wheat; bread wheat; two- and six-row naked barley) and pulses (pea, lentil, bitter vetch, grass pea, chickpea), alongside exploitation of wild mustard as an oil-seed ‘crop’ and a suite of collected fruits and nuts. Preferences across the crop spectrum shifted over time. Six-row naked barley, favoured in the Early Neolithic sequence, was virtually replaced by the two-row form of naked barley in the Middle Neolithic sequence. This shift was plausibly the result of selection for barley with greater drought tolerance: modern two-row barley has greater water-use efficiency than six-row barley, while the earlier ripening of barley compared with wheat enables it to avoid the worst of the summer drought. Stable carbon isotope analysis of grain suggests that barley tended to be grown under drier conditions than wheat and pulses. As far as current correlations of excavated Levels allow, the six- to two-row barley shift appears simultaneous in the North and South Areas. Other shifts appear earlier in the North or South, suggesting that these submounds were to some extent distinct agricultural communities of practice. Thus, emmer as the major glume wheat of the Early Neolithic sequence is largely replaced by Timopheev’s wheat initially in the North Area, and subsequently in the South. Conversely, a shift from lentil to pea occurs earlier in the South area. In both of these shifts the stable isotope data show that the newly preferred crops were grown under similar conditions and so were not favoured for an obvious environmental reason; other motivations include taste/culinary properties and, in the case of Timopheev’s wheat, a potential to resist crop disease (Badaeva et al. Citation2021).
The wild plants identified as arable weeds accompanying harvested crops are clearly dominated by annuals and perennials of disturbed habitats that regenerate vegetatively (Bogaard et al. Citation2013; Filipović Citation2014). The implication is that fields were long-established and reasonably well-tilled. Moreover, and in direct contrast to Sherratt’s model of spring-sown crops following flood recession, work by Fairbairn et al. (Citation2002, Citation2005) suggested that crops were primarily autumn-sown based on the seasonality of weed germination time. Autumn sowing was also supported by subsequent work using weed flowering timing and duration to estimate local germination time (Filipović Citation2014). Thus, while some spring sowing cannot be ruled out, the routine presence of autumn-germinating arable weeds suggests that autumn sowing was widespread.
Crop-growing conditions clearly varied, as high variability in stable carbon and nitrogen isotope values show (Wallace et al. Citation2015; Vaiglova Citation2016; Stroud, Bogaard, and Charles Citation2021; Vaiglova et al. in prep). Spatial variability in the landscape is supported more broadly by other palaeoenvironmental information; Wolfhagen et al. (Citation2020, Citation2021), for example, emphasize the importance of wet and dry niches in the landscape. Despite this variability, however, there is a certain coherence to Çatalhöyük’s agroecological regime. Comparison of the weed flora present in crop storage concentrations, preserved in burned buildings of the Middle-Late Levels, with modern weed flora developed under low- and high-input conditions shows that fields tended to be relatively intensively managed, maintaining elevated levels of soil fertility and disturbance (Green et al. Citation2018). There is a range of variation in intensity that does not map clearly onto crop species but rather may relate instead to varying distances between fields and the settlement. There are also indications that neighbouring or nearby buildings shared particular similarities in weed flora composition and growing conditions. These observations are consistent with the extension of ‘radial’ settlement sectors into the wider landscape, ensuring that houses and neighbourhoods had equitable access to relatively close and distant cultivation plots (Bogaard et al. Citation2021).
A relatively intensive, albeit variable agroecological regime would be consistent with local cultivation extending outwards from the settlement edge. Strontium isotope analysis of charred crops, together with strontium and oxygen analysis of sheep tooth enamel (Henton Citation2012; Bogaard et al. Citation2014; Styring et al. Citation2019), similarly suggests that agropastoral activity was focused on the surrounding plain. This pattern is in stark contrast to the model previously hypothesised by Roberts and Rosen (Citation2009) in which the regular flooding of the area around the site for several months a year excluded local cultivation and herding, pushing these activities onto the Neogene limestone terraces 13+ km to the south.
3. Methods
We have modelled the palaeohydrology of the Çarşamba River in order to reconstruct potential landscape affordances for agriculture during the Neolithic. A modelling-based approach is necessary because (a) the nature of the sedimentation in the Neolithic means that there is no direct proxy of contemporary hydrological variability at the site; (b) available climate proxies are at some distance from the site and thus need to be calibrated to account for spatial variability; (c) the catchment of the Çarşamba has a complex response to climate; and (d) the modern catchment is highly modified so that measured flows are meaningless in relation to past conditions. Throughout the modelling process we have accounted for uncertainties in data and propagated them through climate and flow models in order to understand the potential for those uncertainties to affect our interpretations. In the first instance, we reconstructed climate (Wainwright and Ayala Citation2019), specifically focussing on precipitation and temperature in order to undertake palaeohydrological modelling of the flooding regime (Wainwright and Ayala Citation2021) and water-table variability. Once patterns of water availability were established, we investigated the locations in the vicinity of the tell which could potentially support crops.
3.1. Climate scenarios
Here, we begin by revisiting the different lines of evidence to re-evaluate the models previously proposed. Wainwright and Ayala (Citation2021) used isotope proxy data from Turkey and the Levant to estimate likely climate scenarios for Neolithic Çatalhöyük. Modern precipitation and temperature data were used to parameterize a stochastic weather generator used to generate daily time series for the different scenarios. Multiple replicates of these time series were generated and the resulting monthly mean temperatures and precipitation totals are presented here, plotted as climatograms to provide an approximate estimate of water deficits. The scenarios created reflect the potential variability and uncertainty of palaeoclimate reconstructions rather than changes at specific points in time (see also the discussion in Wainwright and Ayala Citation2019), and propagated uncertainties shown in the figures presented here.
3.2. Hydrological modelling: from flooding to water table
The stochastic time series were used by Wainwright and Ayala (Citation2021) as inputs to the HEC-HMS rainfall-runoff model to estimate flows arriving into the Konya basin just upstream of Çatalhöyük. Since the 16th century CE and especially in the 20th century, the River Çarşamba has been heavily modified; this modelling approach was necessary to analyze the changing seasonal patterns of river flow because of the lack of modern analogues. Simple assumptions of the past channel geometry were used to estimate the timing and frequency of flooding as the specific form of the Neolithic channel cannot be estimated from the sedimentary data. Further scenarios were also simulated using assumptions about changing catchment vegetation cover based on the analysis of palaeoenvironmental data in Ayala and Wainwright (Citation2020).
Here, we take the outputs from the flow model as inputs into a simple two-dimensional model of groundwater flow to estimate the impacts of the flow regime on the water table in the area surrounding the channel belt. The Boussinesq approximation to saturated flow is used following the approach of Baird (Citation1999, Citation2004, Citation1998). This approach requires estimation of the saturated hydraulic conductivity and specific yield of the sediment, as well as estimates of the depth of flow in the channel and amounts of overbank flooding. A cross-section through the floodplain was simulated with 10-m cell sizes over a distance of 3 km. As the next major channel would be at least a similar distance in the other direction, no inflows were assumed to occur across this boundary. We assumed a simple rectangular channel cross section with a bankfull depth of 0.21 m and depth to the impeding horizon of 1.21 m. This depth represents the depth to the top of the marl deposited in the Palaeolake Konya in the Pleistocene. Variabilities in this depth were ignored, as were variations in the channel-belt sediment, as we are only attempting to represent the macroscopic behaviour of the system rather than the detail of spatial variability. The high level of uncertainty in representation of spatial variability would likely overwhelm the meaning of any results produced. The channel-belt sediment is dominated by silty clay (Ayala et al. Citation2017) and values for the saturated hydraulic conductivity and specific yield were estimated using Domenico and Schwartz (Citation1990). Simulations are based on 30-year flow series, and the spatio-temporal variability of the water-table depth is represented using monthly boxplots, which include the propagation of the uncertainty from the climate and flow models.
3.3. Evaluation of the area of potential agricultural activity
To estimate the area potentially used for cultivation surrounding the site, a least-cost approach was used. Least-cost analysis investigates the effort required of travelling through a landscape through the analysis of that landscape’s characteristics (e.g. topography or natural obstacles) and here helps define the area that would likely have been prioritised for arable agriculture. The 30-m SRTM DTM dataset (NASA JPL Citation2014) was used to represent the topography surrounding the site, and the edge of the East Mound was digitized and used as starting points for movement. To calculate travel times, we modified Alberti’s (Citation2021) movecost package in R (R Core Team Citation2021) to allow for the resistance of different types of terrain to movement. In this case, we digitized the likely location of the channel belt based on the reconstruction in Ayala et al. (Citation2021) and made a simple assumption that travel across the channel belt would take twice as long as travel over open terrain due to the water and riparian vegetation. During the wetter parts of the year, this difference is likely to be an underestimate. Travel times were estimated using the Tobler off-track hiking function. Thresholds for travel times of 0.5 h and 2 h for intensive and extensive agriculture were based on well-established examples (Chisholm, Citation1962; Vita Finzi and Higgs Citation1970; Vita Finzi Citation1978; Jarman et al. Citation1982). Our approach is based on a possibilist perspective to evaluate whether in the first instance these distances could provide a sufficient area for cultivation given updated estimates of the site population. Although it is entirely conceivable that social or cultural practices led to cultivation outside these zones, we have no evidence at present that they did.
3.4. The crop growing environment of the greater Konya Basin
Crop production on the Great Konya Basin (GKB) today is almost entirely dependent on mechanized irrigation, with water travelling along a series of artificial channels. Information on dry-farmed crop production on the Great Konya Plain comes from studies carried out in the 20th century CE, primarily by European crop scientists or irrigation engineers, usually conducted as part of irrigation developments (e.g. studies summarized by de Meester Citation1970). Based on these studies it is possible to establish the crop-growing cycle and key environmental factors determining successful crop cultivation in the area away from the modern irrigated system. Based on this foundation, the implications of the re-modelling of climate and river hydrology can be assessed.
The climate and precipitation parameters of Çatalhöyük and the River Çarşamba region have been described in detail by Wainwright and Ayala (Citation2021). The GBK is one of the driest parts of Turkey, with the current climate listed as hot arid steppe (BSh) in the Köppen-Geiger classification. Like much of Western Asia summer temperatures are high, with temperatures averaging 15°C from May to September and routinely exceeding 30°C in the daytime, but the region’s high altitude means that in winter, temperatures are more continental, below 5°C from December to March. Frosts can be severe, with night-time temperatures of −25°C not infrequent.
The modern (1961–1990) climate at Çatalhöyük based on the CRU-TS 4 reconstruction (Harris et al. Citation2020) has mean monthly rainfall between 33 and 49 mm from October to May, dropping to 22 mm in June, and is below 9 mm from July to September (). Mean temperature is at a minimum of 0.2°C in January and is above 21°C in July and August. The period of water deficit lasts from mid-May to mid-September. Flood flows would peak in April and May and reach a minimum in September (Wainwright and Ayala Citation2021). In some years, earlier flood peaks in November and March were simulated, but the peak simulated flows were in May. Equally, drier conditions were frequent, and 12 out of 30 years on average did not have simulated overbank flood flows (Wainwright and Ayala Citation2021).
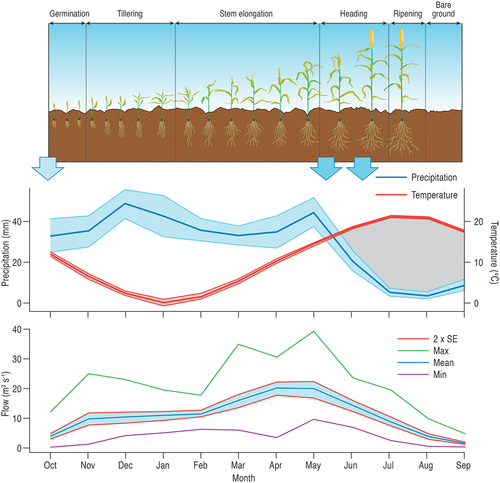
Figure 3. Crop-Growth cycle for winter-sown wheat compared to the climatogram for modern Çatalhöyük (based on the CRU-TS 4 reconstruction of Harris et al. Citation2020) and to modern baseline flows for the River Çarşamba without recent historical catchment modifications (based on Wainwright and Ayala Citation2021). Blue arrows show periods of time when soil moisture is critical for crop growth and production. The shaded areas on the climatogram show 95% confidence intervals for precipitation and temperature based on the time-series record from 1901 to 2016. The flow summary plot shows the 95% confidence interval as well as monthly mean and maximum values, derived from multiple flow simulations to allow propagation of uncertainty from the climate data through the HEC-HMS rainfall-runoff model used to estimate flows (see Wainwright and Ayala Citation2021 for further details).
Rainfall isohyet contours for this corner of the GKB show average rainfall levels decreasing considerably over a short distance, declining from as much as 1300 mm on the high ground to the SW to below 300 mm in the central area of the basin where the site is located. Rainfall comes mostly as intense heavy local showers, meaning that rainfall distribution patterns differ considerably over short distances. Precipitation between December and February is frequently in the form of snow. Rapid thawing in March releases large amounts of water that cause erosion and mud flows on the slopes and considerable flooding near the centre of the Basin to the north of the site, although Wainwright and Ayala (Citation2021) demonstrate that the flow regime would have been significantly less flashy in the basin floor than in the upland areas.
At the time of recent agronomic studies (de Meester Citation1970), Çatalhöyük was located in an area of irrigated arable using water extracted from the Çarşamba River. Without this supplementary water the site would be in an area of ‘dry range’ (kuru mera) livestock grazing. The nearest dry arable farming was some 10 km on the low hills to the south, where precipitation levels were higher. The distinction between dry arable and range conditions emphasises the importance of moisture in determining crop-growing potential. Winter wheat, free-threshing T. aestivum or durum, typically made up 50% of the sown land. Other winter field crops include lentils, barley and oats grown on poorer soils. Spring-sown crops included barley and lentils. A range of vegetables was grown on areas close to the village and these often received small-scale local supplementary watering (Janssen Citation1970). On the GBK, as for much of Anatolia/SW Asia/Mediterranean region, the typical form of dry farming is a two-year bare-fallow system, which has a primary aim of water conservation with some enrichment of soil nitrogen. The system requires fallow land to be ploughed to maintain bare fallow conditions that reduces water-loss by plants, and is typical of low-productivity, low-input farming (Janssen Citation1972). As Halstead (Citation1987) has pointed out, the relevance of this type of farming to prehistoric practices is not a given but, in the absence of more relevant systems, the crop-growing part of the fallow system is described below and used to inform our archaeological modelling.
As shown in , fields were sown in the autumn as soon as possible after the first substantial rains (Helburn Citation1955) to ensure higher yields (Janssen Citation1970; Helburn Citation1955). Seeds need to be sown sufficiently deep to allow the developing plants to survive drought after germination and to resist winter frost (Dewey Citation1969), with depths of 4–6 cm recommended (Christiansen-Weniger Citation1970). Following germination young seedlings are prone to frost damage unless covered by a sufficient layer of snow. Snow cover may last for three months (December–March) and during the cold winter months crop vegetative growth is severely restricted at temperatures below 5°C and only resumes once temperature rises and the snow has melted (March–April).
Table 1. Seasonality data for winter-sown crops in the Greater Konya Basin.
Cold temperatures and low moisture availability also restrict underground root systems, with maximum root development not being achieved until late spring. Experiments conducted by Akman (Citation2017) in Konya show wheat roots growing to a depth of 1.9 m but with more than 50% of the root mass restricted to the top 0.3 m. The typical winter crops of the region are not tolerant of waterlogging and their development is harmed substantially by prolonged periods of waterlogged soils.
Water shortage is the major constraining factor for crop growth on the GKB in the present day. Çatalhöyük is situated in a highly marginal location for dry-farming winter crops. The low levels of water precipitated annually are distributed in a highly variable rainfall patterns in terms of the quantity of rainfall on a monthly and annual basis. For precipitation to be beneficial to the crop, it needs to fall in sufficient quantity to soak the soil to rooting depth. Spring rain is particularly important for winter crops, but the heavy spring showers on the Basin are irregular in distribution and amount. Janssen (Citation1970) describes a minimum annual precipitation level for wheat cultivation of 200 mm, and water conservation measures being required on the GBK where levels are below 450 mm. There is little information available for the potential role seasonal groundwater may have played for crop yield on the GBK, but evidence from other studies shows that groundwater can contribute considerably to total water use (e.g. 65% for winter wheat, Liu and Luo Citation2011).
Crop studies on the GBK show that there are three main periods of plant development when water is crucial to successful growth and yield (see ): (1) early growth/tillering in October–November; (2) stem elongation in May; and (3) flowering and ear formation or heading in June. Winter crops are then harvested in July/August using sickles or by uprooting. Crop yields vary greatly over short distances because of the irregularity in spring rain (Janssen Citation1970).
4. Results
4.1. Climate and flooding scenarios
The sedimentary record of the Palaeoriver Çarşamba consists predominately of a mix of coarse and fine sediments with significant vertical and lateral variability that would have most likely resembled a dryland anastomosing system during the period of occupation (Ayala et al. Citation2017 for full description). Channel size and flooding characteristics of these types of multi-thread channels are difficult to determine from sedimentological studies alone (Nanson and Knighton Citation1996; North, Nanson, and Fagan Citation2007). Coring along transects identified the channel belt, with channels of different widths and depths (Ayala et al. Citation2021 see figures 2.5 and 2.6: 38–39 for cross-sections). It has been suggested that these types of river have the tendency to flood often, but the flow is spread out across the lower reaches of the topography and thus are relatively low-energy (Entwistle et al. Citation2018). Low-energy floods are consistent with observations of clay aggregates (Charles et al. Citation2014). The frequent sediment deposition inherent in a system of this type would mean that there would be a higher capacity for subsurface water storage (Ayala et al. Citation2021). Modelling of the climate makes it possible to observe the effect of precipitation on both potential flooding scenarios and depth of the water table.
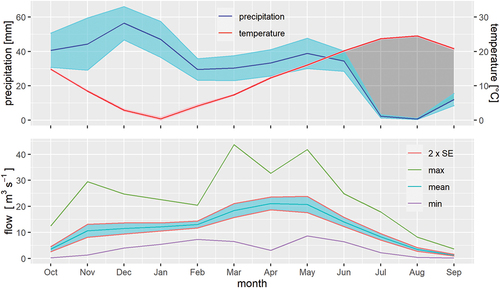
In comparison with the modern baseline, we present two end-members of the climate simulations to demonstrate the range of potential variability. Although we make suggestions that some scenarios may have been more likely at certain points in time, based on the time series from the underlying Nar Gölü isotopic record (Dean et al. Citation2013, Citation2015), variability in the reconstructions suggests the different scenarios also reflect the uncertainty in the reconstructions. Therefore, there could have been shorter time periods where any of the scenarios are relevant (see further discussion in Wainwright and Ayala Citation2021). shows the results for Climate Scenario 2 with moderate woodland, where precipitation was 4% lower than at present, July–September temperatures about 0.23°C cooler and other temperatures about 0.18°C warmer than at present. This scenario most likely reflects conditions in some parts of the Early Phase of occupation of the East Mound. Channel flows are similar to the modern baseline from October to February, but the peak flows are lower in March–May and the summer low flows not quite as extreme. Peak flows tend to occur slightly earlier in the year than when estimated for the modern baseline. Simulated frequency of overbank flood flows remains the same as the channel would likely adjust to the different flow regime through sedimentation. At the opposite extreme, Climate Scenario 14 with moderate woodland has 16% higher precipitation throughout the year, July–September temperatures about 0.23°C cooler and other temperatures about 0.36°C warmer than at present. This scenario produced the lowest water deficits, with an onset typically later in May. shows the results for Climate Scenario 14 with moderate woodland. The higher winter rainfall produces earlier flooding more akin to that seen in the modern baseline, and the highest flows return to being in May. Again, channel adjustments would mean flooding would have a similar frequency (19 years out of 30 on average).
Figure 4. Climatogram for Climate Scenario 2 with moderate woodland in the catchment and the resulting simulated flow regime. The climate scenario accounts for uncertainties in the original proxy and the process of extrapolation to the catchment area, and 95% confidence limits are estimated using Monte Carlo simulations using a stochastic daily weather generator; Monte Carlo simulations are then used to propagate these values through the HEC-HMS rainfall-runoff model, with the shaded blue area showing the 95% confidence interval, and simulated monthly minimum and maximum values also plotted (see Wainwright and Ayala Citation2021 for details).
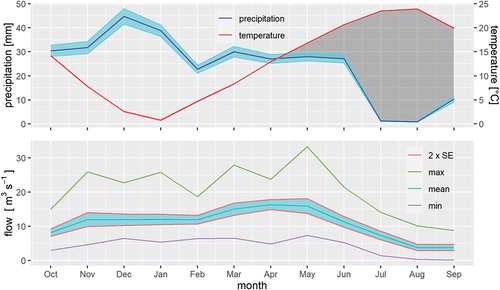
Figure 5. Climatogram for Climate Scenario 14 with moderate woodland in the catchment and the resulting simulated flow regime. The uncertainties are represented as outlined in the caption to (see Wainwright and Ayala Citation2021 for details).
4.2. Water-table scenarios
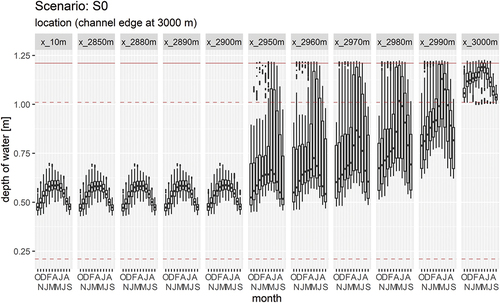
presents the results of the Boussinesq model for the modern baseline simulations. Immediately adjacent to the channel, the median water-table depth remains near to the surface throughout the year, ranging from about 0.15 m below the surface in September, and reaching a peak of about 0.02 m in June. Peaks in the water table occur later in the year than the flood peaks because of the relatively slow rates of lateral flow through the sediments. In very wet years, this area remains permanently flooded, while in dry years, the water table can remain about 0.2 m below the surface throughout the year. These conditions are also likely to be the same on islands in the stream. Moving further away from the channel, the median water-table depth drops off over a distance of about 50 m, beyond which the channel and overbank flooding has no effect, with median water-table depths throughout the year of 0.5–0.6 m. In the intermediate zone, it would be possible for water to be present at the surface for several months, although the water table would be predominantly below 0.2 m and thus below the main rooting depths of cereals. Saturation above this level in wetter years only occurred in the simulations for the months of April–August.
Figure 6. Simulation of the water-table depth across the floodplain for the modern baseline scenario. The channel is on the right-hand edge (at a distance of 3 km), and the x values represent the distance from the simulation edge on the left-hand side. This section can be considered symmetrical about the channel belt because of the assumptions made in the model, so only one side is shown. Note that the distances in the graphic are irregular to pick out where major changes occur. The box-and-whisker plots are used to show the effect of propagating the climate and flow uncertainties through the model using Monte Carlo simulations. The solid brown line is the ground surface, and the dashed brown lines are at 0.2 m and 1.0 m to represent likely rooting depths at key points in the agricultural cycle.
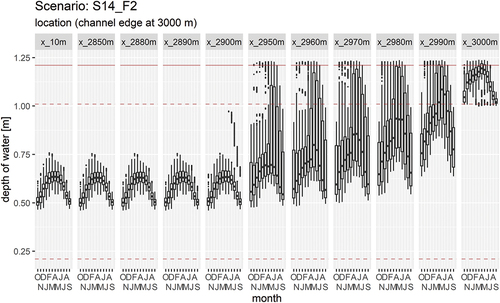
In Climate Scenario 2, the pattern of the water table is similar, but is displaced downwards by about 0.05 m (). Saturation at the surface is not simulated for any entire month, although in some of the wetter years, the intermediate zone of water tables extends for about 110 m from the channel edge. Conversely, in Climate Scenario 14, the water table is typically raised by a similar amount and again the wetter years have higher water tables up to 100 m from the edge of the channel (). Simulations of all the different climate scenarios produce this common pattern, with saturation at or near the surface in the immediate vicinity of the channel (and on islands), an intermediate zone extending for 50–110 m from the channel edge, and deeper water tables further away.
Figure 7. Simulation of the water-table depth across the floodplain for Climate Scenario 2 with moderate woodland in the catchment. Distances are the same as in , and uncertainties represented in the same way. The solid brown line is the ground surface, and the dashed brown lines are at 0.2 m and 1.0 m to represent likely rooting depths at key points in the agricultural cycle.
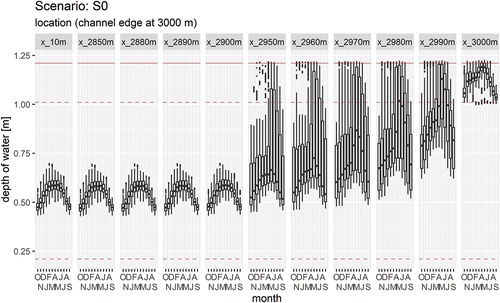
Figure 8. Simulation of the water-table depth across the floodplain for Climate Scenario 14 with moderate woodland in the catchment. Distances are the same as in , and uncertainties represented in the same way. The solid brown line is the ground surface, and the dashed brown lines are at 0.2 m and 1.0 m to represent likely rooting depths at key points in the agricultural cycle.
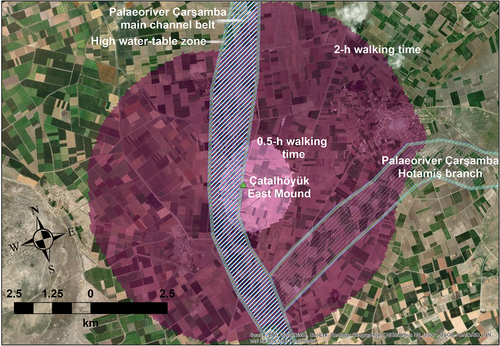
Based on the least-cost analysis, the area of the 0.5-h zone excluding the channel belt and buffer zone from the edge of the East Mound is approximately 375 ha. The area for the 2-h zone is approximately 7,556 ha or 6,795 ha if the Hotamiş channel were active during the Neolithic, though evidence that it was active in Neolithic is limited (). Based on the figures in Bogaard and Isaakidou (Citation2010) and revised population estimates with an upper limit of about 5,000 in the Middle Period (Hodder and Tsoraki Citation2021, 9), these areas would clearly have been sufficient to support the crop-based food requirements of the people of Neolithic Çatalhöyük, without the need to grow crops further afield.
Figure 9. Areas of potential agricultural use suggested by the cost-surface analysis. Zones around the site. The 0.5-h and 2-h walking times use the Tobler off-path function with double resistance for the channel belt. The position of the main channel belt is a best estimate from stratigraphy (see Ayala et al. Citation2017, Citation2021), and the lighter shaded channel belt is the branch to Lake Hotamiş based on de Meester (Citation1970) but evidence that it was active in Neolithic is limited. The buffer zone on the channel belt is based on the Boussinesq analyses ().
4.3. Potential distribution of crop types
The nuanced reconstruction of local hydrology presented here offers, for the first time, a basis for detailed inferences on how cultivation was configured in the local landscape. Three channel belt zones are relevant, as indicated on .
Figure 10. Schematic cross-section of the channel belt showing typical water depths at the wettest and driest points in the hydrological year.
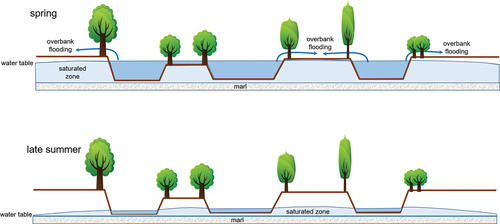
Lower-lying channel-belt islands exposed in the summer but covered with water in the spring high-water period. These would not be suitable for winter crop cultivation due to the high risk of spring flooding.
Higher-lying channel-belt islands at or above water level in the spring but with access to ground water going through to the summer months. They would potentially suitable for winter crop cultivation with high moisture levels depending on the water-table depth relative to the crop-rooting zone.
Channel-belt edge – with high water table in the spring rapidly drying in the summer months – potentially offering excellent conditions for crop cultivation, albeit with the caveat that in wetter years, waterlogging would seriously affect crop growth.
This latter situation with its broad alignment of relatively moist soil conditions alongside the channel belt, extending north and south from the settlement, must have been a key linear zone for planting crops that enjoyed favourable water status. The stable carbon values of archaeobotanical crops indicates that these were the wheats and pulses (Wallace et al. Citation2015; Vaiglova Citation2016; Stroud et al. Citation2021; Vaiglova et al. in prep). Barley was the major crop grown in the drier, rainfall-dependent zone extending eastwards, further away from the channel belt. The boundaries between these moister and drier zones will have varied interannually, as the different scenarios outlined above have shown, but there was a predictable gradient from moist to dry with distance from the belt ().
Figure 11. Simplified spatial distribution of possible agroeconomic settings around Neolithic Çatalhöyük.
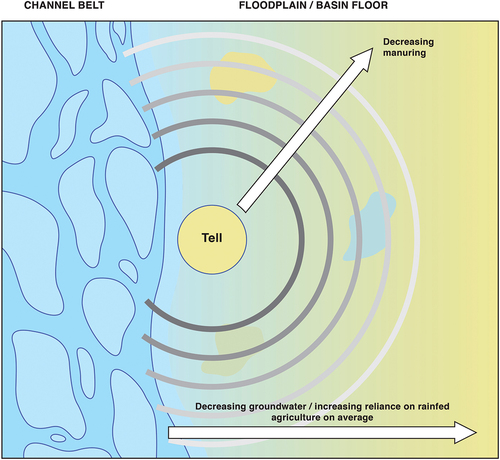
The positioning of the mound itself in the ‘sweet spot’ of declining moisture with distance from the channel belt would have enabled cultivators of the Early Neolithic Levels immediate access to the relatively well-watered zone. As the settlement expanded in the Middle Period (c.6500 BCE) with population levels and density at its highest point (Hodder Citation2021, 21; Hodder and Tsoraki Citation2021; Knüsel et al. Citation2021), however, the radius of cultivation encompassed an increasing proportion of relatively dry land away from the channel belt, eastwards. The expansion of the settlement, which peaked in the Middle Neolithic, would thus have favoured the more drought-tolerant, two-row form of barley, suggesting that any subsequent climate variability or trend towards aridification that has previously been associated with the so-called 8.2 K a event would merely have reinforced this practice as there may have been more, drier locations closer to the site (but also see discussions regarding the relevance and significance of the 8.2 K a event in the region in Wainwright and Ayala Citation2019, Citation2021) ().
The hydrological reconstruction and scenarios presented here also clarify the apparent disconnect between crop water status and soil nitrogen conditions as reflected in the crop stable isotope values (Wallace et al. Citation2015; Vaiglova Citation2016; Stroud et al. Citation2021; Vaiglova et al. in prep). It appears that better watered crops were not necessarily grown under more anthropogenically 15N-enriched conditions. This situation can now be explained as a function of the alignment of water conditions with the channel belt, whereas anthropogenic 15N-enrichment will have tended to decrease with distance from the settlement (cf. Jones Citation2005). Since water and nutrients varied along different spatial axes, it makes sense that relatively ‘dry’ barley could vary in its stable N composition similarly to relatively ‘wet’ wheats.
5. Discussion
Was there any true ‘floodplain cultivation’ in Sherratt’s sense at Çatalhöyük? Strictly speaking, no. Sherratt outlined a spring-sowing regime following flood recession, whereas the crops at Çatalhöyük were routinely autumn-sown and grew under variable watering conditions that extended from a potential/intermittent flooding zone out into drier land away from the channel belt. Sherratt was surely right, however, to point out that Çatalhöyük was sited at least in part with a view to the potential of soils with relatively high groundwater levels in an otherwise arid landscape setting. Our integrated understanding of the local palaeohydrology and Çatalhöyük’s cropping history reveal a diverse and subtle agroecology attuned to the affordances of the local landscape ().
Figure 12. Bird’s-Eye view of reconstruction of the Çatalhöyük landscape, looking south-west (illustration by Katy Killackey): a. dry season (late summer), b. wet season (spring).
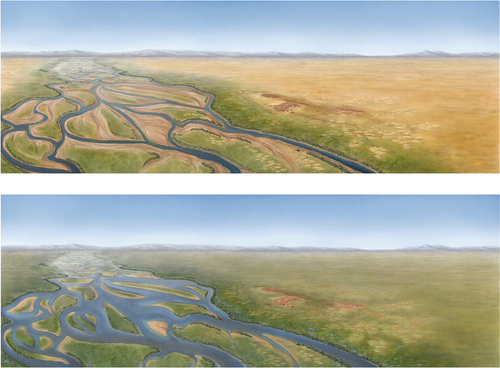
The agroecological reconstruction presented suggests that cropping was closely aligned with the flooding regime and likely provided the occupants of Çatalhöyük with increased resilience. The channel belt itself provided areas of both low- and high-lying islands. While the low-lying islands may have always presented land too wet for successful cropping, the high-lying islands in dry years would have created areas of higher ground that would have presented potential cultivable ground during years of aridity when floodwaters did not supplement the rainfall. The interannual variability of the flooding would have made this ecotonal part of the landscape not only rich in biodiversity (Wolfhagen et al. Citation2021) but also an integral part of the arable landscape in most years. The wetter areas of the islands and immediately adjacent to the channel belt would also typically have been a useful buffer in periods of aridity elsewhere in the landscape and may have provided opportunities for growing more water-demanding crops as well as access to other resources.
Moving progressively further from the channel belt into the basin floor, there was an ideal zone for cultivation of most of the key species under rainfed conditions. The different climate scenarios from Wainwright and Ayala (Citation2021) suggest that if we use the simple threshold of 250 mm of annual rainfall to produce sustainable crops, this threshold would have been met between 23 and 29 years out of 30, reinforcing the idea that strategies were needed to buffer against years (or groups of years) of higher aridity.
Wainwright and Ayala (Citation2019, Citation2021) argue that the climate variability would have required the occupants of Çatalhöyük to be flexible and adapt to years of both more arid and wetter conditions. The Early phase was probably more like the modern baseline or the Climate Scenario 2 (), while the later phases were probably (variably) somewhere between modern conditions and Climate Scenario 14 conditions (). This variability underlines how use of channel-belt islands along with the floodplain in phases of increased variability was part of the sustainable use of the landscape rather than a response to climate change. The occupants of Neolithic Çatalhöyük were able to establish an agroecology that was resilient enough to accommodate the annual and seasonal variability of the environment.
Conclusions
By integrating the new climate scenarios and hydrological modelling with archaeobotanical reconstruction of Çatalhöyük’s agroecological niche, we have sought to resolve debates surrounding both local application of Sherratt’s floodplain cultivation model and land use at the site. Having set out the parameters of site’s hydrological landscape, for the first time it has been possible to situate the arable niche and to appreciate the fundamental role of the site’s ecological setting to its remarkable resilience against climatic variability. Although there are a number of other sites in Neolithic arable settings on the Konya Plain () and further across the Central Anatolian Plateau that are superficially similar to the setting of Çatalhöyük, in practice they have a range of differences in their local environments. For example, catchment areas and substrates, soils and local climate show significant differences. Understanding the place of each site in its local environmental context is critical, rather than attempting to overgeneralize from a limited evidence base. It may be that environmental differences contribute to less persistent occupation in other Neolithic sites in the Konya Basin, but wider consideration of our model will thus require similar integration of detailed, localized geo- and archaeobotanical datasets.
Acknowledgements
We thank Ian Hodder for the opportunity to participate in the Çatalhoyük Research Project. Funding for work reported here was provided by the Templeton Foundation (grant no., 13463, PI Hodder) and the European Research Council (‘AGRICURB’ grant no. 312785, PI Bogaard). We thank Katy Killackey for drawing and Chris Orton for redrawing some of the other figures.
Disclosure statement
No potential conflict of interest was reported by the author(s).
Additional information
Funding
Notes on contributors
Gianna Ayala
Gianna Ayala, Lecturer in Geoarchaeology, Department of Archaeology, University of Sheffield, Minalloy House, 10-16 Regent Street S1 3NJ, UK.
Amy Bogaard
Amy Bogaard, Professor of Neolithic and Bronze Age Archaeology, School of Archaeology, University of Oxford, 1 South Parks Road Oxford OX1 3TG.
Michael Charles
Mike Charles, Professor of Environmental Archaeology, School of Archaeology, University of Oxford, 1 South Parks Road Oxford OX1 3TG.
John Wainwright
John Wainwright, Professor of Physical Geography, Department of Geography, Durham University, Science Laboratories, South Road, Durham DH1 3LE.
References
- Akman H. 2017. “Root Biomass Distribution with Root and Shoot Development at Different Growth Stages of Wild, Ancient and Modern Wheat Species.” Turkish Journal of Agriculture - Food Science and Technology 5 (11): 1422–1428. doi:10.24925/turjaf.v5i11.1422-1428.1390.
- Alberti G. 2021. “Movecost: Calculation of Slope-Dependent Accumulated Cost Surface, Least-Cost Paths, Least-Cost Corridors, Least-Cost Networks Related to Human Movement Across the Landscape.” accessed 15 September 2021. https://cran.r-project.org/web/packages/movecost/index.html
- Ayala G, J Wainwright. 2020. “Çatalhöyük from the Ground Up: The Site and Its Landscapes.” Near Eastern Archaeology 83 (2): 88–97. doi:10.1086/709176.
- Ayala G, J Wainwright, JM Lloyd, JR Walker, R Hodara Nelson, M Leng, C Doherty, M Charles. 2021.”Disentangling the Palaeoenvironmental Reconstructions of Çatalhöyük.” In Peopling the Landscape of Çatalhöyük: Reports from the 2009-2017 Seasons, edited by I Hodder, 31–46. Çatalhöyük Reseach Project Series Volume 13. British Institute at Ankara Monograph No. 53. London: British Institute At Ankara.
- Ayala G, J Wainwright, J Walker, R Hodara, JM Lloyd, M Leng, C Doherty. 2017. “Palaeoenvironmental Reconstruction of the Alluvial Landscape of Neolithic Çatalhöyük, Central Southern Turkey: The Implications for Early Agriculture and Responses to Environmental Change.” Journal of Archaeological Science 87: 30–43. doi:10.1016/j.jas.2017.09.002.
- Badaeva ED, FA Konovalov, H Knüpffer, A Fricano, A Ruban, Z Kehel, S Zoshchuk et al. 2021. “Genetic Diversity, Distribution and Domestication History of the Neglected GGAtAt Genepool of Wheat.” Theoretical and Applied Genetics (Preprint) 134 (10): 3493. doi:10.1007/s00122-021-03931-x.
- Baird AJ. 1999. ”Modelling.” In Eco-Hydrology. Plants and Water in Terrestrial and Aquatic Environments, edited by AJ Baird and RL Wilby AJ Baird and RL Wilby, 300–345. London: Routledge.
- Baird AJ. 2004. ”Soil and Hillslope Hydrology.” In Environmental Modelling: Finding Simplicity in Complexity, edited by J Wainwright, M Mulligan, J Wainwright, M Mulligan, 93–106. Chichester: John Wiley and Sons.
- Baird, D. 2006. “The History of Settlement and Social Landscapes in the Early Holocene in the Çatalhöyük Area.” In Çatalhöyük Perspectives: Themes from the 1995-99 Seasons, edited by I. Hodder, 6: 55–74. Cambridge: McDonald Institute Monographs/british Institute of Archaeology at Ankara.
- Baird, D. 2010. ”Was Çatalhöyük a Centre? The Implications of a Late Aceramic Neolithic Assemblage from the Neighbourhood of Çatalhöyük.” In Development of Pre-State Communities in the Ancient Near East Studies in Honour of Edgar Peltenburg, edited by D. Bolger & L.C. Maguire D. Bolger & L.C. Maguire 207–216. Oxford: Oxbow Books.
- Baird AJ, T Mason, DP Horn. 1998. “Validation of a Boussinesq Model of Beach Ground Water Behaviour.” Marine Geology 148 (1–2): 55–69. doi:10.1016/S0025-3227(98)00026-7.
- Bogaard, A. 2005. “‘Garden Agriculture’ and the Nature of Early Farming in Europe and the Near East.” World Archaeology 37 (2): 177–196. doi:10.1080/00438240500094572.
- Bogaard, A, M Charles, D Filipović, D Fuller, L Gonzalez Carretero, L Green, C Kabukcu, E Stroud, and P Vaiglova. 2021. “The Archaeobotany of Çatalhöyük: Results from 2009-2017 Excavations and Final Synthesis.” In Peopling the Landscape of Çatalhöyük: Reports from the 2009-2017 Seasons, edited by Hodder, I., 91–123. London: British Institute at Ankara.
- Bogaard, A., M. Charles, A. Livarda, M. Ergun, D. Filipović and G. Jones. 2013. The Archaeobotany of Mid-Later Neolithic Occupation Levels at Çatalhöyük.. In I. Hodder (Eds.). Humans and Landscapes of Çatalhöyük: Reports from the 2000-2008 Seasons. 93–128. Los Angeles:Monographs of the Cotsen Institute of Archaeology, University of California at Los Angeles.
- Bogaard, A, D Filipović, A Fairbairn, L Green, E Stroud, D Fuller, & M Charles. 2017. “Agricultural Innovation and Resilience in a Long-Lived Early Farming Community: The 1500-Year Sequence at Neolithic-Early Chalcolithic Çatalhöyük, Central Anatolia.” Anatolian Studies 67: 1–28. doi:10.1017/S0066154617000072.
- Bogaard, A., Henton, E., Evans, J.A., Twiss, K.C., Charles, M.P., Vaiglova, P. and Russell, N. 2014. “Locating Land Use at Neolithic Çatalhöyük, Turkey: The Implications of 87 Sr/ 86 Sr Signatures in Plants and Sheep Tooth Sequences.” Archaeometry 56 (5): 860–877. doi:10.1111/arcm.12049.
- Bogaard, A, V Isaakidou. 2010. “From Megasites to Farmsteads: Community Size and the Nature of Early Farming in the Near East and Europe.” In Landscapes in Transition: Understanding Hunter-Gatherer and Farming Landscapes in the Early Holocene of Europe and the Levant, edited by B. Finlayson and G. Warren, 192–207. London: Levant Supplementary Series & CBRL.
- Boyer, P. 1999 A geoarchaeological approach to Late Quaternary environmental change in South Central Turkey. Unpublished Ph.D. thesis, Loughborough University.
- Boyer, P., N. Roberts, and D. Baird. 2006. “Holocene Environment and Settlement on the Carsamba Alluvial Fan.” South-Central Turkey: Integrating Geoarchaeology and Archaeological Field Survey 21 (7): 675–698.
- Boyer, P., N. Roberts, and J. Merrick. ”KOPAL Excavations at Çatalhöyük 1996-2000.” In Excavating Çatalhöyük: South, North and KOPAL Area Reports from the 1995-99 Seasons, edited by I Hodder 551–570. Cambridge: McDonald Institute for Archaeological Research/British Institute of Archaeology at Ankara. 2007.
- Charles, M, C Doherty, E Asouti, A Bogaard, E Henton, C S Larsen, C B Ruff, P Ryan, J W Sadvari, K C Twiss. 2014. “Landscape and Taskscape at Çatalhoyük: An Integrated Perspective.” In Integrating Çatalhoyük: Themes from the 2000-2008 Seasons, edited by Hodder, I., 71–90. Los Angeles: Cotsen Institute of Archaeology.
- Chisholm, M. 1962. Rural Settlement and Land Use: An Essay in Location. London: Hutchison University Library.
- Christiansen-Weniger F. 1970. Ackerbauformen Im Mittelmeerraum Und Nahen Osten Dargestellt Am Beispiel der Turkei’.
- Dean JR, Eastwood WJ, Roberts N, Jones, M D., Yiğitbaşıoğlu, H., Allcock, S L., Woodbridge, J., et al. 2015. ”Tracking the Hydro-Climatic Signal from Lake to Sediment: A Field Study from Central Turkey”. Journal of Hydrology 529: 608–621. doi:10.1016/j.jhydrol.2014.11.004.
- Dean JR, Jones MD, Leng MJ, Sloane, H J., Roberts, C N., Woodbridge, J., Swann, G.E.A., et al. 2013. ”Palaeo-Seasonality of the Last Two Millennia Reconstructed from the Oxygen Isotope Composition of Carbonates and Diatom Silica from Nar Gölü, Central Turkey”. Quaternary Science Reviews 66: 35–44. doi:10.1016/j.quascirev.2012.07.014.
- de Meester T, eds. 1970. Soils of the Great Konya Basin. Wageningen: Agricultural Centre for Agricultural Publishing and Documentation. Agricultural Research Report 740.
- Dewey, WG. 1969. “Effect of Early-Summer Seeding of Winter Wheat on Yield, Soil Moisture, and Soil Nitrate 1.” Agronomy Journal 61 (1): 51–55. doi:10.2134/agronj1969.00021962006100010017x.
- Domenico, PA and FW Schwartz. 1990. Physical and Chemical Hydrogeology. New York: Wiley.
- Entwistle N, G Heritage and D Milan. 2018. “Flood Energy Dissipation in Anabranching Channels.” River Research and Applications 34 (7): 709–720. doi:10.1002/rra.3299.
- Fairbairn A. 2005. “A History of Agricultural Production at Neolithic Çatalhöyük East, Turkey.” World Archaeology 37 (2): 197–210. doi:10.1080/00438240500094762.
- Fairbairn, A. S., E. Asouti, J. Near and D. Martinoli. 2002. “Macro-Botanical Evidence for Plant Use at Neolithic Çatalhöyük South-Central Anatolia, Turkey.” Vegetation History and Archaeobotany 11 (1–2): 41–54. doi:10.1007/s003340200005.
- Fairbairn, A. S., J. Near and D. Martinoli. 2005. ”Macrobotanical Investigation of the North, South and KOPAL Excavation Areas at Çatalhöyük East”. In Inhabiting Çatalhöyük: Reports from the 1995-99 Seasons, edited by I. Hodder, 137–201. Cambridge: British Institute at Ankara, McDonald Institute for Archaeological Research.
- Filipović, D. 2014. Early Farming in Central Anatolia: An Archaeobotanical Study of Crop Husbandry, Animal Diet and Land Use at Neolithic Çatalhöyük. Oxford: Archaeopress.
- Green, L, M Charles, and A Bogaard. 2018. “Exploring the Agroecology of Neolithic Çatalhöyük, Central Anatolia: An Archaeobotanical Approach to Agricultural Intensity Based on Functional Ecological Analysis of Arable Weed Flora.” Paléorient 44 (2): 29–43.
- Halstead, P. 1981. ”Counting Sheep in Neolithic and Bronze Age Greece.” In Pattern of the Past: Studies in Honour of David Clarke, edited byI. Hodder, G. Isaac and N. Hammond. 307–339. Cambridge: Cambridge University Press.
- Halstead, P. 1987. “Traditional and Ancient Rural Economy in Mediterranean Europe: Plus Ça Change?” Journal of Hellenic Studies 57: 77–87. doi:10.2307/630071.
- Harris I, TJ Osborn, P Jones, D Lister. 2020. “Version 4 of the CRU TS Monthly High-Resolution Gridded Multivariate Climate Dataset.” Scientific Data 7 (1): 109. doi:10.1038/s41597-02.
- Helburn, N. 1955. “A Stereotype of Agriculture in Semiarid Turkey.” Geographical Review 45 (3): 375–384. doi:10.2307/211810.
- Henton, E. 2012. “The Combined Use of Oxygen Isotopes and Microwear in Sheep Teeth to Elucidate Seasonal Management of Domestic Herds: The Case Study of Çatalhöyük, Central Anatolia.” Journal of Archaeological Science 39 (10): 3264–3276. doi:10.1016/j.jas.2012.05.020.
- Hodder, I, edited by. 2021. Peopling the Landscape of Catalhoyuk, Reports from the 2009-2017 Seasons. London: British Institute at Ankara. Monograph 53.
- Hodder, I, Tsoraki, C. 2021. “Communities at Work: 25 Years of Research at Çatalhöyük.” In Communities at Work: The Making of Çatalhöyük, 1–12, Çatalhöyük Reseach Project Series Volume 15. British Institute at Ankara Monograph No. 55, edited by Hodder, I, Tsoraki, C. London: British Institute At Ankara.
- Isaakidou, V. 2011. ”Farming Regimes in Neolithic Europe: Gardening with Cows and Other Models.” In The Dynamics of Neolithisation in Europe: Studies in Honour of Andrew Sherratt, edited by A Hadjikoumis, E Robinson and S Viner A Hadjikoumis, E Robinson and S Viner 90–112. Oxford: Oxbow Books.
- Janssen, B. 1970. Soil Fertility in the Great Konya Basin. Turkey :Wagenigen.
- Janssen, B. 1972. “Significance of the Fallow Year in the Dry-Farming System of the Great Konya Basin, Turkey.” Netherlands Journal of Agricultural Science 20 (4): 247–260. doi:10.18174/njas.v20i4.17273.
- Jarman MR, GN Bailey, HN Jarman. 1982. Early European Agriculture: Its Foundations and Development. Cambridge: Cambridge University Press.
- Jones, G. 2005. “Garden Cultivation of Staple Crops and Its Implications for Settlement Location and Permanence.” World Archaeology 37: 164–176.
- Knüsel, CJ, Milella, M, Betz, B, Dori, I, Garofalo, E, Glencross, B, Haddow, S et al. 2021.Bioarchaeology at Neolithic Çatalhöyük: Indicators of Health, Well-Being and Lifeway in Their Social Context. In Peopling the Landscape of Çatalhöyük: Reports from the 2009-2017 Seasons, edited by I Hodder, 315–355. London: British Institute At Ankara.
- Liu, T. and Yi Luo. 2011. “Effects of Shallow Water Tables on the Water Use and Yield of Winter Wheat (Triticum Aestivum L.) Under Rain-Fed Condition.” Australian Journal of Crop Science 5 (13): 1692–1697.
- Nanson, G C, A D Knighton. 1996. “Anabranching Rivers: Their Cause, Character and Classification.” Earth Surface Processes and Landforms 21 (3): 217–239. doi:10.1002/(SICI)1096-9837(199603)21:3<217:AID-ESP611>3.0.CO;2-U.
- NASA JPL. 2014. ”NASA Shuttle Radar Topography Mission Combined Image Data Set (Data Set). NASA EOSDIS Land Processes DAAC.” Accessed 25 March 2021. doi:10.5067/MEaSUREs/SRTM/SRTMIMGM.003.
- North, CP, GC Nanson, SD Fagan. 2007. “Recognition of the Sedimentary Architecture of Dryland Anabranching (Anastomosing) Rivers.” Journal of Sedimentary Research 77 (11): 925–938. doi:10.2110/jsr.2007.089.
- R Core Team. 2021. R: A Language and Environment for Statistical Computing. Vienna, Austria: R Foundation for Statistical Computing. http://www.R-project.org/
- Roberts, N., S. Black, P. Boyer, WJ. Eastwood, HI. Griffiths, HF. Lamb, MJ. Leng, et al. 1999. “Chronology and Stratigraphy of Late Quaternary Sediments in the Konya Basin, Turkey: Results from the KOPAL Project.” Quaternary Science Reviews 18: 611–630. doi:10.1016/S0277-3791(98)00100-0.
- Roberts, N., and A. Rosen. 2009. “Diversity and Complexity in Early Farming Communities of Southwest Asia: New Insights into the Economic and Environmental Basis of Neolithic Catalhöyük.” Current Anthropology 50 (3): 393–402.
- Rosen, A., and N. Roberts. 2005. “The Nature of Çatalhöyük, People and Their Changing Environments in the Konya Plain.” In Çatalhöyük Research Project, edited by I Hodder, 39–53. Vol. 6. Cambridge: / McDonald Institute for Archaeological Research.
- Sherratt, A. 1980. “Water, Soil and Seasonality in Early Cereal Cultivation.” World Archaeology 11 (3): 313–330. doi:10.1080/00438243.1980.9979770.
- Sherratt, A. 1981. ”Plough and Pastoralism: Aspects of the Secondary Products Revolution.” In Pattern of the Past: Studies in Honour of David Clarke, edited by I Hodder, G Isaac and N Hammond I Hodder, G Isaac and N Hammond 261–305. Cambridge: Cambridge University Press.
- Stroud, E., A Bogaard and M Charles. 2021. “A Stable Isotope and Functional Weed Ecology Investigation into Chalcolithic Cultivation Practices in Central Anatolia: Çatalhöyük, Çamlıbel Tarlası and Kuruçay.” Journal of Archaeological Science: Reports 38: 103010. https://doi.org/10.1016/j.jasrep.2021.103010
- Styring, A.K., Evans, J.A., Nitsch, E.K., Lee-Thorp, J.A. and Bogaard, A. 2019. “Revisiting the Potential of Carbonized Grain to Preserve Biogenic 87 Sr/ 86 Sr Signatures Within the Burial Environment.” Archaeometry 61 (1): 179–193. doi:10.1111/arcm.12398.
- Vaiglova, P. 2016. Neolithic Agricultural Management in the Eastern Mediterranean: New Insight from a Multi-Isotope Approach. PhD thesis., Oxford: University of Oxford.
- Vita-Finzi, C. 1969. “Fluvial Geology.” In Science in Archaeology, edited by Brothwell, D., Higgs, E.S., 135–150. London: Thames & Hudson.
- Vita Finzi C. 1978. Archaeological Sites in Their Setting. London: Thames and Hudson.
- Vita Finzi C, ES Higgs. 1970. “Prehistoric Economy in the Mount Carmel Area of Palestine: Site Catchment Analysis.” Proceedings of the Prehistoric Society, 36, 1–37. doi:10.1017/S0079497X00013074
- Wainwright J, G Ayala. 2019. “Teleconnexions and Environmental Determinism: Was There Really a Climate-Driven Collapse at Late Neolithic Çatalhöyük?’, Proceedings of the National Academy of Sciences, 116, 3343–3344. doi: 10.1073/pnas.1818336116
- Wainwright J, G Ayala. 2021. “Reconstructing the Neolithic River Çarşamba and the Riverscape of Çatalhöyük, Turkey.” The Holocene. doi:10.1177/09596836211041744.
- Wallace, MP, G Jones, M Charles, R Fraser, T Heaton and A Bogaard. 2015. “Stable Carbon Isotope Evidence for Neolithic and Bronze Age Crop Water Management in the Eastern Mediterranean and Southwest Asia.” PLoS ONE 10 (6): e0127085. doi:10.1371/journal.pone.0127085.
- Wolfhagen J, R Veropoulidou, G Ayala, D Filipović, C Kabukcu, C Lancelotti, M Madella, K Pawłowska, CG Santiago-Marrero, J Wainwright. 2020. “The Seasonality of Wetland and Riparian Taskscapes at Çatalhöyük.” Near Eastern Archaeology 83 (2): 98–109. doi:10.1086/708446.
- Wolfhagen, J., R. Veropoulidou, G. Ayala, D. Filipović, C. Lancelotti, M. Madella, C. Kabukcu, K. Pawłowska, CG. Santiago-Marrero, and J. Wainwright. 2021. “The Seasonality of Using Wetland and Riparian Environments at Çatalhöyük.” In Communities at Work: The Making of Çatalhöyük, 103–114, British Institute at Ankara Monograph 55, Çatalhöyük Research Project Series Volume 15. British Institute at Ankara, edited by I Hodder and C Tsoraki. Ankara.