
ABSTRACT
Aims
To describe the time in days for lame dairy cows to recover after diagnosis and treatment of claw horn lameness, and to investigate whether cure rates differed between farms.
Methods
Five dairy farms in the Waikato region were conveniently enrolled into a descriptive epidemiological study. Three of these farms had dairy cattle enrolled over two consecutive seasons, while two farms enrolled for one year. Lame cattle diagnosed by the farmers were enrolled into the study if they had a lameness score (LS ≥ 2 on a 0–3 scale) and claw horn lesions. All enrolled animals were treated by a single veterinarian following a consistent methodology, and subsequently assessed for LS at a median frequency of 4 days from enrolment until they were sound (LS = 0). The times (days) taken for animals to become sound and non-lame (LS < 2) were reported for all animals, and Kaplan–Meier survival curves used to present the results. A Cox-proportional hazard model was used to assess if the hazard of soundness was associated with farm, age, breed, lesion, number of limbs involved, and LS at enrolment.
Results
A total of 241 lame cattle with claw horn lesions were enrolled across the five farms. White line disease was the predominant pain-causing lesion in 225 (93%) animals, and blocks were applied to 205 (85%) of enrolled animals. The overall median days from enrolment to becoming sound was 18 (95% CI = 14–21) days, and 7 (95% CI = 7–8) days to become non-lame. A difference in the hazards of lameness cure between farms was identified (p = 0.007), with median days to lameness cure between farms ranging from 11 to 21 days. No associations were identified between age, breed, limb, or LS at enrolment on the lameness cure rates.
Conclusions
Treatment of claw horn lameness following industry-standard guidelines in dairy cattle on five New Zealand dairy farms resulted in rapid cure, although cure rates differed between farms.
Clinical relevance
Following industry best-practice lameness treatment guidelines, including frequent use of blocks, can result in rapid lameness cure rates in New Zealand dairy cows. This study also suggests that management of lame cattle on pasture can positively benefit their welfare and recovery times. The reported cure rates provide veterinarians with benchmarks on the length of time after which a lame animal should be re-examined, and in the investigation of poor treatment response rates at the herd level.
Introduction
Lameness in dairy cattle remains one of the big welfare concerns of dairy farming, with prevalence estimates > 30% at any given time in many dairy systems (Dippel et al. Citation2009; Griffiths et al. Citation2018). However, prevalence is not the only epidemiological measure of lameness impact; incidence and duration of lameness are both important. Duration of lameness has a huge effect on the impact of lameness on the welfare and productivity of dairy cattle (Archer et al. Citation2010; Ekanayake et al. Citation2022). Thus, to understand the true impact of lameness on a farm, knowledge of the expected duration of lameness is essential. Furthermore, understanding variations in lameness duration between farms or systems may also identify treatment and control strategies that are more effective than others, bypassing the need for randomised clinical trials, which are notoriously difficult and expensive to conduct for lameness (Thomas et al. Citation2015). The most clinically relevant causes of lameness in New Zealand are non-infectious lesions that involve damage to the corium with subsequent haemorrhage, collectively known as claw horn disruption lesions. These lesions include white line, sole, and axial groove lesions, all of which can lead to claw horn lameness (CHL). Understanding the incidence of lameness is also important, however measuring this requires continued ongoing observation or retrospective analysis of potentially flawed data such as farmer records (e.g. Chawala et al. Citation2013). However, as incidence is dependent on both the prevalence and the duration of disease (Freeman and Hutchison Citation1980), incidence can be estimated directly from these parameters.
Duration is particularly important for lameness because, among painful diseases of dairy cattle, lameness is unique in its prolonged duration of effect. It has been demonstrated in New Zealand that dairy cows start to lose liveweight 3 weeks prior to being diagnosed and treated for lameness (Alawneh et al. Citation2012b). Following treatment for CHL there is a period of at least 28 days where animals have an exaggerated response to painful stimuli (Laven et al. Citation2008). However, there is very little information on expected clinical recovery rates, with the majority of previous research focused on time to cure describing lameness scoring at fixed time periods (Whay et al. Citation2005; Laven et al. Citation2008; Thomas et al. Citation2015). While these fixed time periods facilitate communication of results and comparisons between studies and systems, they do not give accurate information on the time taken for cattle to become sound. Fixed time points of 35 days (Thomas et al. Citation2015) and 42 days (Thomas et al. Citation2016) have been used in the UK to assess recovery risk. The use of these fixed time points means that a cow enrolled in the Thomas et al. (Citation2016) study that became sound 3 days after treatment would have the same weighting as one that became sound at 41 days. Clearly, these different durations of lameness would have resulted in profound differences in the welfare and productivity of the lame animals. A more powerful method of analysis of duration data is time-to-event (survival) analysis, which identifies the time to cure for x% of animals (usually 50%, i.e. median). This analysis can take account of both when cows become sound during the study period, and cows that are lost to follow-up. In addition to time to cure, this analysis also calculates the hazard rate of soundness (i.e. the frequency at which cows become sound per unit of time). Cure rates can be converted without difficulty to cure risks when descriptive time-to-event data are provided, but converting cure risks to cure rates is usually not possible. Thus, comparisons between the studies reporting cure risks are challenging. However, the use of time-to-event analysis for CHL cure is rare, and often incomplete. For example, Klawitter et al. (Citation2019) reported the hazard ratio of cure in cows with sole ulcers treated with and without bandages, but their measure of duration was the proportion healed on day 28 (rather than time to cure for x%). With respect to New Zealand data, Tranter and Morris (Citation1991) analysed time to recovery of lame cows at pasture (principally white line disease, sole bruising and footrot), but did not use time-to-event analysis, and their outcome measure was mean time to recovery. Thus, there is still a gap in the literature on the recovery rate of dairy cattle, especially for claw horn lesions.
Knowledge on lameness recovery times is important both to judge the welfare impact of lameness, and to gauge whether a treatment is successful. More detailed knowledge around expected recovery times will empower animal health advisors and farmers to assess farm performance of lameness treatment, and to give more scientifically backed advice around when re-examination of an animal is required. With the increasing use of precision livestock farming, this may enable advisors to track the recovery rates of lame animals across various farms. The aims of this study were therefore to describe the clinical lameness recovery rate in pasture-based dairy cattle diagnosed with CHL and treated with best-practice treatment protocols, and to assess whether the recovery rate varied between farms.
Materials and methods
This was a descriptive observational epidemiological study. All manipulations of animals were approved by AgResearch (Ruakura) Animal Ethics Committee application number 15097.
Five dairy farms from the Waipā and Otorohanga districts (Waikato region) of New Zealand were enrolled, based on a convenience sample, in the spring of 2020, and three of those farms were enrolled again in the spring of 2021. The farms were enrolled based on a proven track record of involvement in research trials, with a location within 50 km of the veterinary clinic that author WM was affiliated with, and with the necessary willingness and lame cow treatment facilities to conduct and participate in the study. The start and end dates were dependent on the farm enrolled and were based on the historical time frame at which peak lameness incidence typically occurred (either pre-mating or during mating). Across both years, the median enrolment time period on the farms was 70 (min 45, max 141) days.
The target population for this study was cows with CHL. The eligible population consisted of all non-lame lactating dairy animals present on enrolled farms at the initial enrolment date. From the start date until the end date for enrolment on each farm, animals that were identified as lame by the farmer, and then examined by the study veterinarian (MC), were eligible to be enrolled in the study. Lame cattle were identified as per normal on-farm practices, with no formal training given to the farmers.
Following the identification of a lame animal by the farmer, the animal was examined within 24–48 hours by the primary veterinarian. As a first step, all animals had a lameness score (LS) event recorded by a technician while the cows were on a concrete collecting yard. Scoring was based on the DairyNZ 0–3 grading system (DairyNZ Citation2023) (), a method adapted from the Agriculture and Horticulture Development Board in the UK. Cows that were given a LS ≥ 2 by the technician were eligible for inclusion in the study.
Table 1. Lameness scoring descriptors used in a study of lameness recovery rates following treatment of dairy cattle with claw horn lesions on 5 farms from the Waikato region of New Zealand (adapted from DairyNZ lameness scoring system; DairyNZ Citation2023).
For the trial, all cows were scored by the same technician who was trained to LS by author WM, and who was re-assessed four times within the first month of the study by the same author. Formal training consisted of LS theory and watching pre-recorded videos, which the technician was quizzed on until 100% agreement was reached with author WM. A practical session was then conducted with > 200 animals scored while walking back to grazing following milking. Assessment of drift was not carried out during the observation period, and reliability measures were not assessed. For all LS events, both the score and the limb were recorded; however, the animal was the unit of interest for the study.
After scoring, eligible cows were placed into a purpose-built lame cow crush on the farm. Non-lame animals were not examined in the crush. Examination and treatment of the lame foot followed the guidelines set out in the DairyNZ Lameness Field Guide (DairyNZ Citation2017), with the primary pain-inducing claw and lesion identified using hoof testers. After therapeutic trimming, wooden blocks (Demotec blocks with Hoof-Tite adhesive; Veehof, Ashburton, NZ) were applied to the non-lame claw provided there was an absence of marked pain detectable by hoof testers. The presence of visible lesions on that claw, the LS, and lesion severity did not affect the decision making for block application. The application of wooden blocks was ultimately done at the veterinarian’s discretion; however, the use of blocks was actively encouraged, and a reason recorded if one was not applied. Farmers were incentivised to participate in the study by having their lame cattle treated without charge. The same veterinarian carried out all examinations and therapeutic hoof trimming on the five farms across both study years to ensure consistency.
In addition to exclusion from the study if they had a LS of ≤ 1 at the time of the veterinary visit, cows presented by the farmer to the veterinarian as lame were excluded if they had non-CHL (e.g. footrot, digital dermatitis, upper limb injury); lameness that required claw amputation; bilateral LS = 3 lameness; marked pain response on medial and lateral claw of the same limb upon hoof-testing; or non-compliance (i.e. difficult to handle/treat). After exclusions, the CHL identified as causing lameness were defined as either primarily white line lesions, sole lesions, or axial wall lesions. An animal could only be enrolled once; any subsequent or repeat case of lameness was not eligible for inclusion in the study.
After enrolment, an animal was removed from further involvement in the study in the event of any health or welfare reason(s) that might bias the study or cause unnecessary suffering of the animal. Specifically, they were re-examined if they had a LS = 3 on more than one occasion after enrolment, or if they became lame (LS ≥ 2) on another limb and were then removed from any further participation in the study. Animals were also excluded if they were treated for lameness by the farmer at any stage during the study period. Animals were included within the analysis up to the date of any subsequent exclusion, so that LS data prior to exclusion was still analysed; all animals that had at least one LS following initial lameness examination were included in the analysis.
Once enrolled, animals had a LS event recorded a median of 2 (min 1, max 3) times per week; the greatest length of time between scoring events on a farm was 8 days, with a median of 4 days. All enrolled animals were managed in a separate lame herd close to the milking parlour and milked once per day, with the dietary allocation decided and managed by the farmer. Lame animals remained in this herd until the study technician had defined them as sound (LS = 0), at which point the study concluded for that animal. Blocks were assessed for retention up to 14 days; if they fell off, the animal was bought back into the crush and a block re-applied. No data were collected on block retention after 14 days, and no attempt was made to remove blocks from sound animals.
Statistical analysis
Descriptive statistics were tabulated and presented for the number of animals examined and enrolled into the study based on farm, age, breed, year, LS at enrolment and lesion. Age was categorised into 2, 3, 4–8 and > 8 years of age. Breed was defined as one specific type if an animal had > 12/16 of one breed as defined by Livestock Improvement Corporation (Hamilton, NZ); all others were defined as cross-bred. All analyses were carried out at the cow level and were undertaken using R Version 4.2.0 (R Core Team, 2022; R Foundation for Statistical Computing, Vienna, Austria).
Survival analysis techniques were used to analyse the days from enrolment to being diagnosed as sound. Kaplan–Meier (KM) survival curves, with risk tables, were produced for each farm, and overall. Animals were right-censored at the time they were removed from the study due to post-inclusion removal, or at the last LS event if they did not have a LS = 0. The time-to-event for 10%, 25%, 50%, 75% and 90% of enrolled lame cows to become sound was reported, and the probability of lameness cure, with 95% CI of the KM estimate using the log–log method, at 7, 14, 21, 28 and 35 days presented.
To assess statistical associations between potential risk factors and the hazard rate of soundness, Cox proportional-hazard models were generated. Potential risk factor variables and confounders included farm, age, breed, block application, loss of block, lesion, year of enrolment, LS at enrolment, and multiple limb involvement. Each of these potential risk factors were initially screened with respective unconditional Cox proportional-hazards models and any that had a likelihood ratio test p < 0.20 were included in an initial multivariable Cox proportional-hazards model; no interactions were assessed due to the low power to assess interactions and lack of biological plausibility. Backwards elimination of variables was carried out until the likelihood ratio test between two nested Cox proportional-hazard models had a p < 0.05. Those variables that were removed from the model were then placed back in one by one, in order of the smallest p-value from the likelihood ratio test to the greatest to assess for confounding. If the variable altered the coefficients or standard errors of the included risk factors by > 20%, then it was considered a confounder and retained in the model. Results from the model were reported as hazard rate ratios (HRR) with associated 95% CI and p-values. The HRR and 95% CI for all unconditional associations were also reported. The proportional hazards assumption was assessed using a global statistic based on Schoenfeld residuals. Deviance residuals and Cook’s distances were investigated to assess for outliers and influential observations, respectively.
The KM descriptive statistics as described above were then replicated for the number of days taken for an animal to become non-lame (LS ≤ 1) as the outcome.
Results
A total of 284 animals were examined for lameness from five farms, with 241 animals enrolled. Those not enrolled were excluded due to either footrot (n = 26), upper-limb lameness (n = 5), or no identifiable lesion despite a LS ≥ 2 (n = 12). The majority of lameness identified in the enrolled cows on the five farms was diagnosed as being due to white line disease (225/241; 93%), with only 16/241 (7%) of animals diagnosed with a primary sole-based lameness-causing lesion (). There were no animals diagnosed and enrolled with axial wall lesions. In total, 16/241 (7%) enrolled animals had lameness in the front claws. Fifteen animals (6%) had clinical lesions on two limbs; all of these were in hind feet. In total, 207/241 (86%) enrolled animals received a wooden block on the sound claw. Eleven of the 207 (5.3%) blocks fell off within 14 days of treatment and were replaced. Monthly CHL incidence rates on the farms during the study periods ranged from 2.0 to 9.2 cases per 100 cow months, with a median of 3.5 cases per 100 cow months (Supplementary Table 1).
Table 2. Descriptive statistics (number (n) and percentage) of the population of enrolled dairy cattle with claw horn lameness across two dairy seasons (n = 241) recorded as part of a study of lameness recovery rates following treatment on 5 farms from the Waikato region of New Zealand.
Time to soundness (LS = 0)
The overall median days taken from enrolment to becoming sound was 18 days, i.e. 50% of lame cows were sound and back with the main milking herds within 18 (95% CI = 14–21) days of treatment ( and ). The cumulative unadjusted KM survival curve, and associated risk table, highlights a relatively consistent pattern in the time taken for animals to become sound up to approximately 35 days following enrolment. It took 7 days for at least 10% of animals to become sound, 11 days for 25%, 28 days for 75% and 35 days for 90%.
Figure 1. Kaplan–Meier estimate of cumulative survival curve and risk table for the days to become sound (lameness score = 0, adapted from DairyNZ Citation2023) following treatment for dairy cattle (n = 241) with claw horn lesions on five farms in the Waikato region of New Zealand. The shaded area represents 95% log-log CI, and the + are right-censored animals.
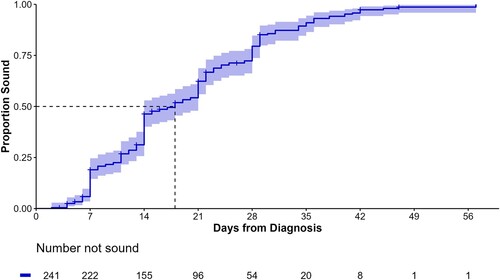
Table 3. Kaplan–Meier non-parametric cumulative survival probability (with 95% CI) for probability of soundness (lameness scoreTable Footnotea (LS) = 0) and probability of non-lame (LS ≤ 1) at 7, 14, 21, 28 and 35 days after enrolment in a study of lameness recovery rates following treatment of dairy cattle with claw horn lesions on 5 farms from the Waikato region of New Zealand.
There were 25/241 (10.4%) animals right censored (median 14 (min 3, max 47) days) that never achieved a recorded LS = 0 event after treatment. Six of those became lame on a different limb, 13 were re-treated because lameness did not improve or became worse, three were treated by the farmer after enrolment, and three were the result of unrelated death or culling. If it was assumed that all 25 censored animals would have been LS > 0 at 60 days following treatment, then the only major difference noted would have been an overall cure rate of 90%, compared to 99%. The time for 50% and 75% of animals to become sound would have increased by 1 day, to 19 and 29 days, respectively, while there would have been no difference in the time taken for 10% and 25% of animals to cure.
The only variable that was included in the final Cox proportional-hazard model was farm, with differences noted between farms in the hazard rates of becoming sound following lameness treatment (, ). The predicted median survival times by the KM analysis ranged from 11 days to 21 days, and HRR from the Cox proportional-hazard model were significantly different between farms (p = 0.007). From the unconditional Cox proportional-hazard models, no associations were identified between any of the other potential risk factor variables and time to soundness (). No deviation from the proportional hazards assumption was identified, and no influential observations or outliers were identified. There was also no association between application of a block compared to no application of a block (HRR = 1.26; 95% CI = 0.8–1.9), although the proportional hazard assumption was violated, so this inference may be invalid.
Figure 2. Cumulative survival curve from a Cox proportional-hazard model for the days to become sound (lameness score = 0, adapted from DairyNZ Citation2023) following treatment for dairy cattle (n = 241) with claw horn lesions on each of five farms in the Waikato region of New Zealand.
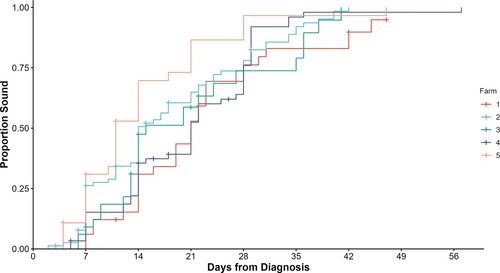
Table 4. Results of final Cox proportional-hazards semi-parametric regression model predicting hazard rate ratio (HRR) for return to soundness following treatment of dairy cattle (n = 241) with claw horn lesions on five farms in the Waikato region of New Zealand.
Table 5. Results of univariable Cox proportional-hazards semi-parametric regression models predicting hazard rate ratio (HRR) for return to soundness following treatment of dairy cattle (n = 241) with claw horn lesions on five farms in the Waikato region of New Zealand.
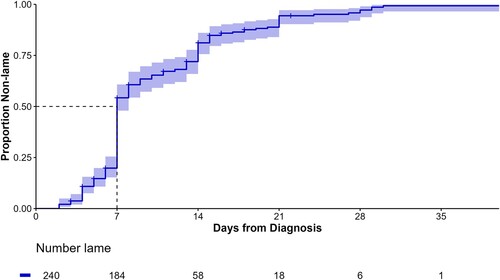
With non-lame as the outcome (number of days to first LS ≤ 1), the median number of days predicted by the KM analysis to become non-lame was 7 (95% CI = 7–8) days ( and ). It took 4 days for at least 10% of animals to become non-lame, 7 days for 25%, 14 days for 75% and 21 days for 90%. The median number of days to non-lame event per farm ranged from 7 to 9 days, but there was a greater range between farms for when 75% of the animals became non-lame (11–21 days).
Figure 3. Kaplan–Meier estimate of cumulative survival curve and risk table for the days to become non-lame (lameness score ≤ 1, adapted from DairyNZ Citation2023) following treatment for dairy cattle (n = 241) with claw horn lesions on five farms in the Waikato region of New Zealand. The shaded area represents 95% log-log CI, and the + are right-censored animals.
Discussion
This observational study reports the cure rates of lactating dairy cattle with LS ≥ 2 diagnosed with CHL on five New Zealand dairy farms undergoing best-practice hoof trimming treatment. Median cure rates to soundness of 18 days and to non-lame in 7 days were reported, highlighting that excellent recovery rates can be achieved in lame New Zealand dairy cattle, even when the animals are identified as lame by farm staff without routine measurement of LS. Differences in cure rates between farms were also identified.
A range of values for risk of cure of CHL have been previously reported, with the majority of these considerably poorer than those reported in the current study. Studies from the UK had non-lame cure risks ranging from 78.6% 2 weeks after treatment (Miguel-Pacheco et al. Citation2017) to 15% at 42 days (Thomas et al. Citation2016). At 35 days after treatment in a randomised clinical trial on acutely lame animals in the UK, soundness cure risks of 24–55% were reported (Thomas et al. Citation2015); for comparison purposes, 90% of lame animals had returned to sound in the current study by 35 days. The cure risk has also varied in studies conducted on cattle managed at pasture. An early New Zealand study of pasture-based cattle reported mean recovery times of 27 days from 73 animals with white line lesions and 30 days from 78 animals with bruising (Tranter and Morris Citation1991). More recently, Laven et al. (Citation2008) reported between 54% and 79% cure risk 28 days after treatment for soundness (LS = 1/5), or 62–91% 28 days after treatment with non-lame as the outcome (LS < 3/5). The cure rates reported for the current study are most similar to the recovery rates reported by Australian farmers from a study three decades ago (Pyman Citation1997). Almost 50% of animals treated with a wooden block had an improved LS by 3 days and 65.8% by 7 days; however, these cure rates were reported by the farmer and a more subjective and unvalidated LS method was used in that study, thus the quality of the information is uncertain. To the authors’ knowledge, the cure rates reported in the current study are both the most sensitive ever reported for CHL due to the frequent nature of the LS events and are among the shortest time-to-soundness estimates reported.
In order to assess the true lameness cure risks/rates, it is important to consider animals that were either removed from the study after enrolment (Thomas et al. Citation2015, Citation2016), or those that were re-treated but remained in the study (Laven et al. Citation2008). In some studies, this is no trivial matter. For example, 33 out of the initial 189 enrolled lame cattle (17.5%) in the study by Thomas et al. (Citation2016) were lost to follow up and not analysed, with 13/33 of these due to re-treatment of lameness. From a total of 3,967 individually treated lame animals in Taranaki, New Zealand, 521 had a re-treatment event recorded, although no further data were provided on the time frame from first to second case of lameness (Chesterton et al. Citation2008). In all studies reporting cure risk, an a priori decision has to be made on whether those animals are included or removed from the analysis. Regardless of the decision, this biases the cure risks such that the true cure risks are likely poorer than reported. One of the major advantages of using survival analysis techniques is that all enrolled animals can make up part of the denominator at some stage prior to censoring. The current study had 25 censored animals, 19 of which were either re-treated for lameness in the same limb or became lame in a different limb. Using sensitivity analysis, we could confirm that these censored observations did not influence the median time to cure, and only made a 9% difference to the final cure risk at 60 days if it were assumed that none of these would have cured.
Another challenge of lameness research measuring cure risk/rate as the outcome is that of recurrent lameness vs. a new case of lameness. If only single LS time points are reported, it may be near-impossible to differentiate an ongoing case of lameness from an animal becoming sound and then lame again, especially in systems with high prevalence of lameness. Animals in the study by Groenevelt et al. (Citation2014) had a more than 30% lower cure risk at 18 weeks post-treatment compared to 2 weeks post-treatment, highlighting how substantial this issue can be. The current study focused on time to first soundness event with frequent assessments and, as such, the issue of recurrent vs. new cases was not an issue. However, the animals were not followed beyond the point at which they became sound, so no information was available on whether those animals then became lame again. Cure rates also depend on whether the analysis is at the limb level or cow level. Despite the very poor cure rates at the cow level reported in Thomas et al. (Citation2016), when the apparent leg-cure was used as the outcome, rather than the whole animal, cure rates between 52% and 58% for each of the treatment groups were reported. Although cure rates were assessed at the cow level in the current study, there was a low incidence of contra-lateral limb lameness reported, so we do not believe this to be a large issue.
There is a consensus that time to lameness diagnosis and lameness treatment protocols are strongly associated with lameness cure risk (Groenevelt et al. Citation2014; Thomas et al. Citation2015; Pedersen and Wilson Citation2021). Although it is hypothesised that the adherence to best-practice treatment protocols and prompt identification of the lame cattle were at least partly responsible for the rapid cure times noted in this study, no control group was present to assess this. Farmers were incentivised by having the lame animals treated and managed for them at no cost and this undoubtedly increased their motivation to identify lame animals early. However, this was similar to the study protocol of Laven et al. (Citation2008). Alawneh et al. (Citation2012b) also offered to treat lame animals at no cost, yet there was still a median period of 3 weeks of weight loss before lameness was identified. Furthermore, although all cows identified with LS > 3 (1–5 scale) were eventually presented for lameness treatment by the farmer in the study by Alawneh et al. (Citation2012a), > 40% of these were treated > 3 weeks after being identified as lame. Therefore, it is unlikely that a large proportion of the cure rates in the current study can be attributed to rapid identification of lameness.
The use of blocks on the sound claws was encouraged in all animals, regardless of size and severity of lesions. Whilst the study design did not enable direct inferences to be assessed, the authors propose that the high frequency of blocks may be at least partially responsible for the rapid cure rates identified. Blocks were applied to 85% of all enrolled cattle, with 50% of animals non-lame within 1 week of treatment. Laven et al. (Citation2008) reported that 45% of all lame animals enrolled required a plastic shoe based on lesion severity and size, and that usage below this proportion likely indicates underuse of this treatment. The present authors would go one step further and state that, based on the results from the current study, there should be a good reason provided not to apply a block, rather than requiring reasons to administer a block, and we should aim for targets close to 100% of animals with CHL receiving some form of block.
The authors speculate that the other likely reason for the relatively rapid cure rates reported in this study is the post-treatment management of the lame animals, an area that has received little attention in the lameness literature compared to rapid detection and prompt treatment. There has been concern for the welfare of lame cattle post-treatment in pasture-based dairy cattle due to the perceived distances that they need to walk (Pinheiro Machado Filho and Gregorini Citation2022). In this study, as is common practice in New Zealand, to minimise the impact of walking on lameness recovery, all of the lame cows were managed in a separate herd close to the milking parlour and milked once per day until they recovered. This management approach probably reduced time to soundness by maximising time spent on pasture and minimising the contact with hard-wearing surfaces such as tracks and collecting yards (an approach that has been shown to have benefits in lame cows that are normally housed; Hernandez-Mendo et al. (Citation2007); Black et al. (Citation2017)). The differences in cure risk apparent when the lameness studies are collapsed into housed or pasture-based systems support this suggestion, with the poorest cure risk/rates associated with housed cows (Thomas et al. Citation2015, Citation2016; McLellan et al. Citation2022), and all of the best cure risk/rates reported on pasture-managed cattle (Pyman Citation1997; Laven et al. Citation2008). The comparisons between these studies strongly suggest that management system has the biggest impact on the cure risk of CHL (even greater than the speed of recognition of lameness), and that post-treatment management must always be considered as part of the optimal treatment strategy for lame cows. Nevertheless, it is important to identify that there is an absence of evidence that the strategy of managing lame cows in close proximity to the milking parlour does improve lameness cure risk, and, if it does, what the optimal regime is, particularly in regard to how long cows should be kept in the lame group. Having a separate group of lame cows is not without costs or potential welfare impact (grass availability is often lower and re-introduction to the main herd may result in increased experience of agonistic behaviour).
Appropriate post-treatment management also includes defining when an animal should be re-examined and re-treated in the face of poor treatment response. NZ dairy industry advice is that animals should be re-examined if lameness worsens or does not improve within 7 days (DairyNZ Citation2017), although this was based on expert opinion rather than published evidence. This study does provide some evidence to corroborate the advice that lame animals that have not improved within 7 days should be re-examined. Farmers and veterinarians should have systems in place to monitor and manage the re-treatment of lame animals.
Differences were identified in lameness cure rates between farms, despite the animals undergoing the same treatment protocols by the same veterinarian and similar management post-treatment (within 200 m of milking parlour, regular monitoring for treatment failure and milked once per day). Thus, much of the variation in the treatment itself was removed. We do not know why the differences between farms occurred, but HRR on the farm with the most rapid lameness cure rates was two times higher than on the farm with the slowest cure rates. Further investigation into the reasons between farm differences may provide some insight into lameness risk factors and possible improvements in lameness treatment, particularly with respect to after care. Validating and using continuous precision livestock farming systems for LS in the future may highlight these farms, allowing benchmarking and investigations into why cure rates were different between farms.
It is important to note that the current findings may not be extended to all New Zealand dairy farms. All five farms were located within the Waikato region and carried out at a similar time of year (late spring, early summer). There have been reported differences in month of peak lameness incidence between North and South Islands (Chesterton et al. Citation2008; Gibbs Citation2010), and it is not known whether cure rates of lameness identified later in lactation would be different to those identified earlier in lactation. Furthermore, these farms were conveniently selected due to historical study compliance of the farm owners and managers, and these farmer behavioural traits may also flow on to how they handle stock. Finally, the lesion type was predominantly white line, with little primary sole lesions and no axial wall lesions. While the proportion of lameness attributable to white line disease is increasing in New Zealand (Gibbs Citation2010; Lawrence et al. Citation2011), the proportion noted in this report is greater than those previous reports.
There were some limitations with the internal validity of the data. One potential source of bias with this study design was the farmer-reporting of lameness cases, as described previously in this discussion. Whilst the specificity and positive predictive value of included lameness cases was increased in this study as both farmers and trained technicians had to record the animal as lame, the low sensitivity of lameness detection in New Zealand (Fabian et al. Citation2014) suggests that there would have been unidentified lame cows present within the enrolled herds. Cows identified lame by New Zealand farmers have both a greater LS at diagnosis, and a greater duration of lameness compared to those identified by trained dedicated observers (Alawneh et al. Citation2012a). Therefore, while the lame animals identified in this current study represent lame animals typically identified and treated by NZ farmers, they likely represent lame animals on the more severe and chronic spectrum of the disease. Chronicity of lameness is an important predictor of cure risk (Thomas et al. Citation2015, Citation2016) with shorter time to lameness identification being associated with improved cure risks (Groenevelt et al. Citation2014). There was also a potential bias with the non-parametric KM estimate used to report time to cure. As is common with most medical time-to-event data, the data were interval-censored with LS occurring at a median of every 4 days. The KM estimate assumes that the moment of the event (in this case lameness cure) occurs at the time of observation. In reality, the animal may have become sound at any stage between two LS events. Other estimates, such as the Turnbull estimate, provide methods to account for interval-censoring. The KM estimate was used here despite this limitation for several reasons. Firstly, the interval length between LS events was biologically small (median of 4 days). Thus, the impact of this bias is likely to be very small and not biologically relevant. Secondly, and consequently, the communication of KM methods is well used and understood in the veterinary profession. The methods defining KM estimates and their variance are more straightforward than those for interval censored data, and reporting of KM outcomes enables more ready comparisons between studies, including for different disease processes if desired. The implication of both farmer diagnosis and interval-censored data is that the estimates presented may be conservative, and that the true lameness cure rates on these farms may be even more rapid. Finally, as the technician and veterinarian were both employed by the same company, it was possible that unconscious bias was occurring from the technician with LS. While this is highly unlikely from a trained research technician, this bias cannot be completely ignored.
Despite these limitations, this descriptive study provides evidence that rapid times to non-lameness and soundness are possible on New Zealand dairy farms, and that cure rates can differ between farms. Knowledge on expected recovery rates can be used at the farm level, by identifying animals that should be re-examined if still lame after x days, and also at the industry level, by identifying and investigating why certain farms have more rapid lameness cure rates than other farms. Importantly, these data provide further evidence that the management of lame cattle on pasture can positively benefit their welfare and recovery times.
Supplemental Material
Download PDF (193.2 KB)Acknowledgements
The authors acknowledge all of the staff on the five enrolled farms for their help and support throughout the study, and the Veterinary Enterprises Group for being supportive and flexible with staff during the course of the study. Specific thanks to the lead technician Anna Wilson, who did an excellent job of managing and arranging the logistics of this study. And to DairyNZ, Sustainable Food and Fibres Futures, Boehringer-Ingelheim and the Dairy Cattle Veterinarians branch of the NZVA for their generous sponsorship of this study.
References
- Alawneh JI, Laven RA, Stevenson MA. Interval between detection of lameness by locomotion scoring and treatment for lameness: a survival analysis. The Veterinary Journal 193, 622–5, 2012a. https://doi.org/10.1016/j.tvjl.2012.06.042
- Alawneh JI, Stevenson MA, Williamson NB, Lopez-Villalobos N, Otley T. The effect of clinical lameness on liveweight in a seasonally calving, pasture-fed dairy herd. Journal of Dairy Science 95, 663–9, 2012b. https://doi.org/10.3168/jds.2011-4505
- Archer S, Bell N, Huxley J. Lameness in UK dairy cows: a review of the current status. In Practice 32, 492–504, 2010. https://doi.org/10.1136/inp.c6672
- Black RA, van Amstel SR, Krawczel PD. Effect of prepartum exercise, pasture turnout, or total confinement on hoof health. Journal of Dairy Science 100, 8338–46, 2017. https://doi.org/10.3168/jds.2016-12082
- Chawala AR, Lopez-Villalobos N, Margerison JK, Spelman RJ. Genetic and crossbreeding parameters for incidence of recorded clinical lameness in New Zealand dairy cattle. New Zealand Veterinary Journal 61, 281–5, 2013. https://doi.org/10.1080/00480169.2013.763751
- Chesterton RN, Lawrence KE, Laven RA. A descriptive analysis of the foot lesions identified during veterinary treatment for lameness on dairy farms in north Taranaki. New Zealand Veterinary Journal 56, 130–8, 2008. https://doi.org/10.1080/00480169.2008.36821
- *DairyNZ. Lameness Field Guide: A Farmer’s Guide to Treating Lameness. https://www.dairynz.co.nz/publications/animal/lameness-field-guide/ (accessed 20 April 2023). DairyNZ, Hamilton, NZ, 2017
- *DairyNZ. Identifying Lame Cows. https://www.dairynz.co.nz/animal/cow-health/lameness/identifying-lame-cows/ (accessed 20 April 2023). Dairy NZ, Hamilton, NZ, 2023
- Dippel S, Dolezal M, Brenninkmeyer C, Brinkmann J, March S, Knierim U, Winckler C. Risk factors for lameness in freestall-housed dairy cows across two breeds, farming systems, and countries. Journal of Dairy Science 92, 5476–86, 2009. https://doi.org/10.3168/jds.2009-2288
- Ekanayake S, Kumara Y, Laven L, Mueller K, Pushpakumara P, Laven R. The relationship between locomotion score and reproductive performance on an up-country largescale commercial dairy farm in Sri Lanka. Sri Lanka Veterinary Journal 68, 1–9, 2022. https://doi.org/10.4038/slvj.v68i1-2.55
- Fabian J, Laven RA, Whay HR. The prevalence of lameness on New Zealand dairy farms: a comparison of farmer estimate and locomotion scoring. The Veterinary Journal 201, 31–8, 2014. https://doi.org/10.1016/j.tvjl.2014.05.011
- Freeman J, Hutchison GB. Prevalence, incidence and duration. American Journal of Epidemiology 112, 707–23, 1980. https://doi.org/10.1093/oxfordjournals.aje.a113043
- *Gibbs SJ. Dairy lameness in the South Island. In: Proceedings of the Australasian Dairy Science Symposium. Pp 424–7. Caxton Press. Christchurch, NZ, 2010
- Griffiths BE, Grove White D, Oikonomou G. A cross-sectional study into the prevalence of dairy cattle lameness and associated herd-level risk factors in England and Wales. Frontiers in Veterinary Science 5, 65, 2018. https://doi.org/10.3389/fvets.2018.00065
- Groenevelt M, Main DCJ, Tisdall D, Knowles TG, Bell NJ. Measuring the response to therapeutic foot trimming in dairy cows with fortnightly lameness scoring. The Veterinary Journal 201, 283–8, 2014. https://doi.org/10.1016/j.tvjl.2014.05.017
- Hernandez-Mendo O, von Keyserlingk MAG, Veira DM, Weary DM. Effects of pasture on lameness in dairy cows. Journal of Dairy Science 90, 1209–14, 2007. https://doi.org/10.3168/jds.S0022-0302(07)71608-9
- Klawitter M, Braden TB, Müller KE. Randomized clinical trial evaluating the effect of bandaging on the healing of sole ulcers in dairy cattle. Veterinary and Animal Science 8, 100070, 2019. https://doi.org/10.1016/j.vas.2019.100070
- Laven RA, Lawrence KE, Weston JF, Dowson KR, Stafford KJ. Assessment of the duration of the pain response associated with lameness in dairy cows, and the influence of treatment. New Zealand Veterinary Journal 56, 210–7, 2008. https://doi.org/10.1080/00480169.2008.36835
- Lawrence KE, Chesterton RN, Laven RA. Further investigation of lameness in cows at pasture: an analysis of the lesions found in, and some possible risk factors associated with, lame New Zealand dairy cattle requiring veterinary treatment. Journal of Dairy Science 94, 2794–805, 2011. https://doi.org/10.3168/jds.2010-3643
- McLellan KJ, Weary DM, von Keyserlingk MAG. Effects of free-choice pasture access on lameness recovery and behavior of lame dairy cattle. Journal of Dairy Science 105, 6845–57, 2022. https://doi.org/10.3168/jds.2021-21042
- Miguel-Pacheco GG, Thomas HJ, Huxley JN, Newsome RF, Kaler J. Effect of claw horn lesion type and severity at the time of treatment on outcome of lameness in dairy cows. The Veterinary Journal 225, 16–22, 2017. https://doi.org/10.1016/j.tvjl.2017.04.015
- Pedersen S, Wilson J. Early detection and prompt effective treatment of lameness in dairy cattle. Livestock 26, 115–21, 2021. https://doi.org/10.12968/live.2021.26.3.115
- Pinheiro Machado Filho LC, Gregorini P. Editorial: grazing behavior and welfare of ruminants. Frontiers in Veterinary Science 9, 890289, 2022. https://doi.org/10.3389/fvets.2022.890289
- Pyman MFS. Comparison of bandaging and elevation of the claw for the treatment of foot lameness in dairy cows. Australian Veterinary Journal 75, 132–5, 1997. https://doi.org/10.1111/j.1751-0813.1997.tb14173.x
- Thomas HJ, Miguel-Pacheco GG, Bollard NJ, Archer SC, Bell NJ, Mason C, Maxwell OJR, Remnant JG, Sleeman P, Whay HR, et al. Evaluation of treatments for claw horn lesions in dairy cows in a randomized controlled trial. Journal of Dairy Science 98, 4477–86, 2015. https://doi.org/10.3168/jds.2014-8982
- Thomas HJ, Remnant JG, Bollard NJ, Burrows A, Whay HR, Bell NJ, Mason C, Huxley JN. Recovery of chronically lame dairy cows following treatment for claw horn lesions: a randomised controlled trial. Veterinary Record 178, 116, 2016. https://doi.org/10.1136/vr.103394
- Tranter WP, Morris RS. A case study of lameness in three dairy herds. New Zealand Veterinary Journal 39, 88–96, 1991. https://doi.org/10.1080/00480169.1991.35668
- Whay HR, Webster AJF, Waterman-Pearson AE. Role of ketoprofen in the modulation of hyperalgesia associated with lameness in dairy cattle. Veterinary Record 157, 729–33, 2005. https://doi.org/10.1136/vr.157.23.729
- *Non-peer-reviewed