
 ?Mathematical formulae have been encoded as MathML and are displayed in this HTML version using MathJax in order to improve their display. Uncheck the box to turn MathJax off. This feature requires Javascript. Click on a formula to zoom.
ABSTRACT
Aims
To explore animal- and herd-level risk factors influencing age at puberty in predominantly Holstein-Friesian dairy heifers managed in seasonal, pasture-based systems.
Methods
Heifers born in spring 2018 (n = 5,010) from 54 commercial dairy herds in New Zealand were visited on three occasions when the mean heifer age, within herd, was 10 (visit 1; V1), 11 (V2) and 12 (V3) months old. Blood samples were collected on each visit and liveweight, stature and anogenital distance (AGD) were measured at V2. Heifers were defined as having reached puberty at the first visit where blood progesterone was elevated (≥ 1 ng/mL). Animal-level response variables included pubertal status by V1, V2 and V3, and age at puberty (or age at V3 plus 31 days for those that had not attained puberty by V3). To explore herd-level management factors, farmers answered a questionnaire relating to animal location, land type, health, feeding, and management between weaning and mating. A partial least squares regression was undertaken to identify herd-level factors associated with the greatest influence on puberty rate within herd.
Results
The mean age at puberty was 352 (SD 34.9) days. Heavier animals at a greater proportion of expected mature liveweight based on their breeding value for liveweight, or animals with a higher breed proportion of Jersey and lower breed proportion of Holstein, were associated with earlier puberty. Herd puberty rates varied widely among enrolled herds, and averaged 20%, 39% and 56% by V1, V2 and V3, respectively. Liveweight, followed by breed and land type, had the greatest influence on the herd puberty rate. Heifer herds with a greater mean liveweight (absolute and proportion of expected mature weight) or greater Jersey proportion had more animals that reached puberty at any visit, whereas herds located on steep land or with greater Holstein breed proportions had lower puberty rates. Management-related factors such as vaccinations, provision of feed supplements, and weighing frequency were also herd-level risk factors of puberty but had less influence.
Conclusions and clinical relevance
This study highlights the importance of having well-grown heifers for increasing the chances of earlier puberty onset and the effect of breed and youngstock management to achieve growth targets. These outcomes have important implications for the optimal management of heifers to achieve puberty before their maiden breeding and for the timing of measurements to potentially incorporate a puberty trait in genetic evaluations.
KEYWORDS:
Introduction
The success of seasonal, pasture-based dairy systems in New Zealand is underpinned by effective herd reproductive performance. A seasonal calving system relies on a 365-day calving interval, which best aligns pasture supply with herd feed demand. A cow that becomes pregnant early in the seasonal breeding period will calve earlier in the subsequent production season, giving her the best chance to recover and prepare for the next pregnancy. In addition, early calving increases the length of a cow’s lactation, contributing to a greater milk yield compared with later calving cows (Macdonald et al. Citation2008). At the herd level, a greater proportion of the herd calving earlier contributes to increased milk production for that lactation and improved pregnancy rates during the subsequent breeding period, which allows herd improvement through culling for reasons other than fertility (DairyNZ Citation2017). Herd reproductive performance depends on a multitude of animal- and herd-level factors operating on adult and young stock. For youngstock, these include animal-level factors such as genetics, body condition and health, and at the herd-level, management factors which influence the onset of puberty prior to the breeding period (DairyNZ Citation2017).
The genetic contribution to herd reproductive performance is measured by the fertility estimated breeding value (FertEBV) (Pryce et al. Citation2014), using traits based on daughter reproductive performance in the first lactation and beyond (Bowley et al. Citation2015). Earlier-in-life traits that are positively correlated with fertility during lactation will offer the opportunity to accelerate genetic gains in fertility. In a unique herd of 550 heifers with diverse FertEBV (i.e. +5% and −5%), Meier et al. (Citation2021) reported that the positive FertEBV animals reached puberty 27 days earlier and at a liveweight 20 kg lighter than negative FertEBV animals, despite both groups growing at the same rate. Another trait, anogenital distance (AGD) in 29-month-old heifers, was also associated with fertility outcomes (Grala et al. Citation2021). Therefore, AGD and the age at which an animal reaches puberty are considered as potential traits for inclusion into the FertEBV to improve genetic gain for fertility.
A better understanding of the risk factors for puberty onset is required to optimise industry data collection of puberty traits for genetic evaluations. Variation in timing of puberty is mainly dependent on breed and liveweight, with nutrition, body condition and growth trajectory dictating the latter (Macdonald et al. Citation2005; McDougall et al. Citation2013; Handcock et al. Citation2021). Puberty among various strains of Holstein-Friesian is reported to occur when animals reach 43–55% of mature liveweight (McNaughton et al. Citation2002; Macdonald et al. Citation2007; Meier et al. Citation2021), while the recommended target liveweight for New Zealand dairy heifers at first breeding (15 months of age) is 60% of mature liveweight (Troccon Citation1993; DairyNZ Citation2017). In New Zealand pasture-based dairy systems, animals are required to conceive at 13–15 months of age, so an earlier onset of puberty is advantageous to allow more oestrous cycles before the breeding period begins, thereby improving the chances of earlier conception (Byerley et al. Citation1987). Meier et al. (Citation2021) identified several traits associated with heifer puberty rates at the animal level; however, to further understand the importance of the animal- and herd-level factors that influence the onset of puberty in commercial dairy herds, we measured puberty and fertility traits in a population of 5,010 animals across 54 commercial herds. Herein, we report the phenotypic associations between age at puberty and animal body measurements and determine key animal- and herd-level risk factors for puberty onset in Holstein-Friesian and Holstein-Friesian x Jersey dairy heifers managed in grazing systems.
Materials and methods
Herd selection and enrolment
With the approval of the NZ Dairy Core Database Access Panel (reference: CDAP#177), study herds were identified from the Dairy Industry Good Animal Database (DIGAD) using a set of criteria including Holstein-Friesian breed dominance, high quality data recording, herd testing at least twice in the previous season, and at least five different sires represented in the 2018-born heifer cohort. For logistical purposes, animal grazing locations were restricted to the Waikato, Taranaki, or North Otago regions. The study was approved by the AgResearch Animal Ethics Committee (Hamilton, NZ) prior to commencement (#14448).
Owners of potential study herds were encouraged by letter to participate, followed up by a telephone call. Participants were provided with a detailed experimental plan and asked to provide written consent as well as access to electronic databases containing their herd records. Four veterinary research providers were also contracted to service the study requirements.
Study population and animal measures
The study population consisted of 5,010 spring-2018-born Holstein-Friesian or Holstein-Friesian x Jersey animals from 54 commercial herds. The animals were located across three regions of New Zealand; Waikato (n = 35 herds; 3,206 (64%) enrolled animals), Taranaki (n = 15 herds; 1,253 (25%) enrolled animals) and North Otago (n = 4 herds; 551 (11%) enrolled animals). Animal characteristics including birth date, sire and dam information, breed proportions (including Holstein, Friesian, Jersey, Ayrshire), and breeding values (BV) were extracted from DIGAD in June 2021. Data were collated in Excel (Microsoft Corporation, Redmond, WA, USA).
The herds were visited on three occasions at monthly intervals when the mean age in each herd was 10, 11 and 12 months old (visit V1, V2 and V3, respectively). These visits occurred between May and August 2019 for each of the 54 herds. The timing of the visits was designed so that, on average, the heifers were 327 days old at V2 and, based on a stochastic fertility model (Dennis et al. Citation2018), would be expected to have reached puberty. Blood samples were collected from all study animals present at each of the three visits to determine plasma progesterone (P4) concentrations. Blood was collected from the coccygeal vessel into blood tubes containing lithium heparin (BD Vacutainers; BD New Zealand, Auckland, NZ) and placed on ice immediately after collection. Samples were transported to a laboratory on the day of collection, or the next morning, and were then centrifuged (at 4°C, 1,900g for 12 minutes) with the plasma aspirated and stored in duplicate aliquots at −20°C until analysis. Centrifugation and plasma harvest were performed at three New Zealand sites: Waikato samples were processed at the DairyNZ Lye Farm, Hamilton; Taranaki samples at the Dairy Trust Taranaki Kavanagh Farm, Hawera; and North Otago samples at AgResearch Invermay, Mosgiel. To determine the P4 concentration in plasma, a commercial double antibody radioimmunoassay kit (ImmuChem Progesterone Double Antibody RIA; MP Biomedicals LLC, Irvine, CA, USA) was used following the manufacturer’s instructions but with reagents and samples or standards halved in volume (Meier et al. Citation2021).
Body measurements were collected at the single time point of V2 and included static liveweight, animal stature and AGD. Stature measurements were height, the vertical distance from the ground to the withers; and length, the horizontal distance from the top of the withers to the bottom of the pin bones (Macdonald et al. Citation2007). AGD was the distance in mm from the centre of the anus to the base of the clitoris (Gobikrushanth et al. Citation2017). The proportion of mature liveweight (PMLWT) was estimated from an individual animal’s liveweight BV using the formula: PMLWT = liveweight at V2 / (503 kg + individual animal liveweight BV) (DairyNZ Citation2016). Missing observations for animal measures are reported in .
Table 1. Descriptive statistics of grazing heifers (n = 5,004) from 54 dairy herds that had puberty traits collected on three occasions at approximately 10 (visit 1; V1), 11 (visit 2; V2) and 12 months of age (visit 3; V3).
Defining pubertal status
Animals were defined as having reached puberty at the first visit at which plasma P4 concentration was elevated (≥1 ng/mL), indicating that ovulation had occurred. Binary response variables included whether the heifer was post-pubertal (1) or pre-pubertal (0), at V1, V2 or V3. Age at puberty was defined as a continuous response variable by the age in days at the first visit at which P4 was ≥1 ng/mL. If P4 did not exceed 1 ng/mL at any of the visits, the animal’s age at puberty was right-censored and assigned as their age at V3 plus 31 days.
Heifer management survey
An online questionnaire to collect information on herd-level factors that may have influenced puberty onset was developed using a ClickDimensions (Dynamics 365, Atlanta, GA, USA) marketing package within DairyNZ’s Customer Relationship Management (CRM) system. The topics covered heifer mob location and management between weaning and mating; herd owner awareness of and attitudes towards heifer growth and liveweight targets; and animal health and disease prevention practices. The questionnaire was sent to enrolled farmers via email, and non-responders were followed up initially by a reminder email and subsequently by telephone. A copy of the questionnaire is provided in Supplementary Material. If a farmer reared heifers at more than one location, each heifer-location was considered as a distinct heifer rearing site in our analysis; thus, there were 58 heifer groups from the 54 farms enrolled. Questionnaire responses were stored within the CRM and later input into Microsoft Excel before analyses. Explanatory variables were formatted for analysis and are described in Supplementary Table 1. Continuous explanatory variables included heifer cohort size, the herd mean and SD for liveweight and PMLWT at V2, mean age at V2 and breed proportions (Holstein, Friesian, and Jersey). Explanatory variables with two possible responses to questions described in Supplementary Table 1 were coded as binary variables (0 = no, 1 = yes).
Nominal variables with more than two responses were converted to dummy indicator variables, with one category treated as the referent. For ordinal variables with more than two responses, the ordered levels were treated as continuous variables as described in Supplementary Table 1. Numerical and integer values were described in terms of their mean (SD) in text and tables, while categorical values were described as proportions (count) in tables and proportions in text.
Statistical analysis
Data cleaning was performed in R Studio version 4.0.5 (R Foundation for Statistical Computing, Vienna, Austria, 2021). Animals without an animal identifier or birth date were removed (n = 6), leaving 5,004 animals in the dataset. Age at puberty was estimated for animals with P4 results from all three sampling visits (n = 4,978). Animals missing sire or dam information (n = 295), animal measures (n = 149 animals missing 1–4 observations) or BV (n = 378) were retained in the final dataset for analyses (). Statistical analyses were performed using SAS 9.4 (SAS Institute, Cary, NC, USA, 2016).
Analysis of animal-level risk factors influencing onset of puberty
To investigate the chances of an animal being pubertal by each visit, the binary response variables of post-pubertal (1) or pre-pubertal (0) at V1, V2 or V3 were used. In total, 15 multivariable logistic regressions were undertaken for each of the animal measures collected at V2 (n = 5; predictors: liveweight, PMLWT, height, length and AGD; continuous variables) for each visit (n = 3; outcome: onset of puberty at V1, V2 or V3). Each model was built sequentially, adjusting for age at V2, Holstein and Jersey breed proportions and herd as a random effect, before the predictor. There were 75 animals missing all five animal-based measures, and therefore, 4,929 individual animals were included in these animal-level models.
Liveweight, PMLWT, height, length, AGD, age at V2, and breed were checked for multicollinearity for each visit before multivariable logistic regression analysis was undertaken to investigate the animal-level risk factors of puberty onset for each of the visits. Liveweight and PMLWT were highly correlated, and their variance inflation factors (VIF) were > 10 (VIF = 39.1 and 34.6, respectively) when all eight variables were included. When either liveweight or PMLWT were included one at a time with height, length, AGD, age at V2, and breed, there were no variables that were highly correlated or had VIF > 10. Therefore, two separate models were constructed including seven variables each for multivariable logistic regression. The first model included all aforementioned variables except PMLWT. In the second model, liveweight was replaced with PMLWT. The model was built sequentially by first adjusting for age at V2 (in days; calculated as the difference between the calendar date at V2 and the individual animal’s birth date), and breed proportions and, finally, the predictor. Herd was included as a random effect. Relative risks were calculated for all logistic regression models (Zhang and Yu Citation1998), where p = risk in the pre-pubertal group:
A Cox proportional hazard model was used to estimate the survival time (days) to puberty adjusted for liveweight, PMLWT, height, length and AGD. Age at V2 and Holstein and Jersey breed proportions were fitted as potential confounders, and herd was included as a random effect. As previously described, two separate models were generated, including either the absolute and/or the proportional liveweight variables, and results presented are based on the two models as described above. Cox proportion hazard assumptions were checked using the residual method.
Analysis of herd-level risk factors influencing onset of puberty
To evaluate the ability of a combination of colinear variables to determine the proportion of the herd that was likely to have reached puberty by V1, V2 or V3, a partial least squares (PLS) regression was undertaken. A PLS approach enables reduction of a range of highly correlated predictors to a smaller set of components, from which the regression is performed (Wold et al. Citation2001). Although the questionnaire response rate was 54/58 (93%), not all questions were answered sufficiently. As the PLS regression requires a complete dataset for all predictors, complete sets of answers from 39 distinct heifer groups were available for these analyses. Three separate analyses were completed with the outcomes of interest being the proportion of heifers in each herd that had reached puberty by V1, V2 or V3. There were 42 potential predictor variables eligible to be included in the final models (Supplementary Table 1). Jersey and Holstein breed proportions were kept in the PLS model to account for the potential confounding effect of breed on timing of puberty onset (Burke et al. Citation1998). All 42 eligible predictor variables were included in all starting models for V1, V2 and V3. The final model was derived using manual backward stepwise elimination, and the model re-run with one less predictor until a parsimonious model was attained with the lowest predictive residual sum of squares followed by optimal predictive power (maximised R2 value). The predictive R2 value was calculated using cross-validation and the leave-one-out technique (Wold et al. Citation2001).
The backwards elimination process involved removal of the predictor of lowest influence using an iterative process (one at a time). The predictor removed from the model was that with the least influence based on a standardised coefficient closest to zero and the lowest variable importance in projection (VIP) among all variables in the remaining model. The VIP represents the weighted contribution of each variable within the PLS predictor that explains the variance in the response (Wold et al. Citation2001), so a low VIP value indicates little influence of that variable on the model. For nominal variables with several categories (e.g. region), all individual indicator variables had to be non-influential before the whole class variable could be removed. Only the results from the final models of each of the three outcome variables are presented.
Results
Descriptive statistics for the enrolled animals and herds
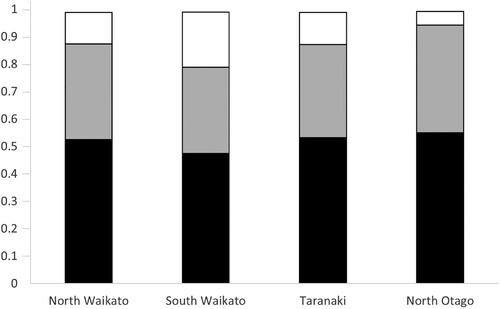
Animal characteristics including breed and the animal measures collected from the study population are presented in . Mean (SD) animal ages at each visit were 299 (SD 14.4) days, 327 (SD 14.5) days, and 355 (SD 14.6) days at V1, V2 and V3, respectively. At V2, the mean animal weighed 226 (SD 34.1) kg, was 43 (SD 6.1)% of mature liveweight, and measured 115 (SD 4.8) cm in height and 105 (SD 5.9) cm in length. The mean AGD at V2 was 81 (SD 10.3) mm, with a large range observed (min 45, max 124 mm). The breeds Holstein and Friesian were most represented within herds throughout the three regions (). The proportion of Jersey was numerically highest among animals from herds located in South Waikato, followed by Taranaki. The heifer groups came from herds with a mean herd size of 432 (SD 234) lactating cows and the mean size of the 2018-born cohort was 86 (SD 41) heifers. Animals were managed by herd owners or their staff at home (18%) or at a run-off (41%) or were managed off-farm by contracted graziers (41%).
Figure 1. Proportion of Holstein (black), Friesian (grey) and Jersey (white) breeds represented in dairy heifers (n = 5,004) from herds (n = 54) in North Waikato, South Waikato, Taranaki, and North Otago regions included in a study of risk factors associated with the onset of puberty.
Animal-level risk factors for age at puberty
The mean age at puberty was 352 (SD 34.9) days, and 20% (IQR 3.8–31.3%) of animals across all herds attained puberty by V1, 39% (IQR 16.6–55.6%) by V2, and 56% (IQR 33.4–79.8%) by V3 (). A total of 2,226 animals (44%; n = 2,226/5,010) did not exhibit elevated plasma P4 concentration at any visit and were assumed not to have reached puberty during or before the study period. These animals were subject to right-censoring in the continuous age at puberty estimation.
Associations between individual animal-level risk factors and the likelihood of an animal reaching puberty by each of the visits are presented in . After accounting for actual age at V2 and Holstein and Jersey breed proportions, animals with greater liveweight (absolute and proportional) and stature (height and length) at V2 had a greater likelihood of reaching puberty by V1, V2 and V3 when these factors were considered as individual predictors (p < 0.001). For every 10 kg increase in liveweight (measured at V2), animals had a 20% (RR 1.20 (95% CI = 1.16–1.24)) greater chance of being pubertal at V1, a 17% (RR 1.17 (95% CI = 1.15–1.19)) greater chance at V2 and a 14% (RR 1.14 (95% CI = 1.12–1.15)) greater chance at V3. Similarly, a 1% increase in PMLWT (measured at V2) led to an 8–12% greater chance of an animal having reached puberty by each of the visits. For body stature, a 1 cm increase in height measured at V2 increased the chances of an animal reaching puberty at V1, V2 or V3 by 2.6, 3.3 and 2.9%, respectively; and a 1 cm increase in length measured at V2 increased the chance of an animal reaching puberty by 4.6, 3.8 and 4.6%, respectively, (). AGD was not associated with whether an animal was pubertal or not by V1 and V2, but there was an association with pubertal status at V3. For every 10 mm increase in AGD (measured at V2), animals had a 9% (RR 1.09 (95% CI = 1.05–1.12)) greater chance of reaching puberty by V3.
Table 2. Individual risk factors associated with the likelihood of an animal reaching puberty in a population of 5,004 grazing heifers across 54 herds. Fifteen separate multivariable logistic regression model outputs for the effects of liveweight, height, length, anogenital distance (AGD), or proportion of mature liveweight (PMLWT) measured at visit 2 (V2) are presented for the chance of an animal being pubertal or not by visit 1 (V1), visit 2 (V2) or visit 3 (V3), after adjusting for age at V2, and Holstein and Jersey breed proportions, with herd included as a random effect (for each model).
For the analysis of the combined effect of the animal-level risk factors, due to collinearity between the liveweight and PMLWT variables, two separate models were constructed. The estimates for the height, length, AGD, age at V2 and breed were stable between the two models irrespective of whether liveweight or PMLWT was included. Liveweight is a more practically applicable animal-based measure at the farm level, and therefore, for brevity, the results from the liveweight model are presented (). The results for the PMLWT variable only are also presented from the alternative second model within this table. When all animal-level risk factors were considered together in the multivariable logistic regression, liveweight, PMLWT, Jersey proportion and actual age at V2 were consistently associated with the chances of an animal being pubertal by V1, V2 and V3 (). All else being equal, a heavier (absolute and proportional), older animal (at V2) with a greater Jersey breed proportion was more likely to have reached puberty than its herd mates, regardless of visit. In addition to these four predictors, height (measured at V2) was also important in predicting V1 pubertal status, but it was animals that were shorter that had a greater chance of having reached puberty by V1 when all other parameters were kept the same. Additional risk factors associated with the likelihood of an animal having reached puberty by V3 included Holstein proportion, length and AGD. An animal with a longer withers to tailbone distance, a greater AGD, and a lesser proportion of Holstein was more likely to reach puberty by V3.
Table 3. Combined risk factors associated with the likelihood of an animal reaching puberty in a population of 5,004 grazing heifers across 54 herds. Multivariable logistic regression model outputs for the effects of age at visit 2 (V2), Holstein and Jersey breed proportions, liveweight, height, length, anogenital distance (AGD), and proportion of mature liveweight (PMLWT) on the chances of an animal being pubertal at visit 1 (V1), V2 or visit 3 (V3) with herd included as a random effect.
The results from the Cox proportional hazard model analysis to determine the associations between animal-level risk factors and the hazard of puberty are presented in . The risk factors that influenced the hazard of puberty were liveweight, PMLWT, and Jersey and Holstein breed proportions. For every 1% increase in PMLWT (measured at V2), an animal was 11% more likely (HR 1.11 (95% CI = 1.09–1.12)) to have reached puberty at any given age. For example, at 300 days (approx. V1), an animal that was 45% of mature liveweight (measured at V2) is 1.11 times more likely to be pubertal than an animal at 44% of her mature liveweight. Likewise, for every 10 kg increase in liveweight (measured at V2) an animal was 19% more likely (HR 1.19 (95% CI = 1.16–1.22)) to have reached puberty at any given age. An animal with 10% greater Jersey breed composition was 17% more likely (HR 1.17 (95% CI = 1.11–1.23)) to have reached puberty by any given age, whereas a more Holstein breed composition (10% increase) was 5% less likely to reach puberty at any given age (HR 0.95 (95% CI = 0.90–1.00)).
Table 4. Results of Cox proportional hazards model and HR (95% CI) for the effect of liveweight, proportion of mature liveweight (PMLWT), height, length and anogenital distance (AGD) on the hazard of puberty for dairy heifers (n = 5,004, from 54 herds). Age at visit 2 (V2; approximately 11 months of age) and proportion Holstein and Jersey were included in the model as potential confounders and herd was included as the random effect.
Herd-level risk factors for age at puberty
The final response rate for the survey of herd-level factors associated with the onset of puberty was 50/54 (93%) farmers. We observed large variation in the rates of puberty between herds and between visits (). Complete data were available for 39 heifer groups for the PLS regression analysis to investigate herd-level risk factors associated with the proportion of heifers in a herd that had reached puberty at V1, V2 and V3, with results presented in (respectively). The timing of these visits was predetermined using a modelling approach (Dennis et al. Citation2018) to capture a point in time when about 45% of the heifers had attained puberty. Regardless of visit, the variables that were common predictors of herd puberty rate and their direction of association, included herd mean and SD of liveweight (measured at V2; both positive), herd mean PMLWT (measured at V2; positive), mean Holstein and Jersey breed proportions, weighing frequency (negative), whether farmers thought that heifers were reaching their growth targets (positive), and preferential feeding of supplements to smaller animals (negative).
Figure 2. Cumulative percentage of heifers (n = 5,004) within each of the 58 heifer groups that had elevated blood progesterone (>1 ng/mL) indicating puberty attained by visit 1 (black; heifers approximately 10 months old), visit 2 (grey; heifers approximately 11 months old) or visit 3 (white; heifers approximately 12 months old).
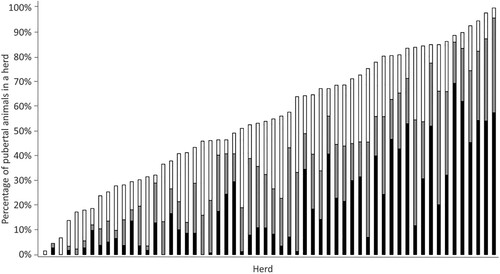
Table 5. Herd-level risk factors influencing the proportion of heifers in a dairy herd that had reached puberty when the mean age of heifers (n = 5,004, from 54 herds) was 299 days (at visit 1Table Footnotea). Partial least squares model outputs are presented including raw and standardised regression coefficients, and variable importance in projection (VIP) values for the first component.
Table 6. Herd-level risk factors influencing the proportion of heifers in a dairy herd that had reached puberty when the mean age of heifers (n = 5,004, from 54 herds) was 327 days (at visit 2Table Footnotea). Partial least squares model outputs are presented including raw and standardised regression coefficients, and variable importance in projection (VIP) values for the first component.
Table 7. Herd-level risk factors influencing the proportion of heifers in a herd that had reached puberty when the mean age of heifers (n = 5,004, from 54 herds) was 355 days (at visit 3Table Footnotea). Partial least squares model outputs are presented including raw and standardised regression coefficients, and variable importance in projection (VIP) values for the first component.
The final model that best explained the variation in herd puberty rate by V1 contained 10 predictor variables and two components () with an adjusted R2 of 63% (unadjusted R2 = 0.72) and root mean squared error of 0.61. Components are linear combinations of the predictor variables that explain both variation in the response and predictors. The first component accounted for 64% of the variation (unadjusted R2) and the variables with the greatest loading for factor 1 were herd mean PMLWT and liveweight ((a)) where both variables had a positive association with herd puberty rate. The second component explained a further 8% of the variation (unadjusted R2), and the variables of greatest influence were the SD of absolute and proportional liveweight (positive) and breed differences. A larger proportion of heifers reached puberty by V1 in herds with greater mean PMLWT, liveweight, and greater SD of absolute and proportional liveweight (i.e. greater variation in absolute and proportional liveweight). Herds that had a greater Jersey content had more heifers pubertal by V1 compared with herds that had more Holstein or Friesian breed proportions. Other predictors with less influence in the model that were negatively associated with herd puberty rate at V1 were weighing frequency and preferential feeding of supplements. More frequent weighing of heifers and preferential feeding of supplements to smaller or lighter animals was associated with fewer heifers reaching puberty at V1. Further, predictors with less influence in the model that were positively associated with herd puberty rate were those where farmers perceived that heifers were reaching growth targets and where heifers were vaccinated against leptospirosis. Under these two scenarios a greater proportion of heifers reached puberty at V1. Most herd owners (33/39) stated that they vaccinated against leptospirosis.
Figure 3. Correlation loading plots for the partial least squares (PLS) model of herd-level risk factors influencing the proportion of heifers in a herd that had reached puberty by (a) visit 1 (heifers approximately 10 months old), (b) visit 2 (heifers approximately 11 months old), and (c) visit 3 (heifers approximately 12 months old). Component 1 explains a proportion of the variation in the response, and the variables furthest from 0 along the x-axis (a greater X-loading value) have the greatest influence (represented by the vector arrows). Component 2 explains an additional proportion of the variation in the response and the variables furthest from 0 along the y-axis have the greatest influence (represented by the vector arrows). The vector arrows represent the X-loadings (at 4× scale for ease of interpretation) for each predictor that comprises each PLS component. The black dots represent the X-scores for each herd.
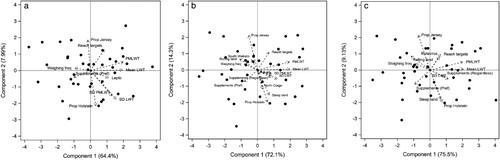
The final model revealing the herd-level predictors affecting the proportion of the herd that were pubertal by V2 had 15 predictors and five components (), with an adjusted R2 of 86% (unadjusted R2 = 0.91) and root mean squared error of 0.44. Again, the most influential positive predictors contributing to the first predictors were herd mean PMLWT and liveweight ((b)), which explained 72% of the variation (unadjusted R2) in herd puberty rate by V2. Breed differences and land type were the most influential predictors contributing to the second predictor, which explained a further 14% of the variation (unadjusted R2). As previously observed, Jersey proportion was positively associated, and Holstein proportion was negatively associated with herd puberty rate. Compared with flat land type, herds with heifers reared on steep land had lower puberty rates, whereas herds on rolling land had greater rates of puberty by V2. Other variables with less influence included region (South Waikato and North Otago herds had lower puberty rates and Taranaki herds had greater puberty rates compared with referent herds in North Waikato) and whether supplements were fed regardless of season (which was associated with more heifers reaching puberty at V2) and the SD of both liveweight and PMLWT (greater variation in absolute and proportional liveweight was associated with more heifers reaching puberty at V2). Additionally, variables with less influence that were negatively associated with herd puberty rate at V2 included feeding of supplements in a preferential manner to smaller animals (which was associated with fewer heifers reaching puberty at V2) and weighing frequency (more frequent weighing of heifers was associated with fewer heifers reaching puberty at V2).
The proportion of the herd pubertal by V3 was best predicted by a model with 12 variables and 2 components (), with an adjusted R2 of 79% (unadjusted R2 = 0.85) and root mean squared error of 0.49. As for the V1 and V2 PLS models, the most influential variables in the first component were herd mean PMLWT and liveweight (unadjusted R2 = 76%; (c)), which were positively associated with herd puberty rates. Breed differences and land type were most influential in the second component, explaining a further 9% of the variation (unadjusted R2). Similar relationships were observed for breed as for the earlier visits. Herds located on either steep or rolling land types had lower puberty rates by V3, compared with herds on flat land. While they were less influential variables in the model, preferential feeding of supplements and weighing frequency were negatively associated with herd puberty rate at V3, with preferentially fed and more frequently weighed herds having fewer heifers at puberty by V3. Other, less influential variables that were positively associated with herd puberty rate at V3 included farmer perception that heifers were reaching targets and where there was greater variation in absolute and proportional liveweight (i.e. SD of liveweight and PMLWT). Herds that vaccinated against rotavirus (9/39) had an increased proportion of the herd pubertal by V3 ().
Discussion
The dataset collected from 5,010 peripubertal animals provides a unique opportunity to characterise the onset of puberty in grazing dairy systems on a large scale, and to explore the animal- and herd-level associations with age at puberty. Furthermore, our study provides insight that could improve the methodologies used to capture novel traits in a commercial farm setting.
The mean age at puberty of 352 (SD 35) days was estimated from 4,978 animals with available data and is consistent with that reported in the literature for Holstein-Friesian dairy heifers in New Zealand (Hickson et al. Citation2011; Meier et al. Citation2021). Our estimate of age at puberty was imperfect because our sampling approach resulted in left-, interval- and right-censoring when generating an age at puberty estimate for all animals. With the right-censored animals, a proportion of the 44% of pre-pubertal animals would have reached puberty between V3 and 31 days after, and a proportion would not have reached puberty even 31 days after V3. Moreover, the chance of false negatives must be acknowledged, as animals that were in oestrus at the time of sampling would have baseline levels of P4 and may appear to be pre-pubertal. A monthly interval between sampling was selected so that such animals could be identified as pubertal based on P4 concentrations at the subsequent sampling when the animals would be in a later stage of their oestrous cycle (Forde et al. Citation2011). More frequent samplings to obtain a more precise estimate of age at puberty were logistically impractical and cost-prohibitive due to the scale of the study, the diverse locations where animals were based, and the disruption this would have caused to normal farm practices. Nevertheless, our approach for estimating age at puberty was considered appropriate to explore the animal- and herd-level drivers of puberty onset in grazing dairy heifers, and to our knowledge is the largest prospective study of its kind.
The risk factors for puberty onset were similar across the animal- and herd-level risk factors. At the animal-level, the most important factors were liveweight, PMLWT and breed, whereby heavier or more Jersey-type heifers had an increased likelihood of reaching puberty by any of the visits. Interestingly, animals that were shorter at V1 had an increased chance of reaching puberty after adjusting for age, breed and liveweight, but the effect was not seen at later visit dates. At V3, animals that had a longer length from withers to tailbone had a greater chance of having reached puberty. Heifers in a New Zealand dairy system tend to grow at different rates depending on the stage of the season. Typically, growth rates tend to be lower from 6–12 months of age during summer and winter when feed quality and quantity may be restricted and increase in spring when pastures are lush and abundant (McNaughton and Lopdell Citation2012; Handcock et al. Citation2021). This seasonal pattern of growth affects body conformation and liveweight gain. Heifers growing in a non-linear fashion may have grown proportionately more in height at the expense of liveweight (Handcock et al. Citation2021), which may have contributed to a slight delay in the onset of puberty for those animals on-track to reach puberty early, whereas, by V3, well-grown animals in terms of both liveweight and frame size were more likely to have reached puberty by 12 months of age.
Anogenital distance has been highlighted as a potential indicator of cow fertility in recent years, with shorter AGD being associated with improved reproductive outcomes (Gobikrushanth et al. Citation2017; Grala et al. Citation2021). A relationship observed in the current study, however, was that a heifer with a 10 mm greater AGD had a 9% greater chance of reaching puberty by V3, which appears contradictory. In these previous studies, however, AGD was measured when animals were >28 months old, compared with our measurement at about 11 months old. Our contradictory finding may be due to an isometric growth pattern of animals when the AGD increases in proportion to body size in immature animals. Rajesh et al. (Citation2022) reported that AGD increased linearly from birth to approximately 16 months old, but the earliest age at which AGD was moderately correlated with AGD at breeding age was 6 months old. It is plausible that the relationship between AGD and reproductive performance outcomes becomes apparent at a later stage, after the animal reaches puberty, but these relationships could not be explored in the current study. Therefore, for AGD to be a useful predictor of fertility, the timing of measurement is an important consideration when designing future studies.
Corroborating the animal-level risk factor findings, the liveweight measures and breed proportions also emerged as strong influencers of puberty rate at the herd level. Herd-level mean liveweight and PMLWT were consistently identified as the most influential predictors within the first component of the PLS models and explained the greatest amount of variation in proportion of the herd that had attained puberty by each visit for each of the three PLS analyses. While of lesser importance, the SD of liveweight and PMLWT were also positively associated with the herd puberty rate, suggesting that herds with greater puberty rates had a greater spread of liveweights within herd. In our dataset, a greater SD of liveweight was also associated with greater mean herd liveweight, which appears to also be evident in the dataset published for heifers in seven pasture-based, spring-calving dairy herds by Hayes et al. (Citation2019). Due to all the associations between animal and management factors and the onset of puberty, it is not possible to determine exactly what is driving these associations. Nonetheless, our results highlight the importance of well grown heifers to promote earlier puberty onset, supporting what is already well known to farmers and reported in the scientific literature (Macdonald et al. Citation2007; Handcock et al. Citation2021).
It is, therefore, not surprising that management factors relating to heifer growth featured in the models as influential predictors associated with variation in herd puberty rate. For example, a greater puberty rate was observed in herds that had supplementary feeds offered to heifers as a standard management practice regardless of season or weather conditions, whereas a lower proportion of pubertal animals were observed in herds with preferential feeding for smaller or lighter animals. The latter strategy may have been performed as an intervention to improve growth rates in at-risk animals. The provision of supplementary feeds may allow for a more linear pattern of growth, which has been previously associated with earlier puberty onset when compared with a seasonal trajectory of varying growth rates (Handcock et al. Citation2021). Furthermore, when farmers thought that heifers were reaching growth targets, more animals in the herd were pubertal at each of the three visits. Surprisingly, however, weighing frequency was negatively associated with puberty rates, as herds that did not weigh their animals had a greater proportion of the herd reach puberty at an earlier visit. Farmers and graziers involved in heifer-rearing focus groups have reported that weighing tends to be more frequent when targets are not being met or the grazier–herd owner relationship is new, and as the relationship strengthens and targets continue to be met, animal liveweight monitoring becomes less important (Dirks et al. Citation2015). Taken together, heavier, more mature animals reached puberty earlier and this relationship was associated with farmers that routinely offered all animals supplements and were satisfied with their animals’ growth rates relative to target liveweights. Routine use of feed supplements, however, cannot be assumed as a causal relationship with greater puberty rates because we were unable to account for likely differences in forage-based metabolisable energy intakes among the herds.
Our analyses have revealed that breed was an important predictor influencing puberty onset, which has been well documented in the literature (Burke et al. Citation1998; Hickson et al. Citation2011; Handcock et al. Citation2021). Breeds that have heavier mature liveweights, such as Holsteins, are generally later maturing than lighter breeds such as Jerseys (Burke et al. Citation1998). In agreement with the animal-level risk factor analysis, a higher mean Jersey proportion within a herd contributed to a greater puberty rate by each of the three visits. Conversely, a lower proportion of pubertal heifers was observed in herds with a greater mean Holstein proportion, and the referent population, Friesians, were intermediate. Holsteins and Friesians are larger-framed animals with a heavier mature liveweight compared to Jerseys (Hickson et al. Citation2011; Handcock et al. Citation2021). As such, these heavier breeds have a later puberty onset as it takes them longer to grow to the liveweights necessary to achieve sexual maturation, whereas Jersey animals are known to be younger and lighter at the time of puberty onset (Leche Citation1971; Burke et al. Citation1998). Consequently, when designing future studies with large phenotype collection across a multi-breed population, breed must be considered to ensure that the timing of sampling is suitable to capture the age of puberty specific to the target breeds.
The region and terrain in which heifers were located were included as predictors of influence in several components of the PLS evaluating risk factors for herd puberty rate. Compared with herds in North Waikato, herds in North Otago and South Waikato had a lower proportion of heifers reach puberty by V2, whereas Taranaki herds had a greater proportion of the herd reach puberty at this time even though proportion Jersey was similar to North Waikato and nominally less than South Waikato. Regional differences in the puberty rate occurred at V2 but not at V1 and V3 and, while it is difficult to disentangle why this occurred, it is plausible that regional predictors such as climate and feed quality, which vary across months of the year and region, may have influenced the regional differences. Unfortunately, we did not record this information at the farm level, and therefore we are unable to explore these relationships further. In terms of terrain, heifers reared on steep land had lower puberty rates by V2 and V3 compared with those on flat land. On farms with steeper terrain, pasture allowance and quality may be reduced compared with a flat land environment. In addition, animals may have greater energy demands for pasture acquisition, which could contribute to poorer growth rates in animals, unless supplementary feeds are provided. Interestingly, rearing approach did not feature in any of the models, indicating that provided heifers were growing well, the person who managed the animals (owner/staff vs. contracted grazier) did not affect the proportion of heifers reaching puberty.
Although liveweight and breed proportions were identified as the most influential predictors within first and second components of the PLS, some aspects relating to animal health and disease prevention were also associated with herd puberty rates. Herds that were vaccinated against leptospirosis had a greater proportion of animals pubertal by V1, while vaccination against rotavirus was associated with more animals pubertal by V3. While disease status was not determined in the current study, leptospirosis, and diarrhoea (which can be caused by rotavirus; Barrington et al. Citation2002) have been demonstrated to inhibit development and growth of deer (Subharat et al. Citation2012) and dairy heifers (Donovan et al. Citation1998), respectively. These diseases could contribute to a delayed puberty onset relative to healthy animals. While our questionnaire was not designed to provide a comprehensive overview of heifer management, these vaccination policies may indicate a greater emphasis on animal health and disease prevention in some herds. Further research is needed to determine the relationships between leptospirosis and rotavirus with growth rates and puberty onset in dairy heifers.
We conclude that heavier animals at a greater PMLWT or with a greater Jersey breed proportion reach puberty earlier than their lighter or greater Holstein breed proportion herd mates. A large amount of variation was observed in herd puberty rates by each visit when the mean animal age was similar across herds. The PLS analyses revealed liveweight, breed and land terrain where heifers were located to be the most influential predictors contributing to the variation observed in the proportion of pubertal animals within a herd by 10–12 months of age. Herds with greater mean absolute and proportional liveweight, greater Jersey proportion, or reared on flat or rolling terrain had increased puberty rates. While less important, vaccination against leptospirosis and rotavirus, the routine provision of supplementary feeds to all animals, and farmers having a clear oversight on how their heifers were performing relative to liveweight targets were also identified as associative factors in more animals having reached puberty by each of the visits. Our results clearly highlight the importance of having well-grown heifers for increasing the chances of earlier puberty onset. They also highlight the effect of breed and some of the managerial features that underpin well-grown heifers that achieve an earlier age at puberty. These outcomes have important implications for the optimal management of heifers to achieve puberty before the onset of seasonal breeding in a grazing system, and for the design of industry data collection for puberty traits in genetic evaluations.
Supplemental Material
Download PDF (1.3 MB)Acknowledgements
We wish to gratefully acknowledge the 54 herd owners and their staff and contracted graziers who provided access to data and their 2018-born dairy heifers for sampling and measurements. We also acknowledge the support of LIC, CRV Ambreed, and New Zealand Animal Evaluation Ltd. (NZAEL) during herd enrolment into this study, as well as for the provision of animal records, particularly R. Bloxham (LIC), and J. Bryant and A. Young (formerly DairyNZ/NZAEL). We kindly thank the DairyNZ technical team (especially S. Morgan, K. Watkins, A. Knight, N. Leach, and J. Brown) and the participating veterinary clinics and their staff for sampling, lab analyses and data collection (especially E. Cuttance, VetEnt Te Awamutu; K. Goodare and S. McDougall, Anexa FVC Morrinsville; S. Bateman, Okato Vets; M. O’Sullivan, Veterinary Centre Oamaru). We also gratefully acknowledge the contributions of P. Amer and N. Dennis (AbacusBio Ltd.) in designing the approach to measure age at puberty. This study was funded by New Zealand dairy farmers through DairyNZ Inc. in partnership with the New Zealand Ministry of Business, Innovation and Employment [DRCX1302]. The authors have no conflicts of interest to declare.
References
- Barrington GM, Gay JM, Evermann JF. Biosecurity for neonatal gastrointestinal diseases. Veterinary Clinics of North America: Food Animal Practice 18, 7–34, 2002. https://doi.org/10.1016/S0749-0720(02)00005-1
- Bowley FE, Green RE, Amer PR, Meier S. Novel approaches to genetic analysis of fertility traits in New Zealand dairy cattle. Journal of Dairy Science 98, 2005–12, 2015. https://doi.org/10.3168/jds.2014-8266
- Burke JL, Purchas RW, Morris ST. A comparison of growth, carcass, and meat characteristics of Jersey- and Friesian-cross heifers in a once-bred heifer system of beef production. New Zealand Journal of Agricultural Research 41, 91–9, 1998. https://doi.org/10.1080/00288233.1998.9513291
- Byerley DJ, Staigmiller RB, Berardinelli JG, Short RE. Pregnancy rates of beef heifers bred either on puberal or third estrus. Journal of Animal Science 65, 645–50, 1987. https://doi.org/10.2527/jas1987.653645x
- *DairyNZ. Liveweight Targets. https://www.dairynz.co.nz/animal/heifers/liveweight-targets/ (accessed 24 June 2021). DairyNZ Ltd., Hamilton, NZ, 2016
- *DairyNZ. The InCalf Book for New Zealand Dairy Farmers. Second Edtn. DairyNZ Ltd., Hamilton, NZ, 2017
- Dennis NA, Stachowicz K, Visser B, Hely FS, Berg DK, Friggens NC, Amer PR, Meier S, Burke CR. Combining genetic and physiological data to identify predictors of lifetime reproductive success and the effect of selection on these predictors on underlying fertility traits. Journal of Dairy Science 101, 3176–92, 2018. https://doi.org/10.3168/jds.2017-13355
- *Dirks S, Lissaman T, Brazendale R. Weaning to milking, growing great heifers. SIDE Proceedings. Pp 278–94. Lincoln University, Lincoln, NZ, 2015
- Donovan GA, Dohoo IR, Montgomery DM, Bennett FL. Calf and disease factors affecting growth in female Holstein calves in Florida, USA. Preventative Veterinary Medicine 33, 1–4, 1998. https://doi.org/10.1016/S0167-5877(97)00059-7
- Forde N, Beltman ME, Lonergan P, Diskin M, Roche JF, Crowe MA. Oestrous cycles in Bos taurus cattle. Animal Reproduction Science 124, 163–9, 2011. https://doi.org/10.1016/j.anireprosci.2010.08.025
- Gobikrushanth M, Bruinjé TC, Colazo MG, Butler ST, Ambrose DJ. Characterization of anogenital distance and its relationship to fertility in lactating Holstein cows. Journal of Dairy Science 100, 9815–23, 2017. https://doi.org/10.3168/jds.2017-13033
- Grala TM, Price MD, Kuhn-Sherlock B, Burke CR, Meier S. Investigating anogenital distance and antral follicle count as novel markers of fertility within a herd of cows with positive or negative genetic merit for fertility traits. Journal of Dairy Science 104, 12939–52, 2021. https://doi.org/10.3168/jds.2020-19948
- Handcock RC, Jenkinson CMC, Laven R, McNaughton LR, Lopez-Villalobos N, Back PJ, Hickson RE. Linear versus seasonal growth of dairy heifers decreased age at puberty but did not affect first lactation milk production. New Zealand Journal of Agricultural Research 64, 83–100, 2021. https://doi.org/10.1080/00288233.2019.1607404
- Hayes CJ, McAloon CG, Carty CI, Ryan EG, Mee JF, O’Grady L. The effect of growth rate on reproductive outcomes in replacement dairy heifers in seasonally calving, pasture-based systems. Journal of Dairy Science 102, 5599–611, 2019. https://doi.org/10.3168/jds.2018-16079
- *Hickson RE, Balcomb CC, Fraser KR, Lopez-Villalobos N, Kenyon PR, Morris ST. The effect of breed on the onset of puberty in heifers. Proceedings of the Association for the Advancement of Animal Breeding and Genetics 19, 51–4, 2011
- Leche TF. Growth and feed conversion of Jersey and Friesian bulls. Australian Journal of Agricultural Research 22, 829–38, 1971. https://doi.org/10.1071/AR9710829
- Macdonald KA, Penno JW, Bryant AM, Roche JR. Effect of feeding level pre- and post-puberty and body weight at first calving on growth, milk production, and fertility in grazing dairy cows. Journal of Dairy Science 88, 3363–75, 2005. https://doi.org/10.3168/jds.S0022-0302(05)73020-4
- Macdonald KA, McNaughton LR, Verkerk GA, Penno JW, Burton LJ, Berry DP, Gore PJ, Lancaster JA, Holmes CW. A comparison of three strains of Holstein-Friesian cows grazed on pasture: growth, development, and puberty. Journal of Dairy Science 90, 3993–4003, 2007. https://doi.org/10.3168/jds.2007-0119
- Macdonald KA, Penno JW, Lancaster JAS, Roche JR. Effect of stocking rate on pasture production: milk production, and reproduction of dairy cows in pasture-based systems. Journal of Dairy Science 91, 2151–63, 2008. https://doi.org/10.3168/jds.2007-0630
- McDougall S, Rhodes FM, Compton CW. Evaluation of three synchrony programs for pasture-based dairy heifers. Theriogenology 79, 882–9, 2013. https://doi.org/10.1016/j.theriogenology.2012.12.013
- McNaughton LR, Lopdell TJ. Are dairy heifers achieving liveweight targets? Proceedings of the New Zealand Society of Animal Production 72, 120–2, 2012
- McNaughton LR, Morgan SR, Gore P, Verkerk GA, Holmes CW, Parkinson TJ. Monitoring onset of puberty in three genetic strains of Holstein-Friesian dairy cattle. Proceedings of the New Zealand Society of Animal Production 62, 30–3, 2002
- Meier S, Kuhn-Sherlock B, Amer PA, Roche JR, Burke CR. Heifers with positive genetic merit for fertility traits reach puberty earlier and have a greater pregnancy rate than heifers with a negative genetic merit for fertility traits. Journal of Dairy Science 104, 3707–21, 2021. https://doi.org/10.3168/jds.2020-19155
- *Pryce JE, Woolaston R, Berry DP, Wall E, Winters M, Butler R, Shaffer M. World trends in dairy cow fertility. Proceedings of the 10th World Congress on Genetics Applied to Livestock Production 10, 6, 2014
- Rajesh I, Gobikrushanth M, Carrelli JE, Oba M, Ambrose DJ. Repeatability of anogenital distance measurements from birth to maturity and at different physiological states in female Holstein cattle. Journal of Dairy Science 105, 2699–707, 2022. https://doi.org/10.3168/jds.2021-21419
- Subharat S, Wilson PR, Heuer C, Collins-Emerson JM. Growth response and shedding of Leptospira spp. in urine following vaccination for leptospirosis in young farmed deer. New Zealand Veterinary Journal 60, 14–20, 2012. https://doi.org/10.1080/00480169.2011.624985
- Troccon JL. Effects of winter feeding during the rearing period on performance and longevity in dairy cattle. Livestock Production Science 36, 157–76, 1993. https://doi.org/10.1016/0301-6226(93)90149-C
- Wold S, Sjöström M, Eriksson L. PLS-regression: a basic tool of chemometrics. Chemometrics and Intelligent Laboratory Systems 58, 109–30, 2001. https://doi.org/10.1016/S0169-7439(01)00155-1
- Zhang J, Yu KF. What’s the relative risk? A method of correcting the odds ratio in cohort studies of common outcomes. Journal of the American Medical Association 280, 1690–1, 1998. https://doi.org/10.1001/jama.280.19.1690
- *Non-peer-reviewed