
Abstract
1. UDP-glucuronosyltransferases (UGTs) are important drug-metabolizing enzymes (DMEs) catalyzing the glucuronidation elimination of various xenobiotics and endogenous substances. Endogenous substances are important regulators for the activity of various UGT isoforms. Triiodothyronine (T3) and thyroxine (T4) are important thyroid hormones essential for normal cellular differentiation and growth. The present study aims to elucidate the inhibition behavior of T3 and T4 on the activity of UGT isoforms.
2. In vitro recombinant UGTs-catalyzed glucuronidation of 4-methylumbelliferone (4-MU) was used to screen the inhibition potential of T3 and T4 on the activity of various UGT isoforms. Initial screening results showed that T4 exerted stronger inhibition potential than T3 on the activity of various UGT isoforms at 100 μM. Inhibition kinetics was determined for the inhibition of T4 on the representative UGT isoforms, including UGT1A1, -1A3, -1A7, -1A8, -1A10 and -2B7. The results showed that T4 competitively inhibited the activity of UGT1A1, -1A3, -1A7, 1A10 and -2B7, and noncompetitively inhibited the activity of UGT1A8. The inhibition kinetic parameters were calculated to be 1.5, 2.4, 11, 9.6, 4.8 and 3.0 μM for UGT1A1, -1A3, -1A7, -1A8, -1A10 and -2B7, respectively. In silico docking method was employed to demonstrate why T4 exerted stronger inhibition than T3 towards UGT1A1. Stronger hydrogen bonds and hydrophobic interaction between T4 and activity cavity of UGT1A1 than T3 contributed to stronger inhibition of T4 towards UGT1A1.
3. In conclusion, more clinical monitoring should be given for the patients with the elevation of T4 level due to stronger inhibition of UGT isoforms-catalyzed metabolism of drugs or endogenous substances by T4.
Introduction
DMEs are important biochemical barriers to eliminate the various xenobiotics and endogenous substances (Guo et al., Citation2016). Drug-metabolizing enzymes (DMEs) can be categorized into phase I DMEs (e.g. cytochrome P450 [CYP], etc.) and phase II DMEs (e.g. UDP-glucuronosyltransferases [UGTs], etc.) (Uno et al., Citation2016). UGTs have been regarded to be one of the most important phase II DMEs responsible for the conjugation metabolism reaction of various xenobiotics (e.g. drugs, herbs, etc.) and endogenous substances (e.g. bilirubin, estrogen, bile acids, etc.) (Fang et al., Citation2013; Kallionpaa et al., Citation2015; Naritomi et al., Citation2015; Oda et al., Citation2015). Multiple compounds with diverse structures have been reported to be the inhibitors of UGTs, including xenobiotics and endogenous substances. For endogenous inhibitors, bile acid taurolithocholic acid (TLCA) has been reported to exhibit inhibition potential towards multiple UGT isoforms (Fang et al., Citation2013). Lipid components phosphatidylcholines (PCs) and lysophosphatidylcholines (LPCs) exerted strong inhibition towards the activity of UGT isoforms, and UGT1A6 and UGT1A8 were demonstrated to be two most sensitive UGT isoforms for the inhibition (Gao et al., Citation2015). Endogenous unsaturated fatty acids are potent inhibitors of UGT isoforms (Tsoutsikos et al., Citation2004). Recent study carried out by Liu et al. (Citation2017) showed that vitamin A exhibited strong inhibition towards several UGT isoforms, including UGT1A1, 2B4, 2B7 and 2B15. Therefore, more work is being performed to find new endogenous inhibitors of UGT isoforms.
Triiodothyronine (T3) and thyroxine (T4) are important thyroid hormones essential for normal cellular differentiation and growth. T3 and T4 have been reported to play an important biological function, and many diseases can be diagnosed through determining the plasma level of total T3 (TT3), total T4 (TT4), free T3 (FT3) and free T4 (FT4). For example, the ratio of FT3/FT4 has been reported as a useful indicator to differentiate subacute thyroiditis from Graves' disease (Izumi et al., Citation2002; Yoshimura et al., Citation2005). FT3/FT4 ratio can be used to predict nonalcoholic fatty liver disease (NAFLD) (Gokmen et al., Citation2016). FT3/FT4 ratio is also a valuable and simple predictor to diagnose the patients with dilated cardiomyopathy (DCMP) (Kozdag et al., Citation2005). Low level of T3 can predict poor functional outcome after acute ischemic stroke (Suda et al., Citation2016). More biochemical functions of T3 and T4 are being studied by many research groups.
UGTs play a major role in the metabolism of T3 and T4. Through determining the catalyzing activity of various recombinant UGT isoforms towards the glucuronidation of T3 and T4, previous literatures have shown that all the tested UGTs (except UGT1A4) catalyzed the formation of T4 phenolic glucuronide. The formation of T3 phenolic glucuronide was catalyzed by several UGT isoforms at the following order: UGT1A8 > UGT1A10 > UGT1A3 > UGT1A1. UGT1A3 was the major isoform catalyzing the formation of T4 and T3 acyl glucuronides (Findlay et al., Citation2000; Tong et al., Citation2007). All these results indicated the good interaction between T3 (or T4) and UGTs. Therefore, the present study aims to determine the inhibition activity of T3 and T4 on various UGT isoforms. Inhibition potential screening, inhibition kinetic type determination and calculation of inhibition kinetic parameter (Ki) were carried out. Finally, in vitro–in vivo extrapolation (IVIVE) was performed to predict in vivo inhibition magnitude of T3 and T4 towards UGTs.
Materials and methods
Chemicals and reagents
4-Methylumbelliferone (4-MU), 4-methylumbelliferone-d-glucuronide (4-MUG), Tris-HCl, 7-hydroxycoumarin and uridine-5′-diphospho-glucuronic acid trisodium salt (UDPGA) were purchased from Sigma-Aldrich (St. Louis, MO). Recombinant UGT isoforms expressed in baculovirus-infected insect cells were purchased from BD Gentest Corp. (Woburn, MA), including UGT1A1, -1A3, -1A6, -1A7, -1A8, -1A9, -1A10, -2B4, -2B7, -2B15 and -2B17. T3 and T4 were purchased from Tianjin Puke Biotechnology Company (Tianjin, China). Acetonitrile with chromatographic grade was purchased from Fisher Scientific Company. Millipore Elix 5 UV and Milli-Q Gradient Ultra-Pure Water System were used to make ultra-pure water. All other reagents were of the highest grade commercially available.
Investigation of the inhibition of T4 and T3 on the activity of UGT isoforms
The in vitro incubation mixture used for evaluating the inhibition of T4 and T3 on the activity of UGT isoforms has been described in the previous literatures (Fang et al., Citation2013; Gao et al., Citation2015). For the in vitro inhibition study, recombinant UGTs-catalyzed glucuronidation of 4-MU was commonly used, and the concentration close to Km value was used for different UGT isoforms. Briefly, the incubation mixture (total volume = 200 μL) was consisted of the following components: 50 mM of Tris-HCl buffer (pH = 7.4), 5 mM of MgCl2, 5 mM of UDPGA, recombinant UGTs and 4-MU in the presence or absence of different concentrations of T3 or T4. The concentration of recombinant UGTs was 0.25, 0.05, 0.025, 0.05, 0.05, 0.05, 0.05, 0.5, 0.05, 0.75 and 0.5 mg/mL for UGT1A1, UGT1A3, UGT1A6, UGT1A7, UGT1A8, UGT1A9, UGT1A10, UGT2B4, UGT2B7 and UGT2B17, respectively. The concentrations of 4-MU were as follows: 110 μM for UGT1A1, 1200 μM for UGT1A3, 110 μM for UGT1A6, 15 μM for UGT1A7, 750 μM for UGT1A8, 30 μM for UGT1A9, 80 μM for UGT1A10, 1200 μM for UGT2B4, 350 μM for UGT2B7, 250 μM for UGT2B15 and 2000 μM for UGT2B17, respectively. The incubation time was 120 min for UGT1A1, UGT1A10, UGT2B4, UGT2B7 and UGT2B17, 75 min for UGT1A3, 30 min for UGT1A6, UGT1A7, UGT1A8 and UGT1A9, respectively. Under the situations of this study, the linear metabolic reaction was ensured. The glucuronidation metabolic reaction of 4-MU was initiated via the addition of UDPGA. The equal volume of ice-cold acetonitrile with 100 μM of 7-hydroxycoumarin as the internal standard was added to terminate the metabolic reaction. The protein in the samples was eliminated through centrifugation at 12 000g for 30 min, and the supernatant was injected into UFLC-UV for analysis.
In silico docking to explain the inhibition difference of T4 and T3 on the activity of UGT1A1
To better understand the difference of inhibition potential of T4 and T3 on UGT1A1, in silico docking method was used to dock the chemical structure of T3 and T4 into the activity cavity of UGT1A1. Due to the difficulty to get the three dimensional (3D) structure of UGT1A1, we firstly used homology modeling to build 3D structure of UGT1A1. The amino acid sequence of UGT1A1 was downloaded from National Center for Biotechnology Information (NCBI) database, and the code was NP000454. This amino acids sequence was used to perform homology modeling of the crystal structure of UGT1A1. Oleandomycin glycosyltransferase (PDB code: 2iya), anthocyanidin 3-O-glucosyltransferase (PDB code: 3wc4), and hydroquinone glucosyltransferase (PDB code: 2vce) were chosen as the templates of UGT1A1. MODELLER 9v14 program was used to predict 3D models of UGT1A1. PROCHECK and ERRAT were used to evaluate the model of UGT1A1 protein. Autodock Version 4.2 was employed to dock the flexible small molecule of T4 and T3 into the rigid protein of UGT1A1. The non-polar hydrogen atoms of UGT1A1 enzyme were merged. Subsequently, Kollman charges were added to the protein via AutoDockTool. The grid box was set to a dimension of 50 × 50 × 50. All calculations for protein-fixed ligand-flexible docking were done by Lamarckian Genetic Algorithm (LGA) method. The best conformation was selected with the lowest docked energy values. The interactions between enzyme and compounds were analyzed, including hydrogen bonds and hydrophobic interactions.
Determination of inhibition kinetics of T4 on UGT1A1, -1A3, -1A7, -1A8, -1A10 and -2B7
Concentration-dependent inhibition of T4 on the activity of UGT1A1, -1A3, -1A7, -1A8, -1A10 and -2B7 was determined. Furthermore, the inhibition kinetic type and parameters were determined through determining the glucuronidation velocity (v) of 4-MU glucuronidation at different concentration of 4-MU and T4. The inhibition kinetic type was determined using Lineweaver–Burk plots in which 1/v was drawn versus 1/[4-MU]. The slopes of the lines in Lineweaver–Burk plots were calculated, and drawn versus the concentrations of T4, which was used to calculate the inhibition kinetic parameters (Ki).
In vitro–in vivo extrapolation (IVIVE)
In vivo inhibition magnitude of UGT1A1, -1A3, -1A7, -1A8, -1A10, -2B7 was predicted using in vitro–in vivo extrapolation (IVIVE).
The following equation was used:
The terms in this equation are defined as follows: AUCi/AUC was the predicted ratio of in vivo exposure of xenobiotics or endogenous substances with and without co-exposure of T4. [I] was the in vivo exposure level of free T4 or total T4, and Ki was the reversible inhibition parameter. The standard was as followed: [I]/Ki <0.1, not possible; 0.1 < [I]/Ki <1, medium possible; [I]/Ki >1, highly possible.
Results
Comparison of the inhibition capability of T3 and T4 towards the activity of UGT isoforms
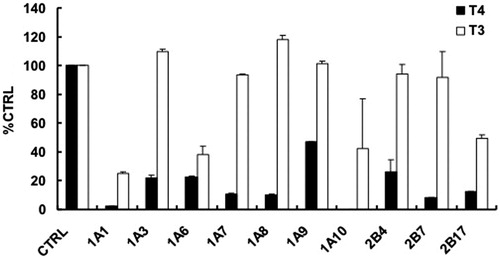
100 μM of T3 and T4 was used to screen the inhibition capability of T3 and T4 on the activity of UGT isoforms, and the results were given in . At 100 μM of T4, the residue activity of UGTs was 2.4%, 22.2%, 22.5%, 10.6%, 10.4%, 46.9%, 0, 26.5%, 8.1% and 12.3% for UGT1A1, -1A3, -1A6, -1A7, -1A8, -1A9, -1A10, -2B4, -2B7 and -2B17, respectively. Compared with T4, T3 showed weaker inhibition potential on various UGT isoforms. At 100 μM of T3, the residue activity of UGTs was 24.9%, 109.7%, 38.4%, 93.3%, 117.9%, 101.5%, 42.5%, 94.4%, 91.8% and 49.2% for UGT1A1, -1A3, -1A6, -1A7, -1A8, -1A9, -1A10, -2B4, -2B7 and -2B17, respectively.
Figure 1. Initial screening of the inhibition of T4 and T3 on the activity of UGT isoforms, including UGT1A1, -1A3, -1A6, -1A7, -1A8, -1A9, -1A10, -2B4, -2B7 and -2B17. Data were presented as the mean value plus S.D. 100 μM of T3 and T4 was used.
Inhibition kinetic type and parameters (Ki) of T4 on UGT1A1, -1A3, -1A7, -1A8, -1A10 and -2B7
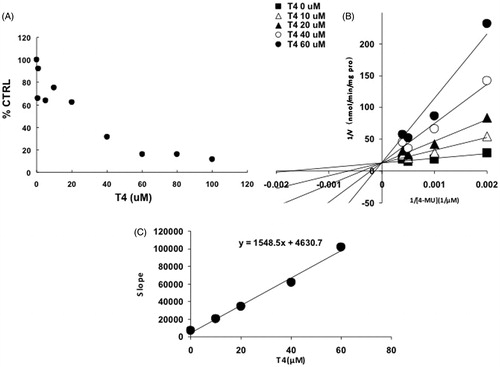
For UGT1A1, -1A3, -1A7, -1A10 and -2B7, the intersection point was located in the vertical axis of Lineweaver–Burk plot (), indicating the competitive inhibition of T4 on these UGT isoforms. For the inhibition of T4 on the activity of UGT1A8, the intersection point was located in the horizontal axis of Lineweaver–Burk plot (), indicating the noncompetitive inhibition of T4 on UGT1A8. Furthermore, the second plots were used to calculate the inhibition kinetic parameters (Ki). The equations for the second plots were y = 99.4x + 150.4, y = 0.7x + 1.7, y = 0.1x + 1.1, y = 177x + 1693.6, y = 64.3x + 309.8, y = 1548.5x + 4630.7 for UGT1A1, -1A3, -1A7, -1A8, -1A10 and -2B7. According to these equations, the inhibition kinetic parameters (Ki) were calculated to be 1.5, 2.4, 11, 9.6, 4.8 and 3.0 μM for UGT1A1, -1A3, -1A7, -1A8, -1A10 and -2B7, respectively.
Figure 2. Inhibition kinetics of T4 on the activity of UGT1A1. (A) Concentration-dependent inhibition of T4 on the activity of UGT1A1. Each data point represents the mean value of duplicate experiments. (B) Lineweaver–Burk plot to determine the inhibition kinetic type of T4 on UGT1A1. Each data point represents the mean value of duplicate experiments. (C) The second plot to determine the inhibition kinetic parameter (Ki). The vertical axis represents the slopes of the lines in the Lineweaver–Burk plot, and the horizontal axis represents the concentration of T4.
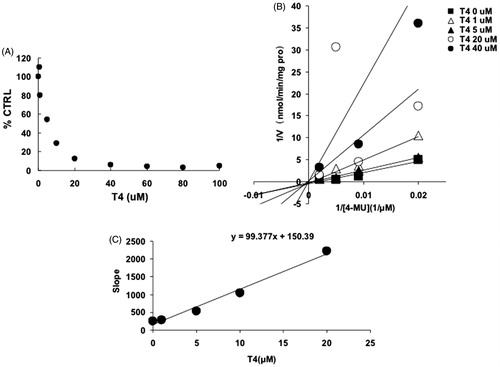
Figure 3. Inhibition kinetics of T4 on the activity of UGT1A3. (A) Concentration-dependent inhibition of T4 on the activity of UGT1A3. Each data point represents the mean value of duplicate experiments. (B) Lineweaver–Burk plot to determine the inhibition kinetic type of T4 on UGT1A3. Each data point represents the mean value of duplicate experiments. (C) The second plot to determine the inhibition kinetic parameter (Ki). The vertical axis represents the slopes of the lines in the Lineweaver–Burk plot, and the horizontal axis represents the concentration of T4.
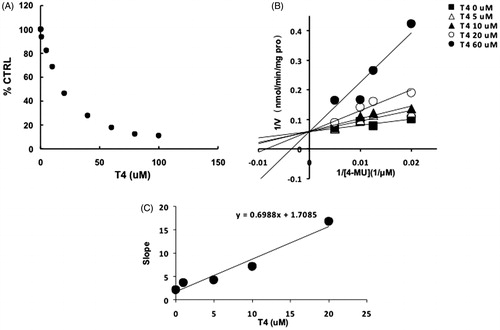
Figure 4. Inhibition kinetics of T4 on the activity of UGT1A7. (A) Concentration-dependent inhibition of T4 on the activity of UGT1A7. Each data point represents the mean value of duplicate experiments. (B) Lineweaver–Burk plot to determine the inhibition kinetic type of T4 on UGT1A7. Each data point represents the mean value of duplicate experiments. (C) The second plot to determine the inhibition kinetic parameter (Ki). The vertical axis represents the slopes of the lines in the Lineweaver–Burk plot, and the horizontal axis represents the concentration of T4.
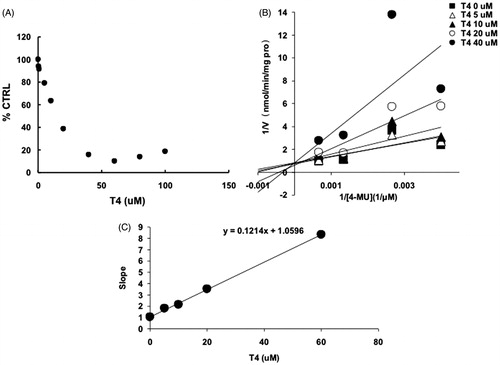
Figure 5. Inhibition kinetics of T4 on the activity of UGT1A8. (A) Concentration-dependent inhibition of T4 on the activity of UGT1A8. Each data point represents the mean value of duplicate experiments. (B) Lineweaver–Burk plot to determine the inhibition kinetic type of T4 on UGT1A8. Each data point represents the mean value of duplicate experiments. (C) The second plot to determine the inhibition kinetic parameter (Ki). The vertical axis represents the slopes of the lines in the Lineweaver–Burk plot, and the horizontal axis represents the concentration of T4.
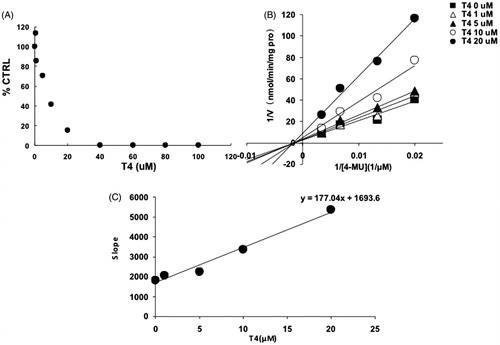
Figure 6. Inhibition kinetics of T4 on the activity of UGT1A10. (A) Concentration-dependent inhibition of T4 on the activity of UGT1A10. Each data point represents the mean value of duplicate experiments. (B) Lineweaver–Burk plot to determine the inhibition kinetic type of T4 on UGT1A10. Each data point represents the mean value of duplicate experiments. (C) The second plot to determine the inhibition kinetic parameter (Ki). The vertical axis represents the slopes of the lines in the Lineweaver–Burk plot, and the horizontal axis represents the concentration of T4.
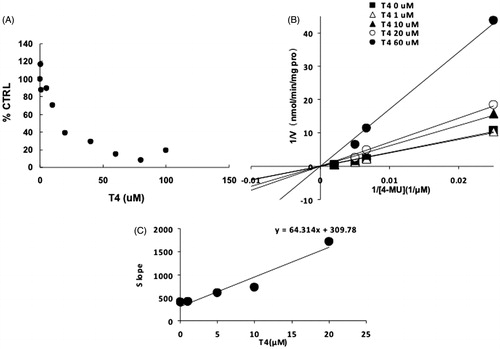
Figure 7. Inhibition kinetics of T4 on the activity of UGT2B7. (A) Concentration-dependent inhibition of T4 on the activity of UGT2B7. Each data point represents the mean value of duplicate experiments. (B) Lineweaver–Burk plot to determine the inhibition kinetic type of T4 on UGT2B7. Each data point represents the mean value of duplicate experiments. (C) The second plot to determine the inhibition kinetic parameter (Ki). The vertical axis represents the slopes of the lines in the Lineweaver–Burk plot, and the horizontal axis represents the concentration of T4.
Hydrogen bonds and hydrophobic interaction contributes to the stronger inhibition of T4 than T3 towards UGT1A1
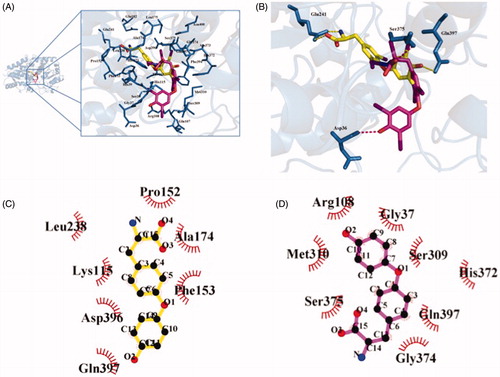
The crystal structure of UGT1A1 was gained using homology modeling method, and was given in . Through docking of T4 and T3 into the activity cavity of UGT1A1, we found that the substitution of iodine in T4 by hydrogen significantly weakened the inhibition potential towards UGT1A1. As shown in , T4 formed four hydrogen bonds with UGT1A1, and T3 generated two hydrogen bonds with UGT1A1. Therefore, stronger hydrogen bonds interaction contributes to the stronger inhibition of T4 on the activity of UGT1A1. In addition, T4 formed hydrophobic interaction with four non-polar amino acids residues (). In the contrast, T3 formed only one hydrogen bond with amino acid residue Met310 ().
Figure 8. Comparison of the binding capability of T3 and T4 into the activity cavity of UGT1A1. (A) The activity cavity binding with T3 and T4. (B) Hydrogen bonds interaction between T3/T4 with the activity cavity of UGT1A1. (C) Hydrophobic interaction between T4 and the activity cavity of UGT1A1. (D) Hydrophobic interaction between T3 and the activity cavity of UGT1A1.
Discussion
The results showed that the subtle alteration of substituent group of ligand structure between T3 and T4 could significantly change the inhibition potential towards UGT isoforms. Furthermore, we explained why T4 showed stronger inhibition than T3 on UGT1A1 using in silico docking method. The results showed the alteration of the formation of hydrogen bonds and hydrophobic interactions might contribute the different inhibition of T4 and T3’s on the activity of UGT1A1. T4 made three hydrogen bonds with UGT1A1, whereas T3 only made two hydrogen bonds with UGT1A1, which might result in the stronger binding capability of T4 with UGT1A1 than T3. T4 made hydrophobic interaction with four non-polar amino acids residues, and T3 made hydrophobic interaction with only one amino acid residue Met310.
In vivo inhibition magnitude can be predicted through calculating the ratio of in vivo exposure concentration and in vitro inhibition kinetic parameter (Ki). Based on the evaluation standard ([I]/Ki > 0.1), the threshold concentration of total (or free) T4 was calculated to be 0.15, 0.24, 1.1, 0.96, 0.48 and 0.3 μM for UGT1A1, -1A3, -1A7, -1A8, -1A10 and -2B7, respectively. Under many conditions, the plasma concentration of T4 significantly increased, including diseases and xenobiotics-induced toxicity. For example, the level of circulating T4 significantly increased in inherited disease familial dysalbuminemic hyperthyroxinemia (FDH) (Cho et al., Citation2017). The exposure of copper can significantly increase the total T4 and free T4 in plasma. Additionally, oral administration of L-T4 can be often used in the patients with hypothyroxinemia (Uchiyama et al., Citation2015). Long-term administration of l-T4 might result in the mild elevation of T4 (Tomita et al., Citation2003). In these situations, the in vivo inhibition of T4 on UGT1A1, -1A3, -1A7, -1A8, -1A10 and -2B7 should be given much mention. Taking FDH as a representative example, the concentration of total T4 can reach 0.16 μM (Lee et al., Citation2017), which is close to the threshold value to induce in vivo inhibition of UGTs.
UGT1A1 catalyzed the glucuronidation metabolism of many important drugs or endogenous substances, such as drug irinotecan and endogenous substance bilirubin (Cui et al., Citation2016). UGT1A3 plays a key role in the metabolism of bile acids (Shu-Yao et al., Citation2013; Trottier et al., Citation2010). UGT2B7 has been widely accepted to be one of the important UGT isoforms, and has been demonstrated to play a key role in the metabolism of many important clinical drugs, including zidovudine (Yuan et al., Citation2015). UGT1A7, UGT1A8 and UGT1A10 are UGT isoforms expressed in the intestine responsible for the intestinal glucuronidation metabolism elimination of many drugs (Naritomi et al., Citation2015). Therefore, the metabolism behavior of compounds catalyzed by these UGT isoforms might be significantly influenced by the elevation of T4 level.
In conclusion, stronger inhibition capability of T4 than T3 on the UGT isoforms was demonstrated in this study, which indicates that close clinical monitoring should be given for the patients with elevated plasma level of T4.
Declaration of interest
The authors report no conflicts of interest. The authors alone are responsible for the content and writing of this article.
Acknowledgements
This work was supported by the project for the National Key Research and Development Program (2016YFC0903100, 2016YFC0903102), National Natural Science Foundation of China (Nos. 81672961, 81602850), individualized diagnosis and treatment of colorectal cancer (No. LNCCC-B05-2015), Foundation of Committee on Science and Technology of Tianjin (Grant No. 15JCYBJC54700), the China Postdoctoral Science Foundation (2016M590210), Tianjin Health Bureau Science Foundation Key Project (2014KR14, 16KG154) and Tianjin Project of Thousand Youth Talents.
References
- Cho YY, Song JS, Park HD, et al. (2017). First report of familial dysalbuminemic hyperthyroxinemia with an ALB variant. Ann Lab Med 37:63–5
- Cui C, Shu C, Cao D, et al. (2016). UGT1A1*6, UGT1A7*3 and UGT1A9*1b polymorphisms are predictive markers for severe toxicity in patients with metastatic gastrointestinal cancer treated with irinotecan-based regimens. Oncol Lett 12:4231–7
- Fang ZZ, He RR, Cao YF, et al. (2013). A model of in vitro UDP-glucuronosyltransferase inhibition by bile acids predicts possible metabolic disorders. J Lipid Res 54:3334–44
- Findlay KA, Kaptein E, Visser TJ, Burchell B. (2000). Characterization of the uridine diphosphate-glucuronosyltransferase-catalyzing thyroid hormone glucuronidation in man. J Clin Endocrinol Metab 85:2879–83
- Gao X, Qu H, Ai CZ, et al. (2015). Regulation profile of phosphatidylcholines (PCs) and lysophosphatidylcholines (LPCs) components towards UDP-glucuronosyltransferases (UGTs) isoforms. Xenobiotica 45:197–206
- Gokmen FY, Ahbab S, Ataoglu HE, et al. (2016). FT3/FT4 ratio predicts non-alcoholic fatty liver disease independent of metabolic parameters in patients with euthyroidism and hypothyroidism. Clinics (Sao Paulo) 71:221–5
- Guo Y, Hu B, Xie Y, et al. (2016). Regulation of drug-metabolizing enzymes by local and systemic liver injuries. Expert Opin Drug Metab Toxicol 12:245–51
- Izumi Y, Hidaka Y, Tada H. (2002). Simple and practical parameters for differentiation between destruction-induced thyrotoxicosis and Graves' thyrotoxicosis. Clin Endocrinol (Oxf) 57:51–8
- Kallionpaa RA, Jarvinen E, Finel M. (2015). Glucuronidation of estrone and 16α-hydroxyestrone by human UGT enzymes: the key roles of UGT1A10 and UGT2B7. J Steroid Biochem Mol Biol 154:104–11
- Kozdag G, Ural D, Vural A, et al. (2005). Relation between free triiodothyronine/free thyroxine ratio, echocardiographic parameters and mortality in dilated cardiomyopathy. Eur J Heart Fail 7:113–18
- Lee MN, Lee SY, Hur KY, Park HD. (2017). Thyroxine (T4) autoantibody interference of free T4 concentration measurement in a patient with Hashimoto's thyroiditis. Ann Lab Med 37:169–71
- Liu X, Cao YF, Dong PP, et al. (2017). The inhibition of UDP-glucuronosyltransferases (UGTs) by vitamin A. Xenobiotica 47:376–81
- Naritomi Y, Nakamori F, Furukawa T, Tabata K. (2015). Prediction of hepatic and intestinal glucuronidation using in vitro-in vivo extrapolation. Drug Metab Pharmacokinet 30:21–9
- Oda S, Fukami T, Yokoi T, Nakajima M. (2015). A comprehensive review of UDP-glucuronosyltransferase and esterases for drug development. Drug Metab Pharmacokinet 30:30–51
- Shu-Yao Z, Hong J, Chao-Xian L, et al. (2013). In vitro evidence of possible influence of scutellarein towards bile acids' metabolism. Afr Health Sci 13:556–9
- Suda S, Muraga K, Kanamaru T, et al. (2016). Low free triiodothyronine predicts poor functional outcome after acute ischemic stroke. J Neurol Sci 368:89–93
- Tomita Y, Ishiguro H, Shinagawa T, et al. (2003). Persistence of mild hyperthyrotropinemia after discontinuation of three-year course of low-dose L-thyroxine therapy in infants with borderline hypothyroidism. Endocr J 50:379–84
- Tong Z, Li H, Goljer I, et al. (2007). In vitro glucuronidation of thyroxine and triiodothyronine by liver microsomes and recombinant human UDP-glucuronosyltransferases. Drug Metab Dispos 35:2203–10
- Trottier J, El Husseini D, Perreault M, et al. (2010). The human UGT1A3 enzyme conjugates norursodeoxycholic acid into a C23-ester glucuronide in the liver. J Biol Chem 285:1113–21
- Tsoutsikos P, Miners JO, Stapleton A, et al. (2004). Evidence that unsaturated fatty acids are potent inhibitors of renal UDP-glucuronosyltransferases (UGT): kinetic studies using human kidney cortical microsomes and recombinant UGT1A9 and UGT2B7. Biochem Pharmacol 67:191–9
- Uchiyama A, Kushima R, Watanabe T, Kusuda S. (2015). Effect of l-thyroxine supplementation on infants with transient hypothyroxinemia of prematurity at 18 months of corrected age: randomized clinical trial. J Pediatr Endocrinol Metab 28:177–82
- Uno Y, Uehara S, Yamazaki H. (2016). Utility of non-human primates in drug development: comparison of non-human primate and human drug-metabolizing cytochrome P450 enzymes. Biochem Pharmacol 121:1–7
- Yoshimura NJ, Momotani N, Fukada S, et al. (2005). Ratio of serum free triiodothyronine to free thyroxine in Graves' hyperthyroidism and thyrotoxicosis caused by painless thyroiditis. Endocr J 52:537–42
- Yuan L, Qian S, Xiao Y, et al. (2015). Homo- and hetero-dimerization of human UDP-glucuronosyltransferase 2B7 (UGT2B7) wild type and its allelic variants affect zidovudine glucuronidation activity. Biochem Pharmacol 95:58–70