
Abstract
1. To determine the effects of repeated atrazine (ATR) treatment on hepatic phase I and II enzymes, adult female rats were treated with vehicle or 100 mg/kg of ATR for 1, 2, 3 or 4 days. Glutathione-s-transferases (GST) mRNA expression, protein levels (mu, pi, alpha, omega), and activity (cytosolic and microsomal), along with bioavailable glutathione (GSH) were assayed.
2. GST expression, concentrations and activity were increased, along with GSH levels, in animals treated with ATR for 3 and 4 days.
3. A subsequent study was performed with animals treated with vehicle, 6.5, 50 or 100 mg/kg/day for 4, 8 or 14 days. Expression of hepatic phase I CYP 450 enzymes was evaluated in conjugation with GST expression, protein and activity. Nineteen of the 45 CYP enzymes assayed displayed increased mRNA levels after eight days of treatment in animals treated with 50 or 100 mg/kg/day. After 14 days of treatment, all CYP expression levels returned to control levels except for CYP2B2, CYP2B3, CYP2C7, CYP2C23, CYP2E1, CYP3A9, CYP4A3 and CYP27A1, which remained elevated.
4. Results indicate that there may be a habituation or adaptation of liver phase I and phase II expression following repeated ATR treatment.
Introduction
Atrazine (2-chloro-4-ethylamino-6-isopropylamino-s-triazine; ATR) belongs to the class of chloro-s-triazine herbicides that are applied pre- and early post-emergence to control weeds in a number of triazine-tolerant crops including corn, sorghum and sugarcane (USDA, Citation2006). ATR blocks electron transfer at the reducing site of photosystem complex II in the chloroplasts of plants by binding to the plastoquinone-binding protein (Good, Citation1961; Gysin & Knuesli, Citation1960), resulting in energy depletion and oxidative damage. In mammals, ATR is rapidly absorbed, dealkylated in the liver by CYP P450 liver enzymes (Lang et al., Citation1996) and eliminated in urine and feces, predominantly as glutathione (GSH) conjugated chlorotriazine mercapturates. ATR has a terminal half-life of elimination of approximately 31 h in humans (Campbell et al., Citation2016) and plasma clearances of 2.4, 6.9, 6.0 and 8.1 h for ATR and its three chlorotriazine (DEA, DIA and DACT) metabolites, respectively, in female rats administered ATR by gavage (McMullin et al., Citation2003).
ATR administered to rats by gavage results in a rapid rise in corticosterone (Foradori et al., Citation2011; Fraites et al., Citation2009; Laws et al., Citation2009; Pruett et al., Citation2003). ATR-induced rise in plasma corticosterone levels maybe partially responsible for the ATR-induced reduction in luteinizing hormone (LH) release in rats (Foradori et al., Citation2011). High peak plasma ATR levels are thought to be required for ATR to increase plasma corticosterone or inhibit LH release because bolus delivery of ATR is effective in inducing a rise in corticosterone concentrations and reducing LH release, whereas similar doses distributed throughout the day by incorporating ATR in the diet are ineffective. We have recently demonstrated that even bolus ATR-induced corticosterone release and LH release inhibition are attenuated after repeated treatments (7–21 days of treatment) in female rats (Breckenridge et al., Citation2017; Foradori et al., Citation2017). The habituation or tolerance to ATR over repeated treatment in female rats may be due to alterations in the hepatic enzymes and substrates responsible for ATR metabolism leading to reduced peak plasma levels.
Previous studies have examined some components of both phase I and phase II biotransformation after ATR exposure. In vitro studies have demonstrated that CYP1A1/2, CYP2B1/2, CYP2C11, CYP2D1 and CYP2E1 are involved in ATR metabolism, with CYP2B1/2 being implicated as the predominant enzyme (Hanioka et al., Citation1998a,b, Citation1999). In vivo studies using male rats suggest that CYP1A1/2 may contribute more to the phase I metabolism of ATR than CYP2B1/2 (Islam et al., Citation2002; Pogrmic-Majkic et al., Citation2012). However, these studies were limited in scope and did not examine hepatic CYP expression levels after repeated exposures and doses.
In vitro studies of phase II metabolism of ATR in rat (Egaas et al., Citation1993) and human liver fractions (Buchholz et al., Citation1999; Jaeger et al., Citation1998; Lucas et al., Citation1993) indicate that GSH conjugation is involved with glutathione-s-transferase pi (GST P) activity. GST P is increased in the rat (Islam et al., Citation2002; Pogrmic-Majkic et al., Citation2012) and mouse (Abel et al., Citation2004; Egaas et al., Citation1995a) following ATR treatment. However, these studies characterized only a few of the GST isoforms and did not systematically evaluate the time course of enzyme induction.
In the present study, we examined the effects of ATR exposure on the expression of hepatic CYP and GST enzymes, GST protein/activity levels, and GSH levels after a range of ATR doses (0, 6.5, 50 or 100 mg/kg) and treatment durations (daily for 1, 2, 3, 4, 8 or 14 days) in the female Sprague Dawley rat. We identified changes in phase I and phase II enzymes which are dose- and duration-dependent, implicating several factors in xenobiotic metabolism which may affect ATR metabolism.
Materials and methods
Animals. Eight- to nine-week-old female Sprague Dawley rats (Crl:CD(SD)) were received in two shipments from Charles River Laboratories Inc. (Raleigh, NC) and acclimated and maintained in AAALAC approved animal facilities at WIL Research Laboratories LLC (Ashland, OH). All animal procedures and experimental protocols were approved by the WIL Research Institutional Animal Care and Use Committee. Rats were a minimum of 12 weeks old at the beginning of the study. Animals were individually housed in clean suspended wire-mesh cages in an environmentally controlled room (22 ± 3 °C; 50 ± 20% humidity) on a 14-hour light/10-hour dark photoperiod (lights on at 05:00 h, off at 19:00 h) with water and food (Rodent LabDiet, PMI Nutrition International LLC, St. Louis, MO) available ad libitum. All animals were ovariectomized and implanted with a 12–14 mm long estradiol (4 mg/mL in sesame oil) silastic capsule before additional procedures were performed. All animals received a single daily dose of vehicle (1% methylcellulose sodium salt in deionized water; 5 mL/kg) seven days prior to the first day of treatment.
Atrazine formulation and administration
ATR was supplied by Syngenta Crop Protection, LLC (Greensboro, NC), as an analytically-certified, 98.8% pure, white powder that was stable for use during the period of the study. ATR was prepared approximately weekly as a suspension in 1% methylcellulose and deionized water at concentrations of 1.3, 10 or 20 mg/mL. Suspensions were stored refrigerated (at 2–8 °C) until use. Sample storage stability and sample homogeneity were established by high-pressure liquid chromatography (HPLC) prior to study conduct. The concentration of ATR, which was assessed in every dose suspension by HPLC, ranged from 94.7 to 101% of target.
Experiment 1: effects of ATR treatment (100 mg/kg/day) on phase II hepatic components after 1, 2, 3 or 4 days of treatment
Animals were administered ATR (100 mg/kg) or vehicle by gavage once daily for 1, 2, 3 or 4 consecutive days (10–15 animals per group). After 1, 2, 3 or 4 days of treatment, blood was collected periodically after lights-on in order to evaluate the effects of repeated ATR on the LH surge; the in-life data and the LH results are provided in a separate publication (Breckenridge et al., Citation2017). Following completion of the last treatment, animals were euthanized by carbon dioxide inhalation and the right lobe of the liver was collected. Tissue was flash frozen in liquid nitrogen and stored at –70 °C until analyzed for phase II hepatic components.
Experiment 2: effects of ATR treatment (6.5, 50 or 100 mg/kg/day) on phase I and II hepatic components after 4, 8 or 14 days of treatment
Animals were administered ATR (6.5, 50 or 100 mg/kg) or vehicle by gavage once daily for 4, 8 or 14 consecutive days (10–15 animals per group). After 4, 8 or 14 days of treatment, blood was collected periodically after lights-on in order to evaluate the effects of repeated ATR on the LH surge; the in-life data and the LH results are provided in a separate publication (Breckenridge et al., Citation2017). Following completion of the last treatment, animals were euthanized by i.p. injection of pentobarbital sodium and the right lobe of the liver was collected. Liver tissue was flash frozen in liquid nitrogen and stored at –70 °C until analyzed. Considering the profound changes in phase II hepatic components identified in Experiment 1, Experiment 2 analysis was expanded to included quantification of hepatic CYP enzymes along with phase II components.
RNA extraction
RNA extraction was performed using the Qiagen (Valencia, CA) RNeasy Microarray Tissue kit (73304). Tissue (40–60 mg) from the right lobe of the liver was weighed and placed in 1 mL of QIAzol lysis reagent in a DNase/Rnase-free 1.7 mL microcentrifuge tube. Tissue was homogenized for 30–40 seconds using a pellet mixer (VWR, Radnor, PA; 47747-370). Following homogenization, the homogenate was placed on the bench top at room temperature for five minutes to promote dissociation of the nucleoprotein complexes. Chloroform (200 µL) was added to the homogenate, mixed and allowed to sit at room temperature for three minutes. Homogenates were then centrifuged at 12 000 × g for 15 minutes at 4 °C. The upper aqueous layer was transferred to a new microcentrifuge tube and mixed with 600 μL of 70% ethanol. The mixture was transferred to an Rneasy Mini spin column in a 2 mL collection tube and centrifuged at 8000 × g for 15 seconds at room temperature. On-column DNase Digestion was performed using the Rnase-free DNase set (Qiagen; 79254). RNA was eluted off the spin column and collected in a 1.5 mL collection tube. Sample concentration (ng/μL) and purity (260/280 ratio) were determined using the Thermo Scientific (Pittsburgh, PA) NanoDrop ND-1000 Spectrophotometer. cDNA synthesis was performed using the Qiagen RT2 First Strand Kit (330401).
Real-time PCR analysis-GST
Real-time PCR analysis was performed using a custom Qiagen RT2 Profiler PCR array. Eight liver samples were selected at random from each control and ATR-treated groups, and mRNA expression levels for 13 isoforms of GST were analyzed: GST alpha 3 (GSTA3), GST alpha 4 (GSTA4), GST kappa 1 (GSTK1), GST mu 1 (GSTM1), GST mu 2 (GSTM2), GST mu 3 (GSTM3), GST omega 1 (GSTO1), GST omega 2 (GSTO2), GST pi 1 (GSTP1), GST theta 1 (GSTT1), GST theta 2 (GSTT2), microsomal GST 1 (mGST1) and microsomal GST 2 (mGST2).
In order to find an appropriate reference gene for qPCR normalization, gene expression analysis was carried out on four potential genes (Gapdh, Ldha, Rpl13a and Rplp1) from liver samples from all treatment groups. For all groups, Rplp1 was found to be the most stable and was chosen to be the optimal gene expression for normalization in the female rat liver after ATR treatment. The commercially generated plates were calibrated for optimal amplification efficiency. Internal controls included tests for genomic DNA control (GDC), reverse-transcription control (RTC) and positive PCR control (PPC). The GDC specifically detects nontranscribed genomic DNA contamination with a high level of sensitivity. The RTC tested the efficiency of the reverse-transcription reaction performed with the RT2 First Strand Kit by detecting template synthesized from the kit’s built-in external RNA control. The PPC consists of a predispensed artificial DNA sequence. This control tests the efficiency of the polymerase chain reaction itself. In all of the plates run, GDC, RTC and PPC controls, as well as, interwell and intra-plate consistency were within the recommended limits pre-determined by Qiagen. All primer sets were verified by Qiagen for the custom PCR array. PCR was carried out using the Bio-rad iCycler iQ real-time detection system with RT2 SYBR Green qPCR mastermix (Qiagen; 330513). Fluorescence data collection was performed for 40 cycles at 95 °C for 15 seconds and 40 cycles at 60 °C for one minute. The fold change of each target mRNA expression relative to Rplp1 under experimental and control conditions were calculated based on the threshold cycle (CT) as r = 2–Δ(ΔCT), where ΔCT=CT(target) – CT(Rplp1) and Δ(ΔCT)=ΔCT(experimental) – ΔCT(control).
GSH analysis
Total GSH levels were determined using the Cayman Chemical GSH assay kit (Ann Arbor, MI). Liver samples (100–200 mg) were homogenized using the Precellys 24 (Bertin Technologies, Rockville, MD) at 5000 rpm, twice for 10 seconds each time and spun at 10 000 × g for 15 minutes at 4 °C. Total protein content of the supernatant was measured according to the Bradford method (Bradford, Citation1976) with bovine serum albumin (BSA) as a protein standard. Protein levels for all samples were standardized to 10 mg/mL. Samples were deproteinated with metaphosphoric acid followed by the reaction of the sulfhydryl groups of GSH with 5,5′-dithio-bis-2-nitrobenzoic acid (DTNB, Ellman’s reagent) to produce a yellow colored product, 5-thio-2-nitrobenzoic acid. The product was measured at 412 nm using the Molecular Devices (Sunnyvale, CA) Spectra Max Plus384, and the absorbance was compared to a standard curve range of 0–8.0 μM oxidized glutathione (GSSG) using the Softmax Pro (Molecular Devices, Sunnyvale, CA) data software. All samples were assayed in duplicate, and the results were expressed as nmol GSH/mg protein.
Western blotting
The same animals from the GST mRNA analysis were used to measure GST protein levels. Protein extracts (75 µg) and low molecular weight standards (Bio-Rad, Hercules, CA, 161-0305) were separated by electrophoresis at 200 V for 50 minutes in a 12% Criterion TGX polyacrylamide gel (Bio-Rad; 567-1045). Protein extracts were transferred for one hour at 100 V to a nitrocellulose membrane (Bio-Rad; 162-0116). Blots were blocked using equal volumes of Li-Cor (Lincoln, NE) Odyssey Blocking Buffer (927-40000) and PBS (0.1 M; pH 7.2), and placed on a rotator for one hour. Blots were incubated overnight at 4 °C on a rotator with 12 mL of primary antibody cocktail [primary antibody cocktails used were as follows: mouse anti-GST alpha (MyBioSource, San Diego, CA, MBS560696; 1:1000) with Goat anti-GST mu (Abcam, Cambridge, MA, Ab53942; 1:1000), goat anti-GST pi (Abcam, Cambridge, MA, Ab53943; 1:1000) with rabbit anti-GST omega (Abcam, Ab129106; 1:1000)]. Blots were rinsed and incubated in secondary antibody cocktail [secondary antibody cocktails used were as follows: donkey anti-Goat (Odyssey 800 CW; 926-32214; 1:10 000) with donkey anti-mouse (Odyssey 680 RD; 926-68072; 1:10 000) or donkey anti-rabbit (Odyssey 680 RD; 926-68073; 1:10 000)]. Blots were washed and stored in PBS until imaged. All blots were imaged using the Li-Cor Odyssey Infrared Imaging System, and analyzed using the Odyssey Software v2.0. Beta-actin (Mouse anti-Actin; Millipore, Billerica, MA, MAB1501; 1:1000) was run as a loading control protein, and protein levels for each GST isoform were standardized to beta-actin levels.
GST analysis
GST enzymatic activity was determined using the Cayman Chemical GST assay kit. Using 10 mg/mL standardized protein samples, homogenate was diluted to 1 mg/mL in potassium phosphate buffer (100 mM potassium phosphate, 2 mM EDTA, pH 7.0), placed into 3.0 mL sterile ultracentrifuge tubes (Beckman Coulter, Brea, CA, 355870), heat sealed and spun in an ultra-speed centrifuge (Beckman L8-70M, Brea, CA) at 100 000 × g for 60 minutes at 4 °C. Cytosolic fraction was placed in a new sterile tube, and microsomal pellet was re-suspended in 500 µL of cold homogenization buffer. Protein concentration of both fractions was determined by protein assay (BioRad). GST activity for both fractions was determined spectrophotometrically by measuring the rate of formation of the conjugate of GSH and 1-chloro-2,4-dinitrobenzene (CDNB). The absorbance was read at 340 nm every 60 seconds for six minutes using the Molecular Devices Spectra Max Plus384 plate reader. All samples were assayed in duplicate, and enzymatic activity was expressed as nmol/min/mg protein. Data were analyzed using Softmax Pro software.
Real-time PCR analysis-CYP enzymes
Real-time PCR analysis was performed using a custom Qiagen RT2 Profiler PCR array. Liver samples (4–5) were randomly selected from the eight liver GST mRNA samples analyzed from Experiment 2. mRNA expression levels for 45 isoforms of Cytochrome P450 (CYP) enzymes were analyzed: CYP1A1, CYP1A2, CYP1B1, CYP2A3, CYP2B2, CYP2B3, CYP2C6, CYP2C7, CYP2C8, CYP2C11, CYP2C22, CYP2C23, CYP2C37, CYP2D2, CYP2D4, CYP2E1, CYP2F4, CYP2R1, CYP2S1, CYP2T1, CYP2W1, CYP3A9, CYP3A18, CYP3A23/3A1, CYP4A3, CYP4A8, CYP4B1, CYP4F1, CYP4F4, CYP4F6, CYP4F18, CYP4F40 CYP7A1, CYP7B1, CYP8B1, CYP11A1, CYP11B1, CYP17A1, CYP19A1, CYP24A1, CYP26A1, CYP26B1, CYP26C1, CYP27A1 and CYP27B1. All primer sets were verified by Qiagen for the custom PCR array. After reverse transcription, PCR was carried out using the Bio-rad iCycler iQ real-time detection system with RT2 SYBR Green qPCR mastermix (Qiagen; 330513). One cycle was performed at 95 °C for 10 minutes to activate the HotStart DNA Taq Polymerase. Fluorescence data collection was performed for 40 cycles at 95 °C for 15 seconds and 40 cycles at 60 °C for one minute. The fold change of each target mRNA expression relative to Rplp1 was calculated based on the threshold cycle (CT) as r = 2–Δ(ΔCT), where ΔCT = CT(target) – CT(Rplp1) and Δ(ΔCT) = ΔCT(experimental) – ΔCT(control).
Statistical analysis
Hepatic CYP mRNA expression data were analyzed on day four of ATR treatment and compared to same day control animals using Student’s t-test. All other data were analyzed for all time points using two-way analysis of variance (ANOVA) for treatment, days of treatment and treatment × days of treatment interactions with Bonferroni’s post hoc tests. The level of statistical significance was set at p ≤ 0.05. All values are reported as the mean ± SEM. Prism 5 for Mac (GraphPad Software, Inc., La Jolla, CA) was used for all data analysis.
Results
Experiment 1: effects of ATR treatment (100 mg/kg/day) on phase II hepatic components after 1, 2, 3 or 4 days of treatment
GST isoform expression
ATR-treated animals did not have a significant increase in liver mRNA expression levels after one or two days of exposure for any of the GST enzymes measured (). After three days of exposure, ATR-treated animals showed an increase in liver mRNA expression levels compared to their corresponding control group for five GST isoforms (GSTA3, GSTM1, GSTM3, GSTP1 and mGST2; ; ). Following four days of ATR treatment, 11 GST isoforms showed increased mRNA expression levels as compared to control (GSTA3, GSTK1, GSTM1, GSTM2, GSTO1, GSTO2, GSTP1, GSTT1, GSTT2, mGST1 and mGST2; ). Four GST isoforms, which were elevated above controls levels after 3 days of treatment, remained elevated (GSTA3, GSTM1, GSTP1 and mGST2; ). Seven additional GST isoforms were only elevated after four days of treatment (GSTK1, GSTM2, GSTO1, GSTO2, GSTT1, GSTT2 and mGST1; ). GSTM3 was the only isoform which was elevated after three days of treatment but was not different from control levels after four days of treatment.
Figure 1. Histograms depicting fold change in liver mRNA expression for GSTA3 (A), GSTM1 (B), GSTP1 (C) and mGST2 (D) after 1, 2, 3 and 4 days of treatment with vehicle (white bars) or 100 mg/kg (black bars) of ATR. Data are presented as mean ± SEM; *significant difference (p < 0.05) versus corresponding day control group.
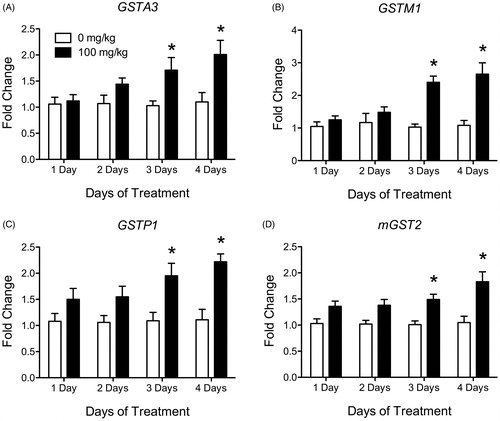
Table 1. Liver GST mRNA expression levels (±SEM) in atrazine treated rats summary values in fold change.
GST protein levels
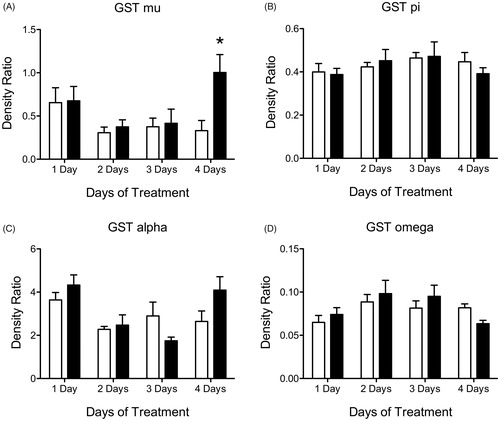
Western blots analysis identified no differences in protein levels for GST mu (GST M), GST pi (GST P), GST alpha (GST A) or GST omega (GST O) after 1, 2, 3 or 4 days of ATR treatment (, Supplemental Table 1).
Figure 2. Histogram depicting density ratio to beta actin levels of liver GST isoform proteins (A) GST mu, (B) GST pi, (C) GST alpha and (D) GST omega levels after 1, 2, 3 and 4 days of treatment with vehicle (white bars) or 100 mg/kg (black bars) of ATR. Data are presented as mean ± SEM; *significant difference (p < 0.05) versus corresponding control.
Bio-reactive GSH levels and GST activity
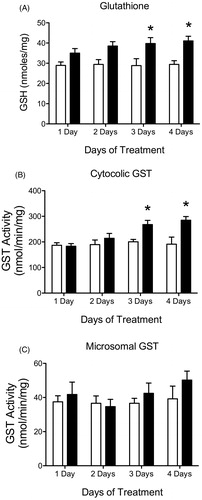
ATR-treated animals showed increased liver GSH levels after 3 and 4 days of treatment compared to control (). ATR treatment (100 mg/kg/day) led to increased hepatic cGST activity after 3 and 4 days of treatment but not after 1 or 2 days (). There was no effect of ATR treatment on microsomal GST activity ().
Figure 3. Histogram depicting liver (A) glutathione (GSH) levels in nmoles/mg protein, (B) liver cytosolic GST (cGST) activity in nmol/min/mg protein and (C) liver microsomal GST (mGST) activity in nmol/min/mg protein for all animals after 1, 2, 3 and 4 days of treatment with vehicle (white bars) or 100 mg/kg (black bars) of ATR. Data are presented as mean ± SEM; *significant difference (p < 0.05) versus corresponding control group.
Experiment 2: effects of ATR treatment (6.5, 50 or 100 mg/kg/day) on phase I and II hepatic components after 4, 8 or 14 days of treatment
CYP enzyme expression
All CYP isoform expression data are presented in with a select number depicted in . Animals treated once daily for 4, 8 or 14 days with 6.5, 50 or 100 mg/kg of ATR had significantly increased liver mRNA expression for CYP1A2, CYP26A1, CYP27A1, CYP2B2, CYP2B3, CYP2C22, CYP2C23, CYP2C37, CYP2C7, CYP2D2, CYP2E1, CYP2F4, CYP2R1, CYP2T1, CYP3A18, CYP3A23/3A1, CYP3A9, CYP4A3, CYP4F1, CYP4F6 and CYP7A1 (, ). There was no treatment effect on expression levels of CYP17A1, CYP4B1, CYP8B1, CYP2C6, CYP2D4 and CYP4F4. CYP7B1 was the only isoform found to be decreased in expression (6.5 and 100 mg/kg after four days), and although CYP8B1 expression was also decreased, it was not statistically significant.
Figure 4. Histograms depicting fold change in liver mRNA expression for (A) CYP2B2, (B) CYP2B3, (C) CYP2E1, (D) CYP2R1, (E) CYP3A18 and (F) CYP27A1 after 4, 8 and 14 days of treatment with vehicle (white bars), 6.5 mg/kg (light gray), 50 mg/kg (dark gray) or 100 mg/kg (black bars) of ATR. Data are presented as mean ± SEM; significant difference (p < 0.05; *compared to 0 mg/kg).
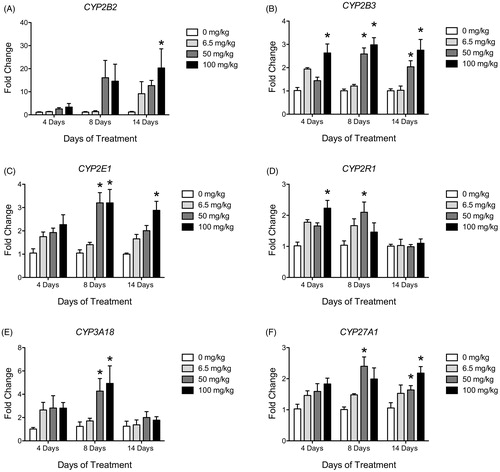
Table 2. Liver cytochrome P450 enzyme mRNA expression levels (±SEM) in atrazine treated rats summary values in fold change.
Of the CYP isoforms found to have increased expression after ATR treatment, three were elevated above control after 4, 8 and 14 days of treatment (CYP2B3, CYP2C23 and CYP3A9; ). Of these isoforms, CYP3A9 was the only isoform increased in 6.5 mg/kg treated animals. All other increases were only identified in 50 or 100 mg/kg ATR-treated groups. CYP1A2 was only elevated after four days of ATR but was no different from control levels after 8 and 14 days of treatment. CYP3A23/3A1, CYP2C22 and CYP2R1 were elevated compared to control animals after 4 and 8 days of treatment but not 14 days (, ). CYP26A1, CYP2C37, CYP2D2, CYP2F4, CYP2T1, CYP3A18, CYP4F1, CYP4F6 and CYP7A1 were increased only after eight days of treatment (). CYP27A1, CYP2C7, CYP2E1 and CYP4A3 were increased after eight days of treatment and remained high after 14 days (). Although CYP2B2 was only statistically significantly elevated after 14 days of treatment at 100 mg/kg, it had the largest increase in expression compared to control levels (, ). Expression of CYP2C6, CYP2D4, CYP11A1, CYP11B1, CYP19A1, CYP1A1, CYP1B1, CYP24A1, CYP26B1, CYP27B1, CYP2A3, CYP2C11, CYP2C80, CYP2S1, CYP2W1, CYP4A8, CYP4F18 and CYP4F40 were below detection.
GST isoform expression
All GST isoform expression data from Experiment 2 are presented in with a select number depicted in . Animals treated with ATR once daily for four days with 50 and 100 mg/kg showed a significant increase in expression levels in GSTA3, GSTO1 and mGST2 compared to control (). GSTA4 and GSTK1 were elevated compared to controls after four days of treatment but only at the highest dose of 100 mg/kg/day (; ). After eight days of treatment, all GST isoforms, with the exception of GSTO2, mGST1 and mGST2, showed an increase in expression at 100 mg/kg/day compared to controls (). Furthermore, animals treated for eight days with ATR also showed an increased expression for GSTt1 at 6.5, 50 and 100 mg/kg/day compared to control. GSTP1, mGST1, GSTA3, GSTA4, GSTK1, GSTM2, GSTM3, GSTO1 and GSTT1 all showed an increase in expression after eight days at 50 mg/kg/day compared to control (; ). Conversely, after 14 days of treatment, only mGST2 at 100 mg/kg/day was significantly elevated above control. None of the other GST expression levels were significantly elevated above control levels after 14 days of treatment. Three GST isoforms, GSTA4, GSTK1 and mGST1, were below control levels in the 50 mg/kg/day ATR animals. While not statistically significant in all cases, multiple GST isoform expression levels (GSTA3, GSTA4, GSTK1, GSTM3, GSTT1 and mGST1) were trending lower after 14 days of 50 and/or 100 mg/kg of ATR treatment ().
Figure 5. Histograms depicting fold change in liver mRNA expression for (A) CYP2B2, (B) CYP2B3, (C) CYP2E1, (D) CYP2R1, (E) CYP3A18 and (F) CYP27A1 after 4, 8 and 14 days of treatment with vehicle (white bars), 6.5 mg/kg (light gray), 50 mg/kg (dark gray) or 100 mg/kg (black bars) of ATR. Data are presented as mean ± SEM; significant difference (p < 0.05; *compared to 0 mg/kg).
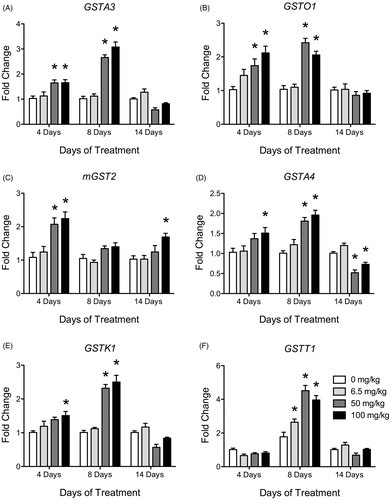
Table 3. Liver GST mRNA expression levels (±SEM) in atrazine treated rats summary values in fold change.
GST protein levels
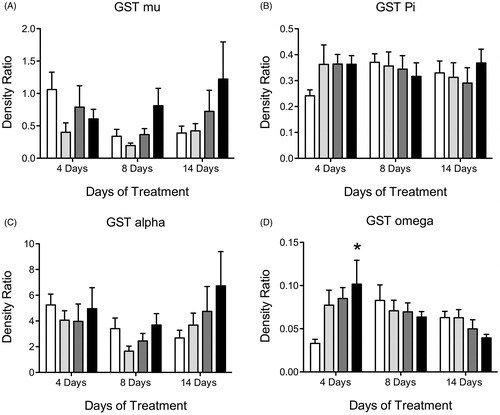
Using western blots, we found no significant difference in protein levels for GST M, GST P or GST A after 4, 8 or 14 days of ATR treatment (). GST O was elevated in the animals treated with 100 mg/kg/day when compared to controls but only on day 4 of treatment (, Supplemental Table 2).
Figure 6. Histogram depicting density ratio to beta actin levels of liver GST isoform proteins (A) GST mu, (B) GST pi, (C) GST alpha and (D) GST omega levels after 4, 8 and 14 days of treatment with vehicle (white bars), 6.5 mg/kg (light gray), 50 mg/kg (dark gray) or 100 mg/kg (black bars) of ATR. Data are presented as mean ± SEM; *significant difference (p < 0.05) versus corresponding control.
Bio-reactive GSH levels and GST activity
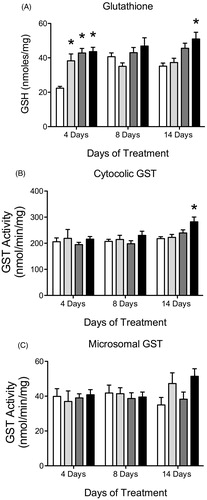
There was a significant treatment effect of ATR on GSH levels. ATR-treated animals showed increased liver GSH levels at 6.5, 50 and 100 mg/kg/day after four days of treatment compared to control and 100 mg/kg/day after 14 days of treatment (). ATR treatment did not have a significant effect on liver GSH levels after eight days of treatment at any dose. There was no increase in cGST or mGST activity after 4 or 8 days of treatment, but ATR treated animals showed an increase in cGST activity after 14 days of treatment in the 100 mg/kg/day group compared to control (). ATR treatment had no effect on mGST activity at any dose or duration of treatment ().
Figure 7. Histogram depicting liver (A) GSH levels in nmoles/mg protein, (B) cytosolic GST (cGST) activity in nmol/min/mg protein and (C) microsomal GST (mGST) activity in nmol/min/mg protein for all animals after 4, 8 and 14 days of treatment with vehicle (white bars), 6.5 mg/kg (light gray), 50 mg/kg (dark gray) or 100 mg/kg (black bars) of ATR. Data are presented as mean ± SEM; *significant difference (p < 0.05) versus control.
Discussion
In the present study, we characterized the changes in hepatic GST mRNA expression, GST protein levels, GST activity and GSH levels after 1, 2, 3 and 4 daily doses of 100 mg/kg of ATR. Considering the changes in phase II components identified in Experiment 1, in a follow up study, the hepatic expression 45 isoforms of CYP enzymes were analyzed in conjugation with phase II mediators GST expression, protein concentration and activity, along with GSH concentration after 4, 8 and 14 days of ATR at daily doses of 6.5, 50 or 100 mg/kg. Our results are consistent with previous studies that showed that both hepatic phase I CYP P450 and phase II GST enzymes play a role in the metabolism of ATR. In addition, by examining multiple time points and different doses, we demonstrated the presence of dynamic changes in the expression of hepatic enzymes linked to xenobiotic metabolism.
Of the 45 CYP enzyme isoforms evaluated for hepatic mRNA expression, levels were consistently below the limits of detection for 16 isoforms (CYP1A1, CYP1B1, CYP2A3, CYP2C11, CYP2C80, CYP2S1, CYP2W1, CYP4A8, CYP4F18, CYP4F40, CYP11A1, CYP11B1, CYP19A1, CYP24A1, CYP26B1 and CYP27B1). Expression of mRNA was not significantly altered in an additional six isoforms (CYP2C6, CYP2D4, CYP4B1, CYP4F4, CYP8B1 and CYP17A1) in animals administered ATR at doses of 6.5, 50 or 100 mg/kg/day for 4, 8 or 14 days. Of the 17 CYP isoforms where mRNA expression was significantly altered in the high-dose (100 mg/kg/day) group, seven isoforms displayed increased expression on day 4 (CYP2B3, CYP2C22, CYP2C23, CYP2R1, CYP3A23/3A1 and CYP39A) and mRNA expression was decreased in 1 isoform (CYP7B1). On day 8, mRNA expression was significantly increased in 13 isoforms (CYP2B3, CYP2C23, CYP2C7, CYP2D2, CYP2E1, CYP2F4, CYP3A18, CYP3A23/3A1, CYP4A3, CYP4F1, CYP4F6, CYP26C1 and CYP27A1), but no longer significantly increased in CYP2C22, CYP2R1 or CYP3A9. Also on day 8, CYP7B1 was no longer significantly decreased. On day 14, mRNA expression was increased in five isoforms that were previously increased on day 8 or day 4 (CYP2B3, CYP2C23, CYP2C7, CYP2E1 and CYP3A9) and was not significantly decreased in any isoform. One isoform was elevated in the 100 mg/kg group for the first time after 14 days (CYP2B2).
Based on these results it can be concluded that in the higher dose groups (50–100 mg/kg/day), CYP isoforms were generally not induced by day 4, reached a peak by day 8 and declined thereafter. Expression of CYP2B2 displayed the largest mean dose- and time-dependent increase after ATR treatment (, ). The expression of CYP7B1 and to a lesser extent CYP26C1, CYP2C6, CYP4A3, CYP4B1 and CYP8B1 were trending downward or significantly reduced in all groups on day 4 but not thereafter, indicating that ATZ may inhibit the expression of some CYP enzymes after initial exposure but the reduced expression is not sustained after prolonged treatment.
Previous studies have shown that CYP1A1/2, CYP2E1, CYP2B1/2, CYP2C6/11, CYP3A1/2 and CYP4A3 are involved in ATR metabolism or that their expression is modified by ATR treatment. However, previous studies were limited by the variety of CYP enzymes expressed in particular cell lines or microsomal preparations and by antibody and substrate specificity. For example, Hanioka et al. (Citation1998a,Citationb), using liver microsomes from both male and female SD rats, found that CYP1A2 was not involved in the metabolism of ATR and CYP1A2 protein levels were not affected by ATR exposure (Hanioka et al., Citation1998a). However, the same group examined CYP1A2 and its inducibility after ATR treatment using male SD rat liver microsomes, and found that CYP1A2 plays a minor role in the N-monodealkylation of ATR (Hanioka et al., Citation1998b). Another study using immunoblots in male Fischer rats found that ATR exposure significantly increased CYP1A2 protein levels (Islam et al., Citation2002). Peripubertal male Wistar rats gavaged with 200 mg/kg/day of ATR from postnatal day 23 to day 50 displayed increased CYP1A1/2 activity (Pogrmic-Majkic et al., Citation2012), again suggesting that CYP1A1/2 is involved in the phase I biotransformation of ATR or, at the very least, is responsive to ATR treatment. In our study, CYP1A2 was significantly elevated only after four days of 50 mg/kg/day of ATR and there were no changes in CYP1A2 at other treatment duration or dose. The limited induction of CYP1A2 in the current study mirrors the inconsistent findings from previous reports involving ATR metabolism.
CYP2E1 has also been implicated in the biotransformation of ATR in both male and female SD rat liver microsomes (Jaeger et al., Citation1998). Our results show an over three-fold increase in mRNA expression after treatment with 50 and 100 mg/kg/day of ATR after eight days which was sustained after 14 days, indicating ATR treatment might regulate CYP2E1, supporting its role in ATR metabolism. Likewise, CYP2B2 and CYP4A3 showed a dose-dependent increase in expression throughout the study. This is consistent with previous studies which have shown that CYP2B1/2 and CYP2B2 play a role in the metabolism of ATR (Hanioka et al., Citation1998a, 1999; Islam et al., Citation2002; Pogrmic-Majkic et al., Citation2012). CYP2C6, which has been shown to be involved in the metabolism of ATR in male rat liver microsomes (Hanioka et al., Citation1998a,Citationb), did not show a statistically significant increase in expression compared to control groups in the present study (). Nevertheless, mRNA expression levels were elevated, but not significantly, on day 8 in the 50 and 100 mg/kg/day dose groups and in all groups on day 14.
ATR treatment also led to an increase in the expression of several CYP isoforms associated with oxidative stress and inflammation. CYP4F1, CYP4F4 and CYP4F6, which have all been shown to be involved in the omega-hydroxylation of leukotriene B4, a potent mediator of inflammation. It is believed that the omega-hydroxylation of leukotriene B4 helps to reduce the number of inflammatory signals and resolve the inflammation process. In our study, a transient but significant increase in CYP4F1 and CYP4F6 expression was noted in the mid- and high-dose groups on day 8 but not on day 14. In addition, the expression of mGST2 was increased above control after 14 days of treatment. mGSTs are also involved in the biosynthesis of leukotrienes which help to protect against oxidative stress (Jakobsson et al., Citation1999). Collectively, these results suggest that the potential oxidative stress following high doses of ATR likely results in increased expression of both mGST and CYP4F enzymes. Indeed, previous studies have indicated that ATR can cause oxidative stress in rats if given at high enough doses and for a long enough duration of time (Abarikwu et al., Citation2010; Singh et al., Citation2010). Similarly, CYP26A1 and CYP26C1 are trans-retinoic acid hydrolyses that regulate the cellular concentrations of ATR via oxidative metabolism (Topletz et al., Citation2012). We found a statistically significant, two-fold increase of CYP26A1 mRNA expression on day 8 in the 50 mg/kg dose group and non-significant decreased expression of CYP26C1 in all groups after four days and increased expression after 8 or 14 days.
The current study identified a large number of CYP enzymes which demonstrated altered mRNA expression after ATR treatment but have not previously been linked to ATR treatment. CYP2D2, CYP2C7, CYP2R1, CYP3A18 and CYP3A23/3A1 all showed increased expression after 4 and 8 days of ATR treatment compared to control, but by 14 days of ATR treatment, expression levels were back to control levels. These CYP isoforms are regulated following short-term ATR exposure and might be involved in the initial metabolism of or represent an adaptive response to ATR exposure. The expression of CYP17A1, an enzyme with 17-alpha-hydroxylase and 17,20-lyase activities that catalyzes the conversion of pregnenolone to dehydroepiandrosterone (DHEA) (Payne & Hales, Citation2004), was not statistically significantly elevated in our study. CYP27A1, which is known to perform the 27-hydroxylation of cholesterol, displayed an approximate two-fold increased expression on day 8 and 14 in the mid- and high-dose (50 and 100 mg/kg/day) groups.
In the assessment of the effect of ATR on hepatic GST expression (Experiment 1), significant elevations in mRNA levels were observed in five GST isoforms of GST on day 3 and in 11 GST isoforms on day 4. Hepatic GSTM2, GSTK1, GSTO1, GSTO2, GSTT1, GSTT2 and two microsomal GST isoforms, mGST1 and mGST2, which have not been previously examined in ATR-treated animals, all showed increased expression. GSTP1 and GSTM1 showed more than a two-fold increase in expression. This increase in GSTP1 expression is consistent with previous studies, which indicated that GSTP is responsible for the majority of the GSH-dependent phase II metabolism of ATR in the liver of mice (Abel et al., Citation2004; Egaas et al., Citation1993). However, to our knowledge, we are the first to report increased hepatic GSTM1 after ATR treatment.
After eight days of ATR treatment at 100 mg/kg/day, mRNA expression levels of all GST isoforms with the exception of GSTO2, mGST1 and mGST2 were elevated above controls. Animals administered eight daily ATR doses of 50 mg/kg also showed significantly increased expression of the majority of GST isoforms examined. GSTT1 expression was also elevated above control levels in all dose groups on day 8 but not on day 4 or 14. Islam et al. (Citation2002) reported increased GSTP expression following treatment with 10 mg/kg of ATR after three days of treatment, suggesting that the regulation of phase II metabolism components is responsive to relatively low doses of ATR.
By day 14 of treatment, all GST isoform expression was at control levels except for elevated mGST2 expression and a reduction in GSTA4 and GSTT2 expression. Considering the reduction in expression of several GST isoforms in the liver after 14 consecutive days with high doses of ATR, the possibility that prolonged dosing resulted in liver necrosis was considered. However, as reported by Campos-Pereira et al., high doses of ATR (400 mg/kg) administered for 14 days failed to produce necrosis in the liver, so it is unlikely the lower doses used in the present study resulted in liver damage (Campos-Pereira et al., Citation2012). Furthermore, there was no evidence of hepatotoxicity in either male or female rats administered ATR in the diet for 90 days at average daily doses as high as 34.5 mg/kg (Breckenridge et al., Citation2010).
To determine if increased mRNA expression of GST enzymes corresponded with increased GST protein level, we evaluated the effect of ATR on protein levels of four GST isoforms (GST M, GST O, GST P and GST A). In Experiment 1, protein levels of these isoforms in liver were not increased in rats administered ATR at a dose of 100 mg/kg/day for 1 to 4 days. In Experiment 2, GST O was increased after four days of treatment with 100 mg/kg of ATR, but there was no other significant difference between ATR-treated animals at any dose or time point. However, the mean GST O protein level in the control group on day 4 was significantly less than the control group mean on day 8 and 14. This difference may account for the significant difference in mean GST O protein level in the 100 mg/kg ATR group on day 4 in Experiment 2. Overall, the results are consistent with those of Campos-Pereira et al. and Islam et al., who reported that there was no significant difference in the protein level of GST protein levels, following ATR treatment (Campos-Pereira et al., Citation2012; Islam et al., Citation2002). ATR-induced increase in mRNA expression of GST isoforms, without a corresponding rise in protein levels in the same liver samples, could suggest that repeated ATR treatment upregulates transcription of GST isoforms without driving significant translation and protein production. Alternatively, high-doses of ATR might increase protein levels of specific GST isoforms without altering the level of all detectable GST biotransformation enzymes. Increased protein levels and/or activity in a specific isoform is difficult to discern due to limitations in current antibody specificity.
Considering the limitation in GST isoform protein quantification, we evaluated cytosolic and microsomal GST activity and quantified the amount of the liver GST substrate, GSH. In Experiment 1, cytosolic GST activity and GSH levels were both significantly increased after three or four daily doses of 100 mg/kg ATR (), whereas in Experiment 2, GSH levels were increased after four daily doses of 6.5, 50 or 100 mg/kg ATR but cytosolic GST activity was unaffected at days 4 and 8 but increased in the high-dose group on day 14. It is interesting to note that on day 8, the majority of GST isoforms were at their highest expression levels, yet overall cytosolic GST levels were not increased. This suggests that the increased expression of GST levels on day 8 may have been triggered by higher level of GSH utilization earlier on day 4 and perhaps between day 4 and day 8. These results suggest that repeated doses of ATR upregulates the expression and availability of GSH, thereby facilitating GST-mediated phase II elimination of ATR and the other chlorotriazine metabolites as suggested by results from other laboratories (Buchholz et al., Citation1999; Egaas et al., Citation1995a,Citationb; Jaeger et al., Citation1998; Lucas et al., Citation1993).
The tolerance of maize to chlorotriazines has been linked to higher levels of expression and activity of GST (Timmerman, Citation1989) and that when weeds develop resistance to ATR, it is often attributed to increased expression/activity of GST in the resistant weed (Anderson & Gronwald, Citation1991; Evans et al., Citation2017). In a pharmacokinetic model of ATR (Campbell et al., Citation2016), it has been demonstrated that the clearance of chlorotriazines from plasma was most sensitive to the rate of elimination of the ATR metabolite, DACT (Breckenridge et al., Citation2016). Thus, the rate of the clearance of ATR and its metabolites from plasma is directly dependent on GSH levels and GST expression and activity in the liver and kidney. The present study has shown that hepatic levels of GSH and GST isoform expression reaches a maximum around day 8. In the animals that displayed time-dependent changes in GSH levels and GST expression, these same animals also displayed a time-dependent change in their biological response to ATR (Breckenridge et al., Citation2017). Thus, a dose-dependent maximum attenuation of the LH surge was observed in animals administered ATR for four days but decreases with longer ATR treatment. Similarly, the ATR-induced rise in plasma corticosterone levels is present at 1–4 days of treatment but absent by seven days of treatment (Breckenridge et al., Citation2017). The altered hormone responses to repeated ATR treatment align with our present findings that expression of components of both phase I and II hepatic metabolisms of ATR are elevated at similar time points after repeated ATR treatment.
In the current study, we examined the hepatic expression, protein levels and activity levels of the primary component enzymes and substrates for GST-mediated phase II biotransformation as well as the expression of 45 CYP isoforms involved in phase I xenobiotic metabolism in ATR-treated animals. Our research reports novel findings that ATR exposure differentially regulates the expression of a number of CYP and GST isoforms as well as GST-mediated metabolism components. ATR treatment over a longer period of time leads to variations in the expression of hepatic phase I CYP and phase II GST enzymes compared to shorter-term ATR treatment, which may be due to liver adaptation. We have validated previous findings, but have also identified novel players in the hepatic effects of high dose ATR treatment. From a human safety perspective, it is likely that human exposure to ATR and the chlorotriazines is too low to trigger either adverse effects on reproduction (Breckenridge et al., Citation2016; DeSesso et al., Citation2014; Foradori et al., Citation2014) or the apparent adaptive changes in CYP and GST enzyme expression observed in the present study after repeated doses of ATR.
Declaration of interest
This work was supported by Syngenta Crop Protection, LLC. The in-life phase of the study was conducted under contract to Syngenta at WIL Research in Ashland, OH where Pragati Sawhney Coder served as the study director. The liver enzyme analyses were conduct and supervised by the Principle Investigator, Chad Foradori who received grants from Syngenta to conduct this work. Charles B. Breckenridge and Kun D. Yi are current (KDU) or former (CBB) employee of Syngenta Crop Protection, LLC, which is a basic manufacturer and distributor of atrazine.
Supplementary material available online
IXEN_1374486_Supplementary_Material.pdf
Download PDF (153.1 KB)Related Research Data
References
- Abarikwu SO, Adesiyan AC, Oyeloja TO, et al. (2010). Changes in sperm characteristics and induction of oxidative stress in the testis and epididymis of experimental rats by a herbicide, atrazine. Arch Environ Contam Toxicol 58:874–82
- Abel EL, Opp SM, Verlinde CL, et al. (2004). Characterization of atrazine biotransformation by human and murine glutathione S-transferases. Toxicol Sci 80:230–8
- Anderson MP, Gronwald JW. (1991). Atrazine resistance in a velvetleaf (Abutilon theophrasti) biotype due to enhanced glutathione S-transferase activity. Plant Physiol 96:104–9
- Bradford MM. (1976). A rapid and sensitive method for the quantitation of microgram quantities of protein utilizing the principle of protein-dye binding. Anal Biochem 72:248–54
- Breckenridge BC, Simpkins J, Eldridge JC, Stevens JT. (2010). Symmetrical triazine herbicides: a review of regulatory endpoints. In: Kreiger R, ed. Handbook of pesticide toxicology: agents. New York: Academic Press, Inc., 1711–23
- Breckenridge CB, Campbell JL, Clewell HJ, et al. (2016). PBPK-based probabilistic risk assessment for total chlorotriazines in drinking water. Toxicol Sci 150:269–82
- Breckenridge CB, Foradori CD, Coder PS, et al. (2017). Changes in sensitivity to the effects of atrazine on the LH surge in female SD rats after repeated daily doses: correlation with liver enzyme expression. Birth Defects Res, accepted for publication. DOI: 10.1002/bdr2.1130
- Buchholz BA, Fultz E, Haack KW, et al. (1999). HPLC-accelerator MS measurement of atrazine metabolites in human urine after dermal exposure. Anal Chem 71:3519–25
- Campbell JL Jr, Andersen ME, Hinderliter PM, et al. (2016). PBPK model for atrazine and its chlorotriazine metabolites in rat and human. Toxicol Sci 150:441–53
- Campos-Pereira FD, Oliveira CA, Pigoso AA, et al. (2012). Early cytotoxic and genotoxic effects of atrazine on Wistar rat liver: a morphological, immunohistochemical, biochemical, and molecular study. Ecotoxicol Environ Saf 78:170–7
- DeSesso JM, Scialli AR, White TE, Breckenridge CB. (2014). Multigeneration reproduction and male developmental toxicity studies on atrazine in rats. Birth Defects Res B Dev Reprod Toxicol 101:237–53
- Egaas E, Falls JG, Dauterman WC. (1995a). A study of gender, strain and age differences in mouse liver glutathione-S-transferase. Comp Biochem Physiol C Pharmacol Toxicol Endocrinol 110:35–40
- Egaas E, Falls JG, Svendsen NO, et al. (1995b). Strain- and sex-specific differences in the glutathione S-transferase class pi in the mouse examined by gradient elution of the glutathione-affinity matrix and reverse-phase high performance liquid chromatography. Biochim Biophys Acta 1243:256–64
- Egaas E, Skaare JU, Svendsen NO, et al. (1993). A comparative study of effects of atrazine on xenobiotic metabolizing enzymes in fish and insect, and of the in vitro phase II atrazine metabolism in some fish, insects, mammals and one plant species. Comp Biochem Physiol C Comp Pharmacol Toxicol 106:141–9
- Evans AF, Jr O'brien SR, Ma R, et al. (2017). Biochemical characterization of metabolism-based atrazine resistance in Amaranthus tuberculatus and identification of an expressed GST associated with resistance. Plant Biotechnol J 15:1238–49
- Foradori CD, Hinds LR, Quihuis AM, et al. (2011). The differential effect of atrazine on luteinizing hormone release in adrenalectomized adult female Wistar rats. Biol Reprod 85:684–9
- Foradori CD, Sawhney Coder P, Tisdel M, et al. (2014). The effect of atrazine administered by gavage or in diet on the LH surge and reproductive performance in intact female Sprague-Dawley and Long Evans rats. Birth Defects Res B Dev Reprod Toxicol 101:262–75
- Foradori CD, Zimmerman AD, Coder PS, et al. (2017). Lack of immunotoxic effects of repeated exposure to atrazine associated with the adaptation of adrenal gland activation. Regul Toxicol Pharmacol 89:200–14
- Fraites MJ, Cooper RL, Buckalew A, et al. (2009). Characterization of the hypothalamic-pituitary-adrenal axis response to atrazine and metabolites in the female rat. Toxicol Sci 112:88–99
- Good NE. (1961). Inhibitors of the Hill reaction. Plant Physiol 36:788–803
- Gysin H, Knuesli E. (1960) Chemistry and herbicidal properties of triazine derivatives. New York: Wiley (Interscience)
- Hanioka N, Jinno H, Kitazawa K, et al. (1998a). In vitro biotransformation of atrazine by rat liver microsomal cytochrome P450 enzymes. Chem-Biol Interact 116:181–98
- Hanioka N, Jinno H, Tanaka-Kagawa T, et al. (1998b). Changes in rat liver cytochrome P450 enzymes by atrazine and simazine treatment. Xenobiotica 28:683–98
- Hanioka N, Jinno H, Tanaka-Kagawa T, et al. (1999). In vitro metabolism of chlorotriazines: characterization of simazine, atrazine, and propazine metabolism using liver microsomes from rats treated with various cytochrome P450 inducers. Toxicol Appl Pharmacol 156:195–205
- Islam MO, Hara M, Miyake J. (2002). Induction of P-glycoprotein, glutathione-S-transferase and cytochrome P450 in rat liver by atrazine. Environ Toxicol Pharmacol 12:1–6
- Jaeger LL, Jones AD, Hammock BD. (1998). Development of an enzyme-linked immunosorbent assay for atrazine mercapturic acid in human urine. Chem Res Toxicol 11:342–52
- Jakobsson PJ, Morgenstern R, Mancini J, et al. (1999). Common structural features of MAPEG – a widespread superfamily of membrane associated proteins with highly divergent functions in eicosanoid and glutathione metabolism. Protein Sci 8:689–92
- Lang D, Criegee D, Grothusen A, et al. (1996). In vitro metabolism of atrazine, terbuthylazine, ametryne, and terbutryne in rats, pigs, and humans. Drug Metab Dispos 24:859–65
- Laws SC, Hotchkiss M, Ferrell J, et al. (2009). Chlorotriazine herbicides and metabolites activate an ACTH-dependent release of corticosterone in male Wistar rats. Toxicol Sci 112:78–87
- Lucas AD, Jones AD, Goodrow MH, et al. (1993). Determination of atrazine metabolites in human urine: development of a biomarker of exposure. Chem Res Toxicol 6:107–16
- McMullin TS, Brzezicki JM, Cranmer BK, et al. (2003). Pharmacokinetic modeling of disposition and time-course studies with [14C]atrazine. J Toxicol Environ Health A 66:941–64
- Payne AH, Hales DB. (2004). Overview of steroidogenic enzymes in the pathway from cholesterol to active steroid hormones. Endocr Rev 25:947–70
- Pogrmic-Majkic K, Kaisarevic S, Fa S, et al. (2012). Atrazine effects on antioxidant status and xenobiotic metabolizing enzymes after oral administration in peripubertal male rat. Environ Toxicol Pharmacol 34:495–501
- Pruett SB, Fan R, Zheng Q, et al. (2003). Modeling and predicting immunological effects of chemical stressors: characterization of a quantitative biomarker for immunological changes caused by atrazine and ethanol. Toxicol Sci 75:343–54
- Singh M, Sandhir R, Kiran R. (2010). Oxidative stress induced by atrazine in rat erythrocytes: mitigating effect of vitamin E. Toxicol Mech Methods 20:119–26
- Timmerman KP. (1989). Molecular characterization of corn glutathione S-transferase isozymes involved in herbicide detoxication. Physiol Plant 77:465–71
- Topletz AR, Thatcher JE, Zelter A, et al. (2012). Comparison of the function and expression of CYP26A1 and CYP26B1, the two retinoic acid hydroxylases. Biochem Pharmacol 83:149–63
- USDA. (2006). Agricultural chemical usage 2005 field crops summary. Washington (DC): United States Department of Agriculture