
 ?Mathematical formulae have been encoded as MathML and are displayed in this HTML version using MathJax in order to improve their display. Uncheck the box to turn MathJax off. This feature requires Javascript. Click on a formula to zoom.
Abstract
Determine the inhibition mechanism through which cyclosporine inhibits the uptake and metabolism of atorvastatin in fresh rat hepatocytes using mechanistic models applied to data generated using a high throughput oil spin method.
Atorvastatin was incubated in fresh rat hepatocytes (0.05–150 nmol/ml) with or without 20 min pre-incubation with 10 nmol/ml cyclosporine and sampled over 0.25–60 min using a high throughput oil spin method. Micro-rate constant and macro-rate constant mechanistic models were ranked based on goodness of fit values.
The best fitting model to the data was a micro-rate constant mechanistic model including non-competitive inhibition of uptake and competitive inhibition of metabolism by cyclosporine (Model 2). The association rate constant for atorvastatin was 150-fold greater than the dissociation rate constant and 10-fold greater than the translocation into the cell. The association and dissociation rate constants for cyclosporine were 7-fold smaller and 10-fold greater, respectively, than atorvastatin. The simulated atorvastatin-transporter-cyclosporine complex derived using the micro-rate constant parameter estimates increased in line with the incubation concentration of atorvastatin.
The increased amount of data generated with the high throughput oil spin method, combined with a micro-rate constant mechanistic model helps to explain the inhibition of uptake by cyclosporine following pre-incubation.
Introduction
Movement from the blood into the liver is a key component of the elimination of drugs from the body. From there they may be metabolised, excreted into the bile or excreted back into the blood (Shitara et al., Citation2006). If the majority of the clearance from the blood into the liver is via a transporter protein, and this is much greater than the relevant metabolic and/or biliary clearance, then this is a rate limiting step in the elimination of the drug from the body (Kimoto et al., Citation2015; Patilea-Vrana & Unadkat, Citation2016). For example for carboxylic acids (e.g. atorvastatin), uptake of drugs into the liver via a saturable carrier protein such as organic anion transporting polypeptide (OATP) may be the rate limiting step in clearance from the blood (Shitara, Citation2011).
Atorvastatin is an HMG-CoA reductase inhibitor used to treat hypercholesterolaemia, and is the third most prescribed drug in the USA (Fuentes et al., Citation2018). Atorvastatin is taken up into hepatocytes with; 96%–98% of the uptake as carrier mediated in rat hepatocytes, high intracellular binding (fraction unbound = 0.011–0.015; Kulkarni et al., Citation2016; Paine et al., Citation2008; Yabe et al., Citation2011), and metabolism through rCyp3a into ortho or para substituted hydroxylated metabolites (Lau et al., Citation2006; Watanabe et al., Citation2010).
Cyclosporine (CsA) is an effective immunosupressant for use in organ transplantation, but its use is now limited due to cholestasis and nephrotoxicity (Fricker & Fahr, Citation1997) and has largely been replaced by immunosuppressants with less severe side effects, such as tacrolimus (Amundsen et al., Citation2012; Skalicka et al., Citation2009). CsA inhibits the uptake of both endogenous acids such as taurocholic acid (Fricker & Fahr, Citation1997) and xenobiotics such as atorvastatin (Amundsen et al., Citation2010) and pitavastatin (Shitara & Sugiyama, Citation2017) in a competitive (Amundsen et al., Citation2010) or non-competitive manner (Shitara & Sugiyama, Citation2017), depending on whether the inhibitor is co-incubated or pre-incubated respectively. Disposition of CsA in rat hepatocytes has been shown to be passive with no contribution from transporters and reaches a steady state within ∼5 min with 86% of the initial dose bound to membrane and intracellular constituents. Any free drug is then metabolised slowly by rCyp3a (Prueksaritanont et al., Citation1992; Umehara & Camenisch, Citation2012). The membrane binding of CsA after 5 min was found to be associated with an 85 KDa protein (Ziegler & Frimmer, Citation1986), which is the same as rOatp (Hagenbuch & Gui, Citation2008).
Statins are often dosed concomitantly with immunosuppressants in the clinic to treat the associated hypercholesterolaemia that occurs after organ transplantation, making the assessment of inhibition of statin disposition highly important (Imamura et al., Citation2005; Skalicka et al., Citation2009). The inhibition seen in vitro with atorvastatin and CsA, was also observed clinically in healthy volunteers with a 15-fold higher plasma exposure of atorvastatin and its metabolites compared to those on tacrolimus, with an increased risk of rhabdomyolysis in chronic patients (Lemahieu et al., Citation2005).
In order to investigate the uptake of substrates in suspended hepatocytes, some means of separating the cells from the media following incubation is required. Soars et al. (Citation2007) and Harrison et al. (Citation2018) rapidly centrifuged samples, and then analysed the loss from the media assuming no or little loss of material from the cells. A more complex method is to spin the media containing hepatocytes in an individual microtube through a layer of oil into a dense bottom layer in which the cells are lysed and then analyse the pellet. The use of the oil spin method, was initially limited to radiolabelled substrates (Schwarz et al., Citation1975) with possible confusion from metabolites, until the more readily accessible analysis by liquid chromatography–mass spectrometry (LC-MS) was developed (Baker & Parton, Citation2007; Lu et al., Citation2006). The advantage of individual microtubes is that suitable centrifuges with a rapid acceleration and deceleration are available, and this determines when the earliest timepoint for measurement can be taken. Li et al. (Citation2013) described a high throughput oil spin method in an 8-well format, with the first timepoint at 30 s, which was the first paper to show a method using more than a single microtube to increase the throughput of the oil spin method. To further increase the throughput of the assay, the method used in Li et al. (Citation2013) needs to be miniaturised to make use of a centrifuge with an acceleration and deceleration similar to those used with individual microtubes.
It is increasingly common to use compartmental mechanistic models to simultaneously describe the data obtained from hepatocytes across a range of concentrations and timepoints (Baker & Parton, Citation2007; Grandjean et al., Citation2014a; Menochet et al., Citation2012b; Shitara & Sugiyama, Citation2017). Unlike the two-step method published by Ishigami et al. (Citation1995), mechanistic models do not assume linearity over initial timepoints (Li et al., Citation2013), and can be used to describe the kinetics of substrate and quantifiable metabolites as well as differences in passive rates travelling to and from the cell (Grandjean et al., Citation2014a; Menochet et al., Citation2012b), to enable better predictions of human pharmacokinetics for transporter substrates (Jones et al., Citation2012). The use of mechanistic models derived using the Michaelis-Menten kinetics equation (termed macro-rate constant models in this article) are based on assumptions originally designed for use in enzymology and applied to transporters: It is assumed that the association to the transporter is very rapid in comparison to the dissociation from the transporter and that the amount of substrate at the transporter is much larger than the total amount of transporters and thus the substrate is at equilibrium in a very short space of time (Grandjean et al., Citation2014a; Segel, Citation1993b). It then follows that the rate of translocation into the cell is the rate limiting step in the movement of substrate into the cell (Grandjean et al., Citation2014a; Segel, Citation1993b). However, these assumptions are not formally tested, but can be done so through the use of micro-rate constant mechanistic models.
The aim of this paper is to determine the mechanism of inhibition of CsA on the uptake and metabolism of atorvastatin in fresh rat hepatocytes. This will be met through the following objectives: develop a novel high throughput oil-spin method optimised for use with fresh rat hepatocytes that allows multiple concentrations to be assessed simultaneously; the amount of information obtained will then be used to develop and compare micro-rate constant and Michaelis-Menten (macro-rate constant) mechanistic models to simultaneously describe the initial uptake kinetics and metabolism of atorvastatin, and the complex inhibition exhibited by cyclosporine; the Michaelis-Menten assumptions described above can be formally tested; the mechanistic models will be guided by a structural identifiability analysis to aid in parameter estimation.
Methods
Chemicals
Atorvastatin sodium was obtained from Sequoia Research Products Ltd (Pangbourne, UK). Cyclosporine, Percoll, high temperature silicone oil (175633), Krebs-Henseleit buffer powder (KHB, 1L), sodium chloride, HEPES, collagenase (C5138) and Trypan blue (0.4%) were obtained from Sigma-Aldrich (Poole, UK). Dimethyl sulfoxide (DMSO), methanol and water were obtained from Thermo Fisher Scientific Inc. (Loughborough, UK) and were of analytical grade.
Animals
Male Lewis rats (350–480 g) were obtained from Charles River (Margate, UK). They were housed three to a cage lined with sawdust, forage mix and shredded paper in rooms maintained at a temperature of 20 ± 2 °C with a relative humidity of 45%–55% on a 12 h light:dark cycle with access to food and water ad libitum. All procedures performed were approved by the local UCB ethical review committee according to the Home Office animal procedures act (1986) by licenced individuals. Data were generated from cells isolated from three rats on different occasions.
Isolation of hepatocytes
Hepatocytes were isolated using a two stage liver perfusion with collagenase (Seglen, Citation1976), with the exception that collagenase was perfused at only 20–24 ml/min and not 50 ml/min to prevent undue pressure increases in the liver. Under terminal general anaesthesia with isoflurane, the liver was perfused with a calcium free-buffer (500 ml Liver Perfusion Medium, Invitrogen, Paisley, UK) at a rate of 25 ml/min in a humid 38 °C temperature controlled cabinet. The medium was then changed to modified KHB (118 mM NaCl, 5 mM KCl, 1.1 mM MgSO4, 2.5 mM CaCl2, 1.2 mM KH2PO4, 25 mM NaHCO3, 10 mM glucose supplemented with 12.5 mM HEPES [pH 7.4]) and saturated with O2/CO2, containing collagenase (0.012%–0.013% w/v). Both the liver perfusion medium and modified KHB containing collagenase were kept at 38 °C in jacketed beakers and stirred and gassed continuously with 95% O2/5% CO2 for at least 20 min prior to use. The liver was then dissected free and transferred to ice cold modified KHB, the cells were released by the use of a cell scraper (Thermo Fisher Scientific Inc.) and filtered through 70 µm filters into 50 ml falcons (BD, Oxford, UK). The cells were centrifuged at 50 g for 5 min at 4 °C and the supernatant removed. The pellets were re-suspended in a 30:70 mixture of Percoll: modified KHB and spun at 70 g for 5 min at 7 °C. This step led to cells of high viability (>98%) as determined by the trypan blue (0.4%) exclusion test with greater than 250 × 106 cells/liver. The cells were kept on ice throughout isolation and used within 3 h of isolation.
Incubations
Custom-made 16-channel Teflon blocks (two columns of eight round-ended and bottomed troughs from Radleys, Saffron Walden, UK, see ) were pre-incubated with 2 ml of 2 × 10⁶ cells/ml for 20 min, at 38.9 °C (temperature inside the Teflon blocks was 37 °C) and 109 strokes/min, placed lengthwise in an oscillating water bath (Julabo, Peterborough, UK); using this technique, cells were gently agitated to keep them in suspension, while the large interface between medium and air helped achieve adequate oxygen exchange. Kolhatkar & Polli (Citation2010) simulated competitive and non-competitive experiments to determine what analysis method best returned the correct inhibition type. It was concluded that use of a single inhibitor concentration at or above the KI and numerous substrate concentrations were sufficient to correctly identify the type of inhibition (Kolhatkar & Polli, Citation2010) and was therefore initiated experimentally. CsA (2 mmol/l) was dissolved in DMSO and added during pre-incubation where required (or DMSO alone in controls), with a final concentration of 10 nmol/ml. Omnistrip (0.32 ml) PCR eight-tube strips (Thermo Fisher Scientific) were layered with 50 µl 3 M NaCl and 100 µl high temperature silicone oil and placed in a six-position PCR strip rotor in an Eppendorf 5417R centrifuge (Eppendorf, Cambridge, UK).
Figure 1. Flow chart of high throughput assay starting from incubation and separation of hepatocytes from the media via an oil spin method (steps 1–4) to extraction and analysis via LC-MS (steps 5–9). Numbers in squares relate to the step number in time order as described in the Methods section. LC-MS: liquid chromatography–mass spectrometry.
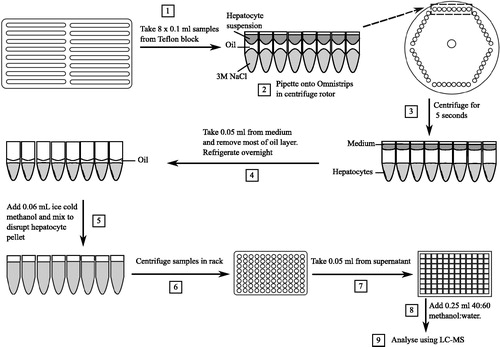
High temperature silicone oil was chosen as its density does not change significantly between room temperature and 37 °C (1.047 ± 0.006 and 1.043 ± 0.004 g/ml respectively, values are mean ± SD, n = 3) whilst still remaining more dense than modified KHB at 37 °C (1.024 ± 0.013 g/ml, values are mean ± SD, n = 3). The difference in density at 37 °C and shape of the menisci before centrifugation () is critical to ensure that the aqueous layers do not mix due to ‘flipping’, and this was the driving factor in miniaturising the assay. The high throughput method was initially validated against that obtained using the single tube method for UCB-X and was found to be similar to that obtained by Baker & Parton (Citation2007) (data not shown).
Following a pre-incubation of 20 min, 10 µl of atorvastatin solution (0.05, 0.25, 0.5, 2.5, 5, 25, 50 and 150 nmol/ml final concentration) in DMSO was spiked into the Teflon blocks using an 8-way multichannel pipette. 8 × 100 µl samples, containing an assumed 2 × 10⁵ cells (the minimum number of cells required to spin through the oil layer) were taken from the Teflon blocks (, step 1) at pre-defined timepoints (0.25, 0.58, 0.92, 1.25, 2.5, 5, 10, 20, 30, 40, 50 and 60 min), gently pipetted down the side of the Omnistrips and immediately centrifuged for 5 s up to ∼7000 rpm (, steps 2 and 3). This was sufficient for the cells to pellet into the bottom of the 3 M sodium chloride (bottom layer), and enabled the generation of a large number of samples within a short space of time (up to 384 samples in 80 min). The Omnistrips were then transferred to a 96 well matrix latch rack on ice for sample extraction (Thermo Fisher Scientific).
Carryover
To check for carryover, 150 nmol/ml of atorvastatin was incubated in modified KHB in the absence of cells at 37 °C in a Teflon block. 100 µl of media was taken and treated as per samples with hepatocytes. Carryover of atorvastatin was negligible (<0.1%, data not shown).
Sample extraction
Within 2 h of finishing the experiment, the top media layer and most of the middle oil layer were aspirated carefully to prevent the flipping of layers, and leaving sufficient volume of the oil to cover the bottom layer (, step 4). The remaining bottom and middle layer were refrigerated overnight to enable easier disruption of cells. Due to the centrifugation step, the menisci present before centrifugation were vastly decreased, making sample extraction more straightforward (see , steps 2 and 3). Ice cold methanol (60 µl, containing 600 pmol/ml dextromethorphan as an internal standard) was added to each tube and mixed using a multi-channel pipette on ice until the pellet was disrupted (, step 5). The matrix racks containing the Omnistrips were centrifuged at 4000 g at 5 °C for 5 min (, step 6), 50 µl of the supernatant was pipetted into a Phenomenex 2 ml deep well plate (Macclesfield, UK) and 250 µl of 40:60 methanol:water was added (, steps 6 and 7). Standard curves for atorvastatin were prepared as follows: 5, 1, 0.5, 0.1, 0.05, 0.01 and 0.005 mmol/l stocks were prepared in DMSO and then diluted by 1 in 100 in methanol giving final concentrations of 50, 10, 5, 1, 0.5, 0.1 and 0.05 nmol/ml, respectively. A 50 µl aliquot of this solution was then extracted as per the samples. To examine loss from the media, 50 µl of the top layer from the latter two studies was carefully removed from the four lowest concentrations across a range of timepoints (0.25, 0.58, 0.92, 1.25, 2.5, 5, 10, 20, 30, 40, 50 and 60 min) prior to aspiration of the top and middle layer, and frozen.
HPLC-MS analysis
Reconstituted samples were analysed by high-performance liquid chromatography (HPLC)–high resolution mass spectrometry (HRMS) operated in positive ion mode using an Accela HPLC system and a Q-Exactive Orbitrap mass spectrometer (Thermo Scientific, Hemel Hempstead, UK). For HPLC analysis, a Luna C18 100 Å 50 × 2 mm, 5 µm column (Phenomenex, Cheshire, UK) was used with a flow rate of 0.6 ml/min at 40 °C. Mobile phase A was composed of H2O containing 0.1% formic acid, and mobile phase B was composed of acetonitrile containing 0.1% formic acid. The gradient system used was as follows: initially, 20% of mobile phase B was held for 0.1 min followed by a linear gradient to 95% of mobile phase B from 0.1 to 0.8 min, 0.5 min at 95% of mobile phase B, a third linear gradient to 20% of mobile phase B at 1.3–1.31 min, and finally, a 0.49 min re-equilibration period at 20% of mobile phase B. Injections of 10 µl were made by a CTC Prep and Load (PAL) autosampler (CTC Analytics, Zwingen, Switzerland). For MS analysis, the capillary temperature was set at 380 °C, the source potential was 3100 V, and the source heater was set at 350 °C. Data were acquired in centroid mode at a resolution setting of 35000 (full width half maximum). The mass spectrometer was operated in a selected positive ion scanning mode, monitoring for the protonated mass of atorvastatin (MH559.26028) with an isolation window of 4 Da. The internal standard (dextromethorphan) was monitored at MH272.20151. The HPLC-MS data were acquired in a single run, processed and analysed using LCQuan software (version 2.7. Thermo Fisher Scientific Inc.). Atorvastatin demonstrated good linearity up to 50 nmol/ml with R2 > 0.99 and a limit of quantitation of 0.05 nmol/ml.
Data analysis
Assuming that 2 × 10⁵ cells were centrifuged into the 50 µl of 3 M NaCl, and that extraction of atorvastatin from the pellet into the methanol was complete, the bottom layer concentration was converted to cellular concentration using a cellular volume of per 1 × 10⁶ cells (Baker & Parton, Citation2007; Reinoso et al., Citation2001; Yoshikado et al., Citation2017):
(1)
(1)
where Vb is the volume of the bottom layer of 3 M NaCl (0.05 ml) and Vcell is the cell volume for 2 × 10⁵ cells. As multiple volumes have been reported for the cellular volume from 0.0022 to 0.0065 ml per 1 × 10⁶ cells (Baker & Parton, Citation2007; Reinoso et al., Citation2001; Yoshikado et al., Citation2017), initial micro-rate constant mechanistic models for atorvastatin only (see without inhibition) were evaluated in Monolix 2018R2 (Lixoft, Antony, France) with the inverse of the different volumes used as the observation in the model (see , EquationEquation (11)
(11)
(11) ). The Vcell estimate which best described the data was determined using the weighted Bayesian information criterion (wBIC; Burnham & Anderson, Citation2002):
(2)
(2)
Figure 2. Schematic of the micro-rate constant models (Models 1 and 2) consisting of medium, transporter and intracellular compartments, and macro-rate constant models (Models 3 and 4) consisting of medium and intracellular compartments. Atorvastatin following pre-incubation with CsA with competitive (a and c) and non-competitive (b and c) inhibition of uptake respectively were modelled. CsA: cyclosporine.
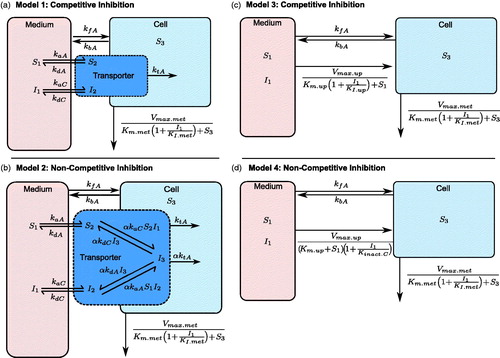
Table 1. Structural identifiability of the micro-rate constant models and macro-rate constant models, and goodness of fit values obtained during parameter estimation (Models 1–4).
and
(3)
(3)
where n is the total number of different models evaluated (in this case, three different volume models),
is the relative likelihood of the difference between the individual BIC (BICi) and the lowest BIC and
is the sum of relative likelihoods from the mechanistic models. A volume 0.0011 ml/2 × 105 cells, obtained using an initial estimate of 0.0013 ml/2 × 105 cells (Baker & Parton, Citation2007), with a wBIC ∼ 1 and was thus the most likely cell volume given the data. The volumes of 0.00078 ml/2 × 105 cells (Yoshikado et al., Citation2017) and 0.0004 ml/2 × 105 cells (Reinoso et al., Citation2001) each had a wBIC ∼ 0, and were therefore not used further. The reciprocal of Vcell from 0.0011 ml/2 × 105 cells = 906/ml used in the model observations (see Supplementary Material) was then fixed in the rest of the parameter estimations from the mechanistic models. Due to the large level of extraction of atorvastatin from the media into the cell, atorvastatin could only be detected in the media in four out of 24 samples in the incubations at 0.05 nmol/ml, and only up to 5 min at 2.5 nmol/ml. The data from medium loss were therefore not used in any further analysis due to their sparsity (data not shown). Qualitative metabolite identification for atorvastatin was conducted, but only semi-quantitative profiles were generated, metabolite standards were not available. Therefore whilst the semi-quantitative metabolite information is useful, it was not included in the mechanistic models, and can be found in the Supplementary Material.
Mechanistic models
The development of a nonlinear mathematical micro-rate constant model, with the use of two rate constants to describe passive movement of substrate between the medium and cells (kfA and kbA respectively), and the movement of substrates via a transporter compartment has been published for pitavastatin, defined as micro-rate constant models here (Grandjean et al., Citation2014a). Whilst a single passive rate constant, with transporter mediated uptake through Michaelis-Menten kinetics, with the inclusion of fraction unbound in the cell and medium and Michaelis-Menten metabolism was described by Menochet et al. (Citation2012a). Michaelis-Menten uptake models are defined as macro-rate constant models here.
In the present study, both micro-rate constant mechanistic models (, Models 1 and 2, see Supplementary Material for ODEs) and macro-rate constant mechanistic models (, Models 3 and 4, see Supplementary Material for ODEs) were evaluated for the uptake and metabolism of atorvastatin and the inhibition by CsA with the two passive rate constants given above, and the inclusion of metabolic clearance through the Michaelis-Menten equation. Two separate passive rate constants (kfA and kbA) were used, as the use of a single passive rate constant with a fraction unbound in the cell led to large deviations of the predicted concentrations from the observed concentrations for the macro-rate constant models (see Supplementary Material).
The amount of free transporters available for the uptake of atorvastatin (Tf) are not normally known, but the total amount of transporters (To) is assumed to be constant, then Tf can be eliminated via the conservation law derivation for transporters (Grandjean et al., Citation2014b) to give:
(4)
(4)
where S2 and I2 are the amount of atorvastatin and CsA bound to transporter respectively and I3 is the atorvastatin-transporter-CsA complex involved in non-competitive inhibition.
Structural identifiability of the mechanistic models
Prior to parameter estimation, it is important to determine, whether all of the parameters or combinations of parameters are identifiable and that the model is at least structurally locally identifiable (Bearup et al., Citation2013; Grandjean et al., Citation2014b). If any parameters are unidentifiable, then they can be effectively assigned any value during parameter estimation, without affecting the observations, making conclusions regarding the unidentifiable parameters and model responses difficult (Evans et al., Citation2002). All the mechanistic models were evaluated for structural identifiability given known inputs and output observations (see Supplementary Material) using the Identifiability Analysis package in Mathematica 11.3 (Anguelova et al., Citation2012; Karlsson et al., Citation2012).
Parameter estimation
The incubation concentrations of atorvastatin and CsA were converted to amounts (nmol) by multiplying by the sampled medium volume that holds 2 × 10⁵ cells (V1 = 0.1 ml). The final chosen model was based on the wBIC (EquationEquation (2)(2)
(2) ) to more harshly penalise over-parameterisation within the models compared to the Akaike information criterion (Aho et al., Citation2014; Burnham & Anderson, Citation2002), as well as the sum of the individual and population predictions of the relative mean square root error (RMSRE) given by:
(5)
(5)
where m is the total number of datapoints, and the sum of all individuals (i) and datapoints in the model.
Initial parameter estimates were obtained for atorvastatin only micro-rate constants using starting values of 1 for the transporter mediated parameters (kaA, kdA, ktA and To) and the passive rate constant out of the cell (kbA), as no literature information was available regarding the determination of these estimates within Monolix 2018R2 (Lixoft, Antony, France), whilst for the macro-rate constant parameters (Vmax.up, Km.up, Vmax.met and Km.met), initial atorvastatin parameter estimates were obtained through the use of a Yamazaki plot (Yamazaki et al., Citation1993) and a double-reciprocal (Lineweaver-Burke plot) for uptake and a double-reciprocal plot for metabolism (see Supplementary Material). For the simultaneous determination of parameter estimates for atorvastatin in the presence of CsA, all parameters were assumed to follow a log-normal distribution with a proportional residual error model in Monolix 2018R2. Only the parameter estimates for the best fitting model will be discussed (, Model 2), whilst the other models are included in the Supplementary Material for comparison purposes. To evaluate whether the parameter estimates for Model 2 were sensitive to the initial starting point, an assessment was undertaken in Monolix 2018R2 whereby the initial starting point was taken as a random number based on the final parameter estimates. This was conducted five times and the estimates obtained showing the lowest −2.LL are reported here, whilst the other parameter estimates obtained from the assessment are included in the Supplementary Material.
Comparison of parameter estimates to literature
To allow comparison between the parameter estimates obtained from the micro-rate constant models to known literature values, the equation used to describe saturable uptake is re-arranged to yield the classic Michaelis-Menten form for the parameter estimates obtained. This is based on the assumption that binding to the uptake transporter active site is extremely rapid and therefore considered to be at a pseudo steady state (Grandjean et al., Citation2014a), and that the amount of drug at the uptake transporter binding site is greater than the total amount of uptake transporter binding sites (Segel, Citation1993b) to give the maximum uptake velocity (Vmax.up):
(6)
(6)
where ktA is the atorvastatin translocation rate constant into the cell, To is the total amount of transporters involved in the uptake of atorvastatin (see Supplementary Material) and 1000 is the scalar translation from nmol/min/1 × 106 cells to pmol/min/1 × 106 cells. To enable the concentration at which 50% of uptake transporter binding sites are occupied (Km.up), calculated in nmol/ml, the transporter association rate constant for atorvastatin (kaA) must first be converted into ml/nmol/min/1 × 106 cells by multiplying by 0.5055 ml, the medium volume in which 1 × 10⁶ cells are present:
(7)
(7)
where kdA is the dissociation rate constant from the transporter for atorvastatin and V1= 0.5055 ml. To enable the inhibition dissociation constant (KI.up) to be calculated in nmol/ml, the transporter association rate constant for CsA (kaC) must be converted into ml/nmol/min/1 × 106 cells by multiplying by 0.5055 ml as per Km.up, and then calculated according to:
(8)
(8)
where kdC is the transporter dissociation rate constant from the transporter for CsA. Km.met and KI.met were converted to concentration (nmol/ml) by dividing by Vcell (0.0011 ml) and then multiplied up to per 1 × 10⁶ cells:
(9)
(9)
For comparison of non-competitive inhibition of uptake, KI.up needs to be multiplied by the dimensionless α term, which is used to determine the effect that CsA binding to the transporter has on the subsequent atorvastatin binding to transporter (Copeland, Citation2013):
(10)
(10)
Transporter uptake clearance (CLup) and metabolic clearance (CLmet) were calculated by dividing Vmax by Km for the relevant clearance:
(11)
(11)
For the passive component, conversion to a passive diffusion clearance into the cell (Pdif) or out of the cell (Pdef) were obtained by multiplication of the passive rate constants (kfA and kbA respectively) by the medium volume into which 1 × 10⁶ cells were present (i.e. kfA×500 µl), or the volume of 1 × 10⁶ cells (i.e. kbA×5.5 µl).
The figures in this paper were all generated in Inkscape version 0.93, or RStudio version 1.1.463 (RStudio Inc.) running R version 3.5.2 using cowplot with its dependencies (Wilke, Citation2016) and extrafont (Chang, Citation2014).
Results
High throughput method
The method described here took multiple concentrations simultaneously over a timecourse using eight-way Omnistrips, with an early sample possible at 15 s. Timecourses over 0.25–60 min for incubations of atorvastatin from 0.05 to 150 nmol/ml, in the absence or presence of CsA were obtained for all three experiments (see ), with no samples lost over the three experiments due to mixing of the oil and media layers. A total of 192 samples were obtained relatively simply using the high throughput method over a time period of 68 min, enabling substrate and substrate with inhibitor samples to be obtained from the same set of hepatocytes within the 3 h window for the use of fresh hepatocyte suspensions. The analysis of data from the three experiments in a single HPLC-MS run was undertaken to decrease inter-run variability, with a mean relative standard deviation across all datapoints of 25% and 33% for atorvastatin in the absence and presence of cyclosporine respectively.
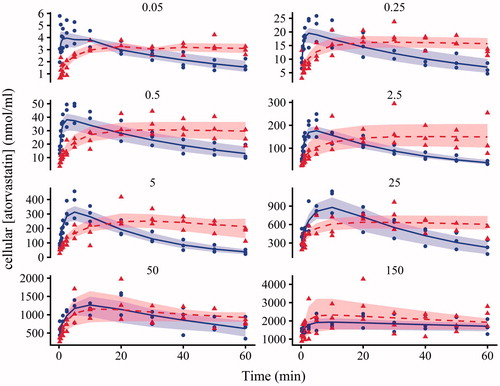
Figure 3. Plots of atorvastatin cellular concentration against time following the addition of atorvastatin (0.05, 0.25, 0.5, 2.5, 5, 25, 50 and 150 nmol/ml) in the absence (circles) and presence (triangles) of 10 nmol/ml of CsA. Each time course represents one experiment from one Teflon block trough. Shapes are data from the three separate experiments, the solid line and dashed line is the average individual prediction from Model 2 in the absence and presence of 10 nmol/ml of CsA, bounded by the max and min individual predictions (shading). CsA: cyclosporine.
Structural identifiability of the mechanistic models
The use of micro-rate constants to describe the uptake of atorvastatin in the presence of CsA, combined with competitive inhibition of the Michaelis-Menten metabolism (, Models 1 and 2 for competitive and non-competitive inhibition of uptake, respectively) and measurement of cellular atorvastatin were at least structurally locally identifiable, with no parameters required to be known a priori (see ). For the macro-rate constant models (, Models 3 and 4 for competitive and non-competitive inhibition of uptake respectively) with two Michaelis-Menten nonlinearities and measurement of cellular atorvastatin, the models were structurally unidentifiable unless two of the following parameters were known: Vmax.up, Kinact.up, KI.met, Km.up, KI.up and KI.met (see ) for Model 3 and 4 respectively. The structural unidentifiability for the macro-rate constant models was manifested in the parameter estimates associated with the metabolism of atorvastatin, with unrealistic estimates for the two unidentifiable parameters in Models 3 and 4 (Km.met = 340 [251–407] and 436 [296–544] nmol/ml, respectively, KI.met = 1.1 [1–1.3] and 0.32 [0.27–0.36] nmol/ml respectively, see Supplementary Material).
Mechanistic modelling and parameter estimates
The best fitting model based on the % RMSRE and wBIC was Model 2 (micro-rate constant model, including non-competitive inhibition of atorvastatin uptake by CsA, and competitive inhibition of atorvastatin metabolism by CsA (see , and Supplementary Material for ODEs). Both Models 1 and 2 were almost equal in terms of BIC values (5514.2 and 5513.8, respectively, ), with a wBIC and total % RMSRE that made Model 2 more favourable over Model 1 (wBIC = 0.54 and 0.45, respectively, % RMSRE = 69 and 82, respectively, ). The macro-rate constant models (Models 3 and 4, ) were unsupported as the best fitting models (wBIC ∼ 0, ), which coincides with the structural identifiability analysis results above.
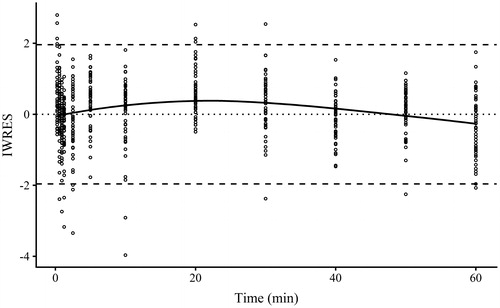
Model 2 visually fitted the atorvastatin data in the absence and presence of CsA relatively well (, blue and red, respectively), with a rapid increase up to a maximum at the same time as the data, which was more prolonged in the presence of CsA. CsA strongly inhibited the metabolism of atorvastatin within rat hepatocytes, as can be seen in the flat line in the individual predictions (see ). The population fits for each model had two to four times the % RMSRE compared to the individual fits (49%–96% and 21%–29%, respectively, see ), and therefore the individual parameter estimates are included and discussed for Model 2 only. A plot of the individual weighted residuals (IWRES) against time for all the data were normally distributed with a LOESS close to 0 (, solid line).
Figure 4. Plot of individual weighted residuals (IWRES) against time for Model 2 obtained using Monolix 2018R2. Points are IWRES, dashed lines are 95% confidence intervals and solid line is the locally estimated scatterplot smoothing of the IWRES.
The passive rate into the cell for atorvastatin (kfA) was nine times smaller than the passive rate out of the cell for atorvastatin (kbA), with large ranges on both parameters (1.1 [0.2–23.3] and 9.3 [0.6–36.5]/min/1 × 106 cells, respectively, ). The atorvastatin transporter association rate constant (kaA = 2.6 [1.2–13.3]/nmol/min/1 × 106 cells, ) was 10-fold greater than the translocation constant (ktA = 0.3 [0.2–0.3]/min/1 × 106 cells, ) and 150-fold greater than the atorvastatin transporter dissociation (kdA, 0.017 [0.015–0.021]/min/1 × 106 cells, ). It follows then that very quickly kaA approaches To (see , dotted blue line), and once atorvastatin is bound it is likely to be translocated into the cell. The CsA transporter association rate constant (kaC = 0.36 [0.33–0.37]/nmol/min/1 × 106 cells, ), was seven times smaller than kaA, whilst the CsA transporter dissociation rate constant (kdC = 0.16 [0.13–0.2]/min/1 × 106 cells) was 10 times greater than kdA.
Figure 5. Model 2 plots of the simulated amounts of atorvastatin bound to the transporter against time in the absence (dotted line) and presence (solid line) of cyclosporine (CsA). The dotted-dashed line is the amount of CsA bound to the transporter following pre-incubation, and the dashed line is the atorvastatin–transporter–CsA complex.
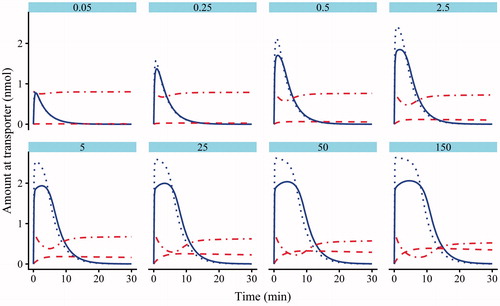
Table 2. Micro-rate constant model parameter estimates for the non-competitive inhibition of atorvastatin by CsA in rat hepatocytes (Model 2).
The Michaelis-Menten assumptions discussed previously (Grandjean et al., Citation2014a; Segel, Citation1993a) hold here for atorvastatin. This partially explains why the BIC values obtained for Models 2 and 4 are close between the micro-rate and macro-rate constant models ( for the BIC = 11, ).
To illustrate how the different aspects of non-competitive inhibition affect atorvastatin and CsA, parameter estimates from Model 2 associated with the transporter (ka, kd, kt, To and α, see and Supplementary Material) were used to simulate the transporter response following pre-incubation with CsA () using the deSolve package in R (Soetaert et al., Citation2010). In the absence of CsA (, dotted blue lines), as the incubation concentration of atorvastatin was increased, so the kdA had a larger effect, seen as a broadening of the peak. After pre-incubation with CsA, the higher affinity atorvastatin competes with CsA, leading to a decrease in atorvastatin bound (blue solid line), and also a perturbation in the amount of CsA bound (red dotted-dashed line). This recovers to near the initial amount of CsA at lower atorvastatin incubation concentrations, as atorvastatin is transported into the cell. The formation of the atorvastatin-transporter-CsA complex initially starts at zero and increases over time, as the incubation of atorvastatin increases, so the complex increases (, red dashed line).
Discussion
To compare the passive rate constants to the values found in the literature for atorvastatin, the passive rate constants (kfA and kbA) were scaled from Model 2 to clearances (Pdif and Pdef) respectively by multiplying by the relevant volume. Pdif was 11-fold greater than Pdef (0.55 [0.1–11.7] and 0.051 [0.03–0.2] µl/min/1 × 106 cells respectively), possibly due to intracellular binding of atorvastatin (Kulkarni et al., Citation2016; Paine et al., Citation2008; Yabe et al., Citation2011). Pdif for atorvastatin was minor (<1%) compared to the transporter mediated uptake clearance (CLup = 3375 [2722–10750] µl/min/1 × 106 cells, EquationEquation (11)(11)
(11) ), therefore even though the range of values on kfA and thus Pdif estimation were large it is of little consequence in the uptake of atorvastatin. The percentage of passive clearance to the overall uptake clearance is similar to the literature contribution of passive movement to the uptake of atorvastatin in rat hepatocyte suspensions of 1.5 % (Yabe et al., Citation2011), but less than the estimated value in plated rat hepatocytes of a 10 % passive contribution (Liao et al., Citation2018).
The scaled Vmax.up value obtained from Model 2 (850 [680–1340] pmol/min/1 × 106 cells, EquationEquation (6)(6)
(6) ) was similar to that obtained from the initial estimate from a Yamazaki plot (1253 pmol/min/1 × 106 cells, see Supplementary Material), and compared favourably to that obtained from rat hepatocytes (1340 ± 320 pmol/min/1 × 106 cells, Yabe et al., Citation2011). The scaled Km.up (0.2 [0.04–0.41] nmol/ml, EquationEquation (7)
(7)
(7) ) was similar to that seen in plated hepatocytes (0.3 nmol/ml, although the Vmax.up was low at 58 pmol/min/mg, Liao et al., Citation2018), but less than rat hepatocyte suspensions (4 ± 4 nmol/ml, Yabe et al., Citation2011). Cellular volume estimates have a large effect on both the cellular concentration calculation prior to parameter estimation, and within the models themselves with normalised data. Yabe et al. (Citation2011) used the value of 0.0039 ml/1 × 106 cells (Reinoso et al., Citation2001), which gave a higher BIC value for the data presented here, and is therefore a major contribution to the source of the differences.
The difference in ka and kd between atorvastatin and CsA explains the co-incubation inhibition conclusions in the literature with the KI.up = 0.9 (0.8–1) nmol/ml value determined here (EquationEquation (8)(8)
(8) ), that was similar to the IC50 value in HEK293-OATP1B1 cells of 0.48 ± 0.34 nmol/ml (Amundsen et al., Citation2010), and 0.3 nmol/ml for cis-inhibition with estradiol-17β-glucuronide (Shitara & Sugiyama, Citation2017). The inhibition on pre-incubation therefore derives from the α value of 0.013 (0.007–0.023), which, using EquationEquation (10)
(10)
(10) , gives a Kinact.up value of 0.012 (0.0057–0.023) nmol/ml, and was the same as that for pre-incubation with atorvastatin in HEKOATP1B1 cells (0.021 ± 0.004 nmol/ml, Amundsen et al., Citation2010), as well as the trans-inhibition value of 0.026 nmol/ml calculated using estradiol-17β-glucuronide as a substrate (Shitara & Sugiyama, Citation2017).
The Vmax.met and Km.met values obtained from Model 2 (393 [285–500] pmol/min/1 × 106 cells and 18 [8–31] nmol/ml) combined to give a metabolic clearance (CLmet=22 [16–35] µl/min/1 × 106 cells, EquationEquation (11)(11)
(11) ) that was higher than the value in the literature (4.3 ± 0.65 µl/min/1 × 106 cells Sprague-Dawley rat hepatocytes, Paine et al., Citation2008), and 7.6 ± 0.4 µl/min/1 × 106 cells (adjusted from rat liver microsomes, Watanabe et al., Citation2010). Km.met and KI.met were similar (18 [8–31] and 11 [6–29] nmol/ml respectively, ), on the assumption that for CsA, the concentration inside the cell is approximately equal to the concentration outside the cell. This was supported by the literature, where it was reported that 86% of the initial concentration of CsA was measured in the cell after 5 min, whilst only 16% of the initial CsA was lost over 4 h (Prueksaritanont et al., Citation1992).
In conclusion, the data presented here show that the high throughput oil spin method developed enabled multiple concentrations to be taken simultaneously for timepoints over a 68 min experiment (192 samples). The data obtained are adequate for the assessment of atorvastatin uptake in rat hepatocytes and its inhibition by CsA given the models fits and parameter estimates. Through the use of mechanistic modelling and comparison of the % RMSRE and wBIC, a micro-rate constant model for the non-competitive inhibition of atorvastatin uptake by CsA and competitive inhibition of metabolism in rat hepatocytes was supported as the best fitting model to the data (Model 2). The improvement in model fit with micro-rate constant models over the frequently used macro-rate constant models is concurrent with those of Grandjean et al. (Citation2014a) with pitavastatin in hepatocytes; with improved goodness of fit values with micro-rate constant mechanistic models over macro-rate constant mechanistic models, and helps to further the knowledge between substrate and inhibitor binding at a transporter level and within the cell. The ability to return the parameter estimates from a mechanistic model, linked to the structural identifiability analysis results, highlights how the two are closely related and should become routine moving forwards. The quantification of CsA simultaneously with atorvastatin, as well as quantification of metabolites with reference standards, should be considered in future work to potentially improve the robustness of parameter estimation. Inclusion of CsA quantification would also lead to the macro-rate constant model becoming at least structurally (locally) identifiable. It should also be noted that the assay is currently limited to rat hepatocytes, but the technique should be applicable to cryopreserved human hepatocytes with modifications to the oil layer and bottom layer, and adaptation of the slosh plates used. The availability of fresh rat hepatocytes, the use of the high throughput method, and low cost in comparison to cryopreserved human hepatocytes makes transporter mediated drug–drug interaction potential in rat hepatocytes a good starting point which gave similar pre-incubation non-competitive inhibition estimates in human cell-lines with different substrates (Amundsen et al. Citation2010; Shitara & Sugiyama, Citation2017). Optimisation of the assay for cryopreserved human would therefore improve the modelling and prediction of transporter mediated drug–drug interactions in the clinic.
TXEN-2019-0163-File009.docx
Download MS Word (425.3 KB)Acknowledgements
The authors would like to extend their gratitude to; Dr Mark Baker for numerous discussions on modelling, Mr Apoorva Kotian and Dr Mark Jairaj for helping with the HPLC-MS problem solving, Mrs Sara Wright for support of the studies at UCB, Drs Anna-Lena Ungell and Emre Isin for reading the manuscript, and Drs Neil Evans and David Janzen for assistance with the structural identifiability analysis.
Disclosure statement
The authors confirm that there are no conflicts of interest with regard to this article or the data used herein.
Additional information
Funding
Related Research Data
References
- Aho K, Derryberry D, Peterson T. (2014). Model selection for ecologists: the worldviews of AIC and BIC. Ecology 95:631–6.
- Amundsen R, Asberg A, Ohm IK, Christensen H. (2012). Cyclosporine A- and tacrolimus-mediated inhibition of CYP3A4 and CYP3A5 in vitro. Drug Metab Dispos 40:655–61.
- Amundsen R, Christensen H, Zabihyan B, Asberg A. (2010). Cyclosporine A, but not tacrolimus, shows relevant inhibition of organic anion-transporting protein 1B1-mediated transport of atorvastatin. Drug Metab Dispos 38:1499–504.
- Anguelova M, Karlsson J, Jirstrand M. (2012). Minimal output sets for identifiability. Math Biosci 239:139–53.
- Baker M, Parton T. (2007). Kinetic determinants of hepatic clearance: plasma protein binding and hepatic uptake. Xenobiotica 37:1110–34.
- Bearup DJ, Evans ND, Chappell MJ. (2013). The input-output relationship approach to structural identifiability analysis. Comput Methods Programs Biomed 109:171–81.
- Burnham KPA, Anderson DR. 2002. Information and likelihood theory. Model selection and multimodel inference: a practical information-theoretic approach. 2nd ed. New York: Springer, 60–80.
- Chang W. 2014. Extrafont: Tools for using fonts. R package version 0.17. Available from: https://CRAN.R-project.org/package=extrafont.
- Copeland RA. 2013. Reversible modes of inhibitor interactions with enzymes. Evaluation of enzyme inhibitors in drug discovery: a guide for medicinal chemists and pharmacologists. 2nd ed. New Jersey: John Wiley and Sons, 57–119.
- Evans ND, Chapman MJ, Chappell MJ, Godfrey KR. (2002). Identifiability of uncontrolled nonlinear rational systems. Automatica 38:1799–805.
- Fricker G, Fahr A. (1997). Mechanisms of hepatic transport of cyclosporin A: an explanation for its cholestatic action? Yale J Biol Med 70:379–90.
- Fuentes AV, Pineda MD, Venkata KCN. (2018). Comprehension of top 200 prescribed drugs in the US as a resource for pharmacy teaching, training and practice. Pharmacy (Basel, Switzerland) 6:43.
- Grandjean TR, Chappell MJ, Lench AM, et al. (2014a). Experimental and mathematical analysis of in vitro Pitavastatin hepatic uptake across species. Xenobiotica 44:961–74.
- Grandjean TR, Chappell MJ, Yates JW, Evans ND. (2014b). Structural identifiability analyses of candidate models for in vitro Pitavastatin hepatic uptake. Comput Methods Programs Biomed 114:e60–9.
- Hagenbuch B, Gui C. (2008). Xenobiotic transporters of the human organic anion transporting polypeptides (OATP) family. Xenobiotica 38:778–801.
- Harrison J, De Bruyn T, Darwich AS, Houston JB. (2018). Simultaneous assessment in vitro of transporter and metabolic processes in hepatic drug clearance: use of a media loss approach. Drug Metab Dispos 46:405–14.
- Imamura R, Ichimaru N, Moriyama T, et al. (2005). Long term efficacy of simvastatin in renal transplant recipients treated with cyclosporine or tacrolimus. Clin Transplant 19:616–21.
- Ishigami M, Tokui T, Komai T, et al. (1995). Evaluation of the uptake of pravastatin by perfused rat liver and primary cultured rat hepatocytes. Pharm Res 12:1741–5.
- Jones HM, Barton HA, Lai Y, et al. (2012). Mechanistic pharmacokinetic modeling for the prediction of transporter-mediated disposition in humans from sandwich culture human hepatocyte data. Drug Metab Dispos 40:1007–17.
- Karlsson J, Anguelova M, Jirstrand M. (2012). An efficient method for structural identifiability analysis of large dynamic systems. 16th IFAC Symposium on System Identification. Belgium: Elsevier, 941–6.
- Kimoto E, Li R, Scialis RJ, et al. (2015). Hepatic disposition of gemfibrozil and its major metabolite gemfibrozil 1-o-beta-glucuronide. Mol Pharm 12:3943–52.
- Kolhatkar V, Polli JE. (2010). Reliability of inhibition models to correctly identify type of inhibition. Pharm Res 27: 2433–45.
- Kulkarni P, Korzekwa K, Nagar S. (2016). Intracellular unbound atorvastatin concentrations in the presence of metabolism and transport. J Pharmacol Exp Ther 359:26–36.
- Lau YY, Okochi H, Huang Y, Benet LZ. (2006). Multiple transporters affect the disposition of atorvastatin and its two active hydroxy metabolites: application of in vitro and ex situ systems. J Pharmacol Exp Ther 316:762–71.
- Lemahieu WP, Hermann M, Asberg A, et al. (2005). Combined therapy with atorvastatin and calcineurin inhibitors: no interactions with tacrolimus. Am J Transplant 5:2236–43.
- Li L, Nouraldeen A, Wilson AG. (2013). Evaluation of transporter-mediated hepatic uptake in a non-radioactive high-throughput assay: a study of kinetics, species difference and plasma protein effect. Xenobiotica 43:253–62.
- Liao M, Zhu Q, Zhu A, et al. (2018). Comparison of uptake transporter functions in hepatocytes in different species to determine the optimal model for evaluating drug transporter activities in humans. Xenobiotica 49:852–62.
- Lu C, Li P, Gallegos R, et al. (2006). Comparison of intrinsic clearance in liver microsomes and hepatocytes from rats and humans: evaluation of free fraction and uptake in hepatocytes. Drug Metab Dispos 34:1600–5.
- Menochet K, Kenworthy KE, Houston JB, Galetin A. (2012a). Simultaneous assessment of uptake and metabolism in rat hepatocytes: a comprehensive mechanistic model. J Pharmacol Exp Ther 341:2–15.
- Menochet K, Kenworthy KE, Houston JB, Galetin A. (2012b). Use of mechanistic modeling to assess interindividual variability and interspecies differences in active uptake in human and rat hepatocytes. Drug Metab Dispos 40:1744–56.
- Paine SW, Parker AJ, Gardiner P, et al. (2008). Prediction of the pharmacokinetics of atorvastatin, cerivastatin, and indomethacin using kinetic models applied to isolated rat hepatocytes. Drug Metab Dispos 36:1365–74.
- Patilea-Vrana G, Unadkat JD. (2016). Transport vs. metabolism: what determines the pharmacokinetics and pharmacodynamics of drugs? Insights from the extended clearance model. Clin Pharmacol Ther 100:413–8.
- Prueksaritanont T, Koike M, Hoener BA, Benet LZ. (1992). Transport and metabolism of cyclosporine in isolated rat hepatocytes. The effects of lipids. Biochem Pharmacol 43:1997–2006.
- Reinoso RF, Telfer BA, Brennan BS, Rowland M. (2001). Uptake of teicoplanin by isolated rat hepatocytes: comparison with in vivo hepatic distribution. Drug Metab Dispos 29:453–9.
- Schwarz LR, Burr R, Schwenk M, et al. (1975). Uptake of taurocholic acid into isolated rat-liver cells. Eur J Biochem 55:617–23.
- Segel IH. 1993a. Kinetics of unireactant enzymes. Enzyme kinetics: behaviour and analysis of rapid equilibrium and steady-state enzyme systems. New Jersey: John Wiley and Sons Inc., 19–42.
- Segel IH. 1993b. Rapid equilibrium partial and mixed-type inhibition. Enzyme kinetics: behaviour and analysis of rapid equilibrium and steady-state enzyme systems. New Jersey: John Wiley and Sons Inc., 161.
- Seglen PO. (1976). Preparation of isolated rat liver cells. Methods Cell Biol 13:29–83.
- Shitara Y, Sugiyama Y. (2017). Preincubation-dependent and long-lasting inhibition of organic anion transporting polypeptide (OATP) and its impact on drug-drug interactions. Pharmacol Ther 177:67–80.
- Shitara Y. (2011). Clinical importance of OATP1B1 and OATP1B3 in drug-drug interactions. Drug Metab Pharmacokinet 26:220–7.
- Shitara Y, Horie T, Sugiyama Y. (2006). Transporters as a determinant of drug clearance and tissue distribution. Eur J Pharm Sci 27:425–46.
- Skalicka B, Kubanek M, Malek I, et al. (2009). Conversion to tacrolimus and atorvastatin in cyclosporine-treated heart transplant recipients with dyslipidemia refractory to fluvastatin. J Heart Lung Transplant 28:598–604.
- Soars MG, Grime K, Sproston JL, et al. (2007). Use of hepatocytes to assess the contribution of hepatic uptake to clearance in vivo. Drug Metab Dispos 35:859–65.
- Soetaert K, Petzoldt T, Woodrow-Setzer R. (2010). Solving differential equations in R. R J 2:5–15.
- Umehara K, Camenisch G. (2012). Novel in vitro-in vivo extrapolation (IVIVE) method to predict hepatic organ clearance in rat. Pharm Res 29:603–17.
- Watanabe T, Kusuhara H, Maeda K, et al. (2010). Investigation of the rate-determining process in the hepatic elimination of HMG-CoA reductase inhibitors in rats and humans. Drug Metab Dispos 38:215–22.
- Wilke CO. 2016. Cowplot: Streamlined plot theme and plot annotations for 'ggplot2'. R package version 0.93. Available from: https://CRAN.R-project.org/package=cowplot
- Yabe Y, Galetin A, Houston JB. (2011). Kinetic characterization of rat hepatic uptake of 16 actively transported drugs. Drug Metab Dispos 39:1808–14.
- Yamazaki M, Suzuki H, Hanano M, et al. (1993). Na(+)-independent multispecific anion transporter mediates active transport of pravastatin into rat liver. Am J Physiol 264:G36–44.
- Yoshikado T, Toshimoto K, Nakada T, et al. (2017). Comparison of methods for estimating unbound intracellular-to-medium concentration ratios in rat and human hepatocytes using statins. Drug Metab Dispos 45:779–89.
- Ziegler K, Frimmer M. (1986). Identification of cyclosporin binding sites in rat liver plasma membranes, isolated hepatocytes, and hepatoma cells by photoaffinity labeling using [3H]cyclosporin-diaziridine. Biochim Biophys Acta 855:147–56.