
Abstract
Catechol-O-methyltransferase (COMT) methylates both endogenous and exogenous catechol compounds to inactive and safe metabolites.
We first optimised conditions for a convenient and sensitive continuous fluorescence-based 6-O-methylation assay of esculetin, which we used for investigating the COMT activity in human, mouse, rat, dog, rabbit, and sheep liver cytosols and microsomes and in ten different rat tissues. Furthermore, we compared the inhibition potencies and mechanisms of two clinically used COMT inhibitors, entacapone and tolcapone, in these species.
In most tissues, the COMT activity was at least three times higher in cytosol than in microsomes. In the rat, the highest COMT activity was found in the liver, followed by kidney, ileum, thymus, spleen, lung, pancreas, heart, brain, and finally, skeletal muscle. Entacapone and tolcapone were characterised as highly potent mixed type tight-binding inhibitors. The competitive inhibition type dominated over the uncompetitive inhibition with entacapone, whereas uncompetitive inhibition dominated with tolcapone.
Rats, dogs, pigs, and sheep are high COMT activity species, in contrast to humans, mice, and rabbits; COMT activity is highest in the liver. Both entacapone and tolcapone are potent COMT inhibitors, but their inhibition mechanisms differ.
Introduction
Catechol is an important chemical structural motif with multiple cellular functions. The catechol core structure consists of a benzene ring with two adjacent hydroxyl substituents. Humans are exposed to various types of endogenous and exogenous catechol compounds (Riishede and Nielsen-Kudsk Citation1990; Lekse et al. Citation2001; Cavalieri et al. Citation2006). Endogenous catechol compounds include 3,4-dihydroxytyrosine, catecholamines, their metabolites, catechol estrogens, and dihydroxyindole. Three catecholamines, i.e. dopamine, noradrenaline, and adrenaline, are synthesised from L-dopa, which is the product of the tyrosine hydroxylase oxidation of the amino acid, tyrosine. The catechol estrogens are CYP enzyme oxidisation products of estrogens such as estradiol, estrone, and estriol. Humans are also exposed to exogenous catechol compounds e.g. from therapeutic drugs containing the catechol moiety or from plant sources; in the latter, they protect the plant against UV-light, oxidants, herbivores, and microbes. Drugs containing the catechol core structure include isoprenaline, dobutamine, levodopa, droxidopa, benserazide, entacapone, tolcapone, and nitecapone. Phenolic drugs or other xenobiotics may be oxidised by CYPs to catechol compounds, as exemplified by traxoprodil (Johnson et al. Citation2003) and duloxetine (Lantz et al. Citation2003). Furthermore, plant constituents containing the catechol core structure include verbascoside (Reid et al. Citation2019) and polyphenols such as tannins (Bianco and Savolainen Citation1994), catechins (Rhodes et al. Citation2013), and flavonoids (Sak Citation2017).
The catechol compounds have both beneficial and adverse health effects in humans (Cavalieri et al. Citation2006; Yang et al. Citation2014; Sanders-Bush and Hazelwood Citation2015). Catecholamines are important neurotransmitters and regulators in the central and peripheral nervous system (Sanders-Bush and Hazelwood Citation2015). They are also key intermediate compounds when the melanin pigment is synthesised to protect skin against UV-light (Slominski et al. Citation2004) or in substantia nigra (Zucca et al. Citation2014). Other catechol compounds, such as flavonoids, are well-recognised antioxidants (Alfa and Arroo Citation2019). On the other hand, the catechol structure can be oxidised by CYP or peroxidase enzymes to an electrophilic quinone or semiquinone (Cavalieri et al. Citation2004, Citation2006). These metabolites can react with macromolecules such as proteins or nucleic acids causing toxicity. Under suitable conditions, catechol, semiquinone, and quinone can form a self-serving catalytic cycle leading to an excessive production of reactive oxygen species evoking oxidative stress. For this reason, catechol compounds are potentially toxic and may cause adverse health effects such as cell death, mutations, and cancer. The methylation of the catechol structure to a hydroxyl-methoxy benzene derivative prevents the formation of the quinone or semiquinone and thus reduces the reactivity of catechol compounds (Zhu Citation2004; Yager Citation2012).
The methylation of catechol compounds is catalysed by catechol-O-methyltransferase (COMT; E.C. 2.1.1.6.). COMT inactivates physiologically active catechol compounds such as catecholamines, suppressing the chemical reactivity of catechol compounds, and maintaining the catechol compounds at a safe level (Männistö et al. Citation1992). There are two forms of COMT in humans – the short cytosolic form (221 amino acids; S-COMT) and the long membrane-bound COMT form (271 amino acids; MB-COMT); both are expressed from the same gene, located on chromosome 22 (q11.2) (Tenhunen et al. Citation1993, Citation1994). Similarly, S-COMT and MB-COMT are expressed in other animal species. S-COMT is the dominant form in most tissues, although in the brain, MB-COMT is more abundant. In the COMT catalysed reaction, a methyl group is transferred from S-adenosyl-methionine (SAM) to one of the hydroxyl groups in the catechol structure. An Mg2+ ion is also present in the active site of COMT, and is involved in the methyl transferring reaction.
Most often the COMT activity is measured by incubating samples buffered at pH 7.4 using a catechol such as dihydroyxybenzylamine (Ellingson et al. Citation1999) or dihydroxybenzoic acid (Reenilä et al. Citation1995) as a substrate in the presence of SAM. After a pre-determined incubation time, the substrate and products are usually separated with high-performance liquid chromatography (HPLC), and the methylated products are detected with an ultraviolet (UV) or some other detector. A radiolabel-based COMT activity assay is also available, where labelled S-adenosyl-l-[methyl-14C]methionine is used as the co-factor and the formed radioactive methoxy catechol compounds are separated by HPLC (Lautala et al. Citation1999). However, this assay has not been as widely used as the UV detection-based methods.
Although the present COMT activity assays are accurate and sensitive, they all require several analysis steps, which take time, making them laborious, and can introduce variability between replicates. Furthermore, they require expensive analytical equipment. In fact, a more convenient fixed time assay with esculetin as a substrate for COMT has been published (Veser Citation1987; Kurkela et al. Citation2004), but this assay has rarely been used. In the present study, this method was applied as a continuous assay to measure the COMT mediated 6-O-methylation catalysis of esculetin to its strongly fluorescent metabolite, scopoletin. In the assay, the increase of fluorescence is monitored and the difference between the increase of the full reaction and a negative control indicates the rate of the COMT catalysed reaction. The key advantages of this straightforward assay are that it is highly sensitive, and it can be performed in a high throughput mode with a simple multi-well plate reader without the need for the expensive and time-consuming HPLC separation phase. This continuous esculetin 6-O-methylation assay was used 1) to determine the COMT activity in the cytosol and microsome of human, mouse, rat, rabbit, pig, dog, and sheep liver fractions; 2) to compare the COMT activities in the cytosol and microsome fractions of rat intestine, liver, kidney, spleen, pancreas, thymus, lung, heart, muscle and brain, and 3) to study the inhibition mechanisms of entacapone and tolcapone, which are important COMT inhibitors used in the therapy of Parkinson’s disease.
Materials and methods
Reagents
Esculetin, scopoletin, tolcapone, and S-adenosyl-l-methionine (SAM) were purchased from Sigma-Aldrich, dipotassium hydrogen phosphate (K2HPO4, 3 H2O) and potassium dihydrogen phosphate (KH2PO4) from Merck. Entacapone was obtained from Orion Pharma, MgCl2 from J.T. Baker, and dimethylsulfoxide (DMSO) from Fischer Chemicals.
Biological samples
The male human liver tissue was obtained from the Oulu University Hospital (Oulu, Finland) as surplus from organ transplantation surgery. The collection of the surplus tissue was approved by the Ethics Committee of the Medical Faculty of the University of Oulu (21 January 1986). After surgical excision, the liver samples were immediately transferred to ice, cut into pieces, snap-frozen in liquid nitrogen, and stored at −80 °C until the cytosol was prepared. Eight-month-old female pigs had been used for practicing surgical procedures at Kuopio University. DBA/2N/Kuo mice (20–25 g) and male Wistar rats (200–300 g) were obtained from the National Laboratory Animal Centre, Kuopio University. The mice and rats had unrestricted access to water and standard chow Lactamin R36 (Lactamin). The Ethics Committee for Animal Experiments, University of Kuopio, approved these experiments (01-38, 1 June 2000). The necropsy of male and female Beagle dogs was performed in F. Hoffmann-La Roche Ltd (Nutley, NJ) according to institutional guidelines in compliance with national and regional legislation (Heikkinen et al. Citation2015). Female Dutch belted rabbits were 4–11 months old and weighed 2.7–3.8 kg (license number: ESAVI/8621/04.10.07/2017). The rabbits were killed by injecting a lethal dose of 120 mg/kg pentobarbital (Mebunat vet, Orion Pharma, Finland) into the marginal ear-vein. Adult female sheep liver samples were obtained from Oulu University (Oulu, Finland) (animal license number ESAVI/3510/04.10.03/2011). Rat tissue samples were collected from male Wistar rats (age 8–12 weeks) (Envigo, Netherlands) (animal license number ESAVI-2017-011442). Rats were group-housed and had free access to standard food (2016S Teklad, Envigo) and tap water. A short, 3-min transcardial perfusion with ice-cold saline was performed under pentobarbital (100 mg/kg i.p., Mebunat Vet) anaesthesia to remove excess blood from the tissues. Representative samples of the liver, kidney, epithelium of ileum, quadriceps muscle, heart, spleen, pancreas, thymus, lung, and brain were carefully dissected. Furthermore, samples from the hypothalamus, medial prefrontal cortex, striatum, hippocampus, and cerebellum were dissected from three rat brains, and all samples were transferred into small plastic tubes, snap-frozen in liquid nitrogen, and stored at −80 °C until cytosol and microsome samples were prepared. All animal experiments complied with the ARRIVE guidelines, were performed in accordance with European Union guidelines (Directive 2010/63/EU and the guideline 2007/526/EC) and approved by the Finnish national animal experiment board or a university ethics committee. In all animal experiments, all effort was taken to minimise animal suffering and the number of animals used.
The liver samples were immediately transferred to ice, cut into pieces, and stored at −80 °C until the microsome and cytosol samples were prepared. A detailed description of the sample preparation has been published previously (Heikkinen et al. Citation2015). Shortly, the tissue samples were homogenised with Potter-Elvehjem homogenizer in 100 mM Tris–HCl buffer, pH 7.4, containing 1 mM K2-EDTA (4 parts buffer +1 part tissue). The homogenate was centrifuged at 10 000 g for 15 min at 4 °C. The supernatant (S9 fraction) was collected (COMT activities of brain section samples) or centrifuged at 100 000 g for 60 min at 4 °C. The supernatant (cytosolic fraction) and pellet (microsomal fraction) were separated. The microsomal fraction was re-homogenised with Potter-Elvehjem homogenizer in 100 mM Tris–HCl buffer, pH 7.4, containing 0.1 mM K2-EDTA and 20% glycerol. The protein concentration was determined with the Bicinchoninic acid Assay (Pierce Biotechnology, IL, USA). The samples were stored at −80 °C until assay.
Fluorescence intensities of esculetin, scopoletin, and isoscopoletin
Esculetin, scopoletin, and isoscopoletin were dissolved at 1 µM concentration in 1% trichloroacetic acid, 100 mM acetic acid pH 3.5, 100 mM phosphate buffer pH 5–9 or 1.6 M glycine-NaOH pH 10.4, and fluorescence intensity was measured using 405 nm excitation and 460 nm emission. The fluorescence of 1 µM scopoletin in 100 mM phosphate pH 7.4 or 100 mM Tris-HCl pH 7.4 was measured between 0 and 38 min every second minute at the above wavelengths to examine the effect of time on the fluorescence intensity.
COMT assays
Esculetin 6-O-methylation activity was determined in 100 µL (40 min assay) or 200 µL (450 min assay) 100 mM phosphate buffer pH 7.4 containing 10 µM or at the indicated concentration of esculetin, 5 mM MgCl2, 100 µM or the indicated concentration of SAM, and 0.001–1 g/L of cytosol or microsomal protein sample. Blank samples did not contain esculetin, SAM, or enzyme preparation. Esculetin was dissolved in 100% DMSO, whose concentration in the incubation mixture was kept to a maximum of 1%. Samples were preincubated for 5 min at 37 °C before starting the reaction with the addition of SAM and the incubation continued at 37 °C for 40 min or 450 min (low activity samples). During the incubation, fluorescence was monitored every 2 min or 50 min using excitation 405 nm and emission 460 nm filters with a Victor multi-well plate reader (Perkin Elmer, Waltham, MA, USA). Standards contained constant sum concentration of esculetin and scopoletin e.g. 10 µM, of esculetin (10–0 µM) and scopoletin (0–10 µM). Fluorescence values were transformed to molarity using individual standard lines at every time point. Slopes of the increase in scopoletin concentration per minute were calculated using linear regression analysis, in which the slope of the linear part of the kinetic assay indicated the esculetin 6-O-methylation rate (mM/min). The rate was calculated by subtracting the blank value from the full reaction value followed by normalising the esculetin 6-O-methylation rate with the protein content in the sample. In the inhibition experiments, the same incubation conditions were used as described above, but the concentrations of entacapone, tolcapone, esculetin, or cytosol varied as indicated in the experiments.
Equations
The esculetin 6-O-methylation rate (v) was calculated using the equation v = p/(time × protein), where p is the amount of product, time is the time for product formation, and protein is the mass of protein in the sample. The IC50 value (inhibitor concentration decreasing 50% of the activity) was calculated using the equation vi/v0 = 1/(1 + IC50/I), where vi is the rate in the presence of an inhibitor, v0 the rate without an inhibitor, and I is the inhibitor concentration. The competitive inhibitor constant Kic and uncompetitive inhibitor Kiu constants were calculated using the equation IC50 = (S + Km)/(Km/Kic + S/Kiu) + E/2, where S is the substrate concentration, Km is the Michaelis constant being 0.36 µM for esculetin, and enzyme concentration E varied as indicated in the simulation ().
LC-MS analysis of scopoletin and isoscopoletin from esculetin incubation
Ten µM of esculetin was incubated in 100 µL of 100 mM phosphate pH 7.4 buffer containing 5 mM MgCl2, 0.05–0.2 g protein/L cytosol or microsomes originating from human, mouse, rat, rabbit, dog, pig or sheep sources, and 100 mM of SAM for 30 min at 37 °C. The reaction was stopped by adding 300 µL of acetonitrile, and the samples were centrifuged at 10 000 × g for 10 min. Finally, 250 µL of the supernatant was transferred into Eppendorf tubes, which were stored at −80 °C until LC-MS analysis. The fluorescence of the supernatants was measured also from the same samples using excitation 405 nm and emission 460 nm wavelengths to examine the correlation between the fluorescence intensity and peak size of LC-MS. The sample analysis was carried out using an UHPLC-q-TOF-MS system (Agilent Technologies, Waldbronn, Karlsruhe, Germany), which consisted of a 1290 LC system, a Jetstream ESI source, and a 6540 UHD accurate mass quadrupole-time-of-flight (qTOF) mass spectrometry. In the analysis, 2 µL of sample solution was injected into a Zorbax Eclipse XDB-C18 column (2.1 × 100 mm, 1.8 μm; Agilent Technologies). The autosampler tray and column compartments were kept at +4 °C during the analysis. Mobile phase flow rate was 0.4 ml/min and it consisted of water (eluent A; Milli-Q Gradient (Millipore) and methanol (eluent B; methanol Riedel-de-Häen), both containing 0.1% v/v of formic acid (Sigma-Aldrich), delivered with the following gradient conditions: 0–10 min: 2 → 100% B, 10–15 min: 100% B, 15–15.1 min: 100 → 2% B; 15.1–18 min: 2% B. A Jetstream ESI source, operating in the positive ionisation mode, used the following conditions: drying gas (nitrogen) temperature 325 °C and flow of 10 L/min, sheath gas temperature 350 °C and flow of 11 L/min, nebuliser pressure 45 psi, capillary voltage 3500 V, nozzle voltage 1000 V, fragmentor voltage 100 V, and skimmer voltage 45 V. Data acquisition was performed using a 2 GHz extended dynamic range mode across a mass range of m/z 50–1600. The scan rate was 2.5 Hz. Data acquisition was in the centroid mode with an abundance threshold of 150 counts. Continuous mass axis calibration was performed by monitoring two reference ions from an infusion solution throughout the runs (m/z 121.050873 and m/z 922.009798). Data were acquired using MassHunter Acquisition B.04.00 software (Agilent Technologies).
Results
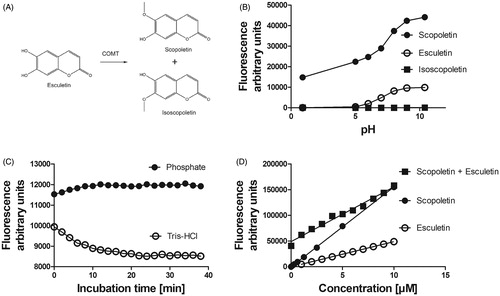
In this study, the previously published fixed time (endpoint) fluorescence assay of COMT activity (Veser Citation1987; Kurkela et al. Citation2004) was modified to a continuous-time measurement (kinetic) assay. Esculetin is weakly fluorescent and COMT methylates it to either the non-fluorescent isoscopoletin (6-hydroxy-7-methoxycoumarin) or to the strongly fluorescent scopoletin (6-methoxy-7-hydroxycoumarin) () at the following wavelengths – excitation 405 nm and emission 460 nm. The fluorescence of scopoletin was pH-dependent being higher at alkaline conditions (). The buffer composition affected the fluorescence of 10 µM scopoletin in the continuous measurement set-up; in 100 mM phosphate buffer pH 7.4, it increased by 5%, whereas in 100 mM Tris-HCl buffer pH 7.4 the fluorescence decreased by 15% during the incubation (). Thus, 100 mM phosphate buffer pH 7.4 was selected for use in further experiments. The fluorescence of scopoletin, esculetin, or the sum of esculetin (10 → 0 µM) and scopoletin (0 → 10 µM) increased linearly when the concentration of scopoletin was increased (). The sum of esculetin and scopoletin was used to create the standard line when the reaction fluorescences were transformed into scopoletin concentrations.
Figure 1. Substrate and product fluorescence in COMT mediated O-methylation catalysis of esculetin to scopoletin or isoscopoletin. The weakly fluorescent esculetin is 6-O-methylated to the highly fluorescent scopoletin and 7-O-methylated to the non-fluorescent isoscopoletin (panel A). Panel B shows the effect of pH on the fluorescence of esculetin, scopoletin, and isoscopoletin at excitation 405 nm and emission 460 nm wavelengths. The fluorescence of 1 µM scopoletin is dependent on the type of the 100 mM buffer at pH 7.4 and incubation time (panel C). The fluorescence values of scopoletin, esculetin, or sum of scopoletin (0 →10 µM) and esculetin (10 → 0 µM) are linearly dependent on the concentration (panel D).
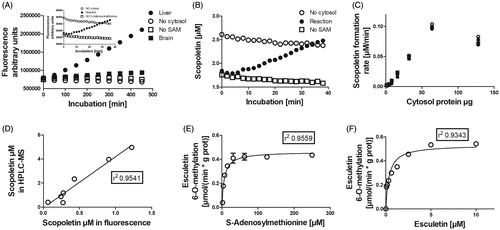
Fluorescence increased in the presence of liver or brain cytosol, 10 µM of esculetin, 5 mM of MgCl2, and 100 µM of SAM both in 100 mM phosphate or Tris-HCl buffers at pH 7.4 (). Instead, no increase was detected if either the cytosol, esculetin, or SAM was omitted from the reaction mixture (). The sample fluorescence was transformed into the scopoletin concentration at every time point with standards of sum concentration of esculetin and scopoletin, corresponding to the initial concentration of the substrate, esculetin (). The scopoletin concentration increased time and amount of cytosol (COMT) dependently (). However, a higher than 0.5% blood or 5% tissue concentration in the sample disturbed the measurement of the reaction and reduced the fluorescence. The increase in scopoletin levels determined with the fluorescence assay correlated well with the scopoletin levels as assessed by the LC-MS (). The Km value of SAM was 6 µM (4.2–8.9 µM 95% confidence limit) and the Km of esculetin was 0.36 µM (0.13–0.59 µM 95% confidence limit) in rat liver cytosol catalysed esculetin 6-O-methylation reaction (). In summary, the rate of 6-O-methylation conversion of esculetin to scopoletin (i.e. COMT activity) could be reliably determined in tissue samples by measuring fluorescence with our continuous assay set-up.
Figure 2. Factors affecting the esculetin 6-O-methylation reaction. Panel A shows the increase in fluorescence when 10 µM of esculetin is incubated in 100 mM phosphate buffer pH 7.4 containing rat liver cytosol (high activity sample) or brain (low activity sample), 5 mM of MgCl2, and 100 µM of SAM. Panel B displays the increase in the scopoletin concentration in the reaction sample, whereas no scopoletin is formed in the negative controls without SAM or cytosol, after the standardisation of fluorescence to the scopoletin concentration. Panel C shows the effect of the amount of cytosolic protein on the formation of scopoletin. Panel D shows the correlation between the scopoletin concentrations determined with the fluorescence assay and with the LC-MS analysis after incubation of esculetin with human, mouse, rat, dog, rabbit, pig, and sheep liver cytosols. Panels E and F provide details of enzyme kinetics of esculetin 6-O-methylation with respect to the cofactor, S-adenosylmethionine and the substrate, esculetin, in rat liver cytosol, respectively.
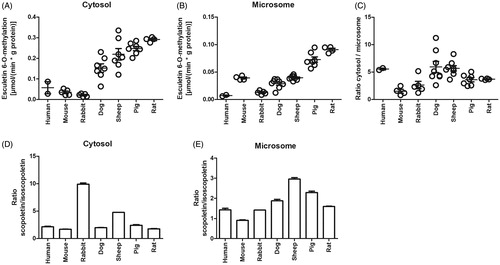
Esculetin 6-O-methylation activity was higher in liver cytosol than in microsomes of human, rat, dog, rabbit, pig, and sheep, but rather similar in mouse cytosol and microsome samples (). The activity varied between 0.02–0.3 µmol/(min × g protein) in the cytosol and 0.007–0.1 µmol/(min × g protein) in microsomes between species. The highest methylation activity was detected in rats, being 5–13 times higher than that of the lowest activity species i.e. human, rabbit, and mouse liver samples. The methylation rate was somewhat lower in pig, sheep, and dog liver samples than in the corresponding specimens from rats. The rate ratio between cytosol: microsome varied from 1 to 2 in mouse and rabbit, about 3 in pig and rat, to about 5 in the dog, sheep, and human. Both 6-O and 7-O-methylations of esculetin were studied in these species (). In rabbit cytosol, more than 10 times scopoletin (the 6-O-methylation of esculetin) was formed and in sheep cytosol 5 times more than isoscopoletin (the 7-O-methylation of esculetin). In microsomes of all species and cytosol of human, mouse, rat, dog, and pig, there was a 0.9- to 2.5-time difference in these methylation rates. As a summary, esculetin 6-O-methylation occurred faster than 7-O-methylation in all species, except in mice, and its rate of formation was fast in rat, sheep, and pig, intermediate in dog and low in human, mouse, and rabbit liver samples.
Figure 3. The esculetin 6-O-methylation rate in liver cytosols and microsomes of different animal species. The activities were determined with the continuous esculetin 6-O-methylation fluorescence assay with 10 µM of esculetin in 100 mM phosphate buffer pH 7.4 containing liver cytosol or microsomes from the different species, in the presence of 5 mM of MgCl2, and 100 µM of SAM (panels A–C). In panels D and E, the incubation was stopped after 30 min, and then the concentrations of scopoletin and isoscopoletin were determined by LC-MS analysis. Panels A–C show individual observations and the error bars represent mean ± SEM, panels D and E are mean ± SEM.
With respect to the species examined, rats had the highest rate of esculetin 6-O-methylation in the liver and therefore they were selected as a model species for the next step of the study, where the activities of cytosol and microsome samples from ten different tissues were determined (, ). The protein normalised COMT activity was highest in liver cytosol and microsomes (). The second highest activity was detected in the kidney being 25–29% of that assayed in the liver. In the ileum, the activity was 15% of the liver values. In the pancreas, microsomal activity was 73% of liver microsomal activity. In other tissues, the protein normalised activities were less than 10% of the liver activity. In S9 fractions of rat brain sections, the highest COMT activity was found in the hippocampus, where it was double that determined in the medial prefrontal cortex where the activity was lowest. Furthermore, the COMT activity was 1.5 times higher in the hypothalamus, striatum, and cerebellum than in the medial prefrontal cortex. Finally, the COMT methylation capacity of each tissue was estimated by multiplying the protein normalised activity by the total protein content of each tissue (). Expressed in this manner, the highest methylation capacity was present in the liver and kidney. The COMT methylation capacity of skeletal muscle was higher when compared to the rest of the tissues because the total mass of the skeletal muscle is high (40% of the total body weight (Davies and Morris Citation1993). To summarise, COMT activity was observed in all studied rat tissues with the highest total and protein normalised activity being located in the liver.
Figure 4. Esculetin 6-O-methylation rates in different rat tissues. The activity was determined with the continuous fluorescence monitoring for 450 min. The incubation mixture consisted of 10 µM of esculetin, 100 mM of phosphate buffer pH 7.4, liver cytosols (A), microsomes (B), or S9 fraction (C) of different tissues, 5 mM of MgCl2, and 100 µM of SAM (n = 8 in A and B). In panel C, there is a statistical difference in the methylation rates of esculetin between the hippocampus and cortex (n = 3; one-way ANOVA followed by Tukey’s multiple comparison test, p < 0.05). The error bars represent the 95% confidence levels.
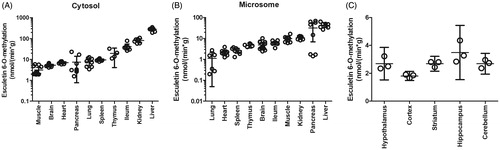
Table 1. Total COMT activities as measured by esculetin 6-O-methylation rates in ten different rat tissues (mean ± standard deviation, n = 8).
As entacapone and tolcapone are clinically important COMT inhibitors in the treatment of Parkinson’s disease (Männistö et al. Citation1992), their inhibition characteristics were studied in detail. Firstly, their IC50 values for esculetin 6-O-methylation were determined in human, mouse, rat, dog, rabbit, pig, and sheep liver cytosols (, ). The IC50 values of entacapone and tolcapone were in the 18–130 nM range meaning that they were active at about one-hundredth of the 10 µM concentration of the substrate esculetin. In the comparison between species, the IC50 value of entacapone varied threefold from 18 nM (95% confidence limit 17–19 nM) in rats to 53 nM (24–64 nM) in humans. The IC50 value of tolcapone varied fivefold from 25 nM (23–27 nM) in rats to 130 nM (80–190 nM) in humans. Moreover, the IC50 values of tolcapone were 1.3–2.5 times higher than those of entacapone. In the second inhibition experiment, entacapone and tolcapone were initially incubated with human and rat cytosol under optimal COMT methylation conditions, and then their IC50 values were determined against esculetin 6-O-methylation (, ). The preincubation decreased the IC50 values of both inhibitors in human but not in rat cytosol, suggesting that entacapone and tolcapone could be irreversible inhibitors of human but not of rat COMT. As a summary, entacapone was a more potent COMT inhibitor than tolcapone in all species based on the IC50 values determined at 10 µM esculetin concentration, but the COMT inhibition mechanism of these two drugs differed between humans and rats.
Figure 5. The inhibition of esculetin 6-O-methylation in liver cytosol of human and rat by entacapone and tolcapone. The inhibition of scopoletin formation was determined in 100 mM phosphate pH 7.4 buffer containing 10 mM of MgCl2, cytosolic protein, 100 µM of PAPS, 10 µM of esculetin, and the indicated concentration of entacapone or tolcapone. In panels A and B, the experiment was performed without preincubation, and in panels C–F entacapone or tolcapone were first incubated without esculetin for 20 min at 37 °C, and then 10 µM of esculetin was added and the esculetin 6-O-methylation rate was determined with the indicated inhibitor concentrations.
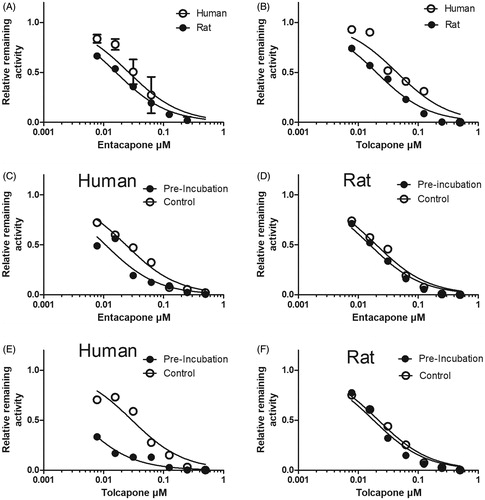
Table 2. The IC50 values (µM; 95% confidence level) of entacapone and tolcapone of hepatic cytosolic COMT in different species.
Table 3. The effect of preincubation of entacapone and tolcapone on their IC50-values (µM; 95% confidence limit) against liver cytosol esculetin 6-O-demethylation in human and rat.
To further clarify the inhibition mechanisms, we next investigated how the amount of rat cytosol and the concentration of esculetin would affect the IC50 values of entacapone and tolcapone (, ). The IC50 values of both inhibitors increased linearly when the amount of cytosol increased, indicating that they were tight-binding inhibitors. Interestingly, the esculetin concentration had a different effect on the IC50 values between the inhibitors; an increasing esculetin concentration non-linearly increased the IC50 value of entacapone but non-linearly decreased the IC50 value of tolcapone. According to the shape of the curve, these inhibitors would be mixed-type COMT inhibitors in rat cytosol, or tolcapone could also be an uncompetitive (catalytic) inhibitor. The convex curve shape of entacapone suggests that competitive inhibition predominates over the uncompetitive type, whereas the concave curve shape of tolcapone suggests that uncompetitive inhibition predominates over the competitive type. Next, the equation IC50 = (S + Km)/(Km/Kic + S/Kiu) + E/2 was used to calculate the inhibition constants for these mixed-type inhibitors (). The Kic value is for competitive and Kiu value for uncompetitive inhibition. We conducted a simulation with experimental data at six COMT concentrations between 0.07 and 7 nM, as we did not know its exact concentration in rat cytosol (). The Kic values of entacapone were smaller than the Kiu values confirming that the competitive inhibition predominates over the uncompetitive inhibition mechanism. In contrast, the Kiu values of tolcapone were smaller than the Kic values confirming that the uncompetitive predominates over the competitive inhibition mechanism. Altogether, these data indicate that both entacapone and tolcapone are mixed-type tight-binding inhibitors against COMT in rat cytosol, but the competitive inhibition is more dominant with entacapone and uncompetitive inhibition with tolcapone.
Figure 6. The effects of the cytosolic protein and esculetin concentrations on the IC50 values of entacapone and tolcapone in rat liver cytosol. The inhibition of esculetin 6-O-methylation was determined in 100 mM phosphate pH 7.4 buffer containing 10 mM of MgCl2, the cytosolic protein, 100 µM of PAPS, the indicated concentration of esculetin, and 0 – 1 µM of entacapone or tolcapone. In panel A, the cytosolic protein concentration varied between 0.1 and 0.6 g/L, and 10 µM esculetin was used as a substrate. In panels B and C, the cytosolic protein concentration was 0.2 g/L, and the esculetin concentration varied between 0 and 10 µM.
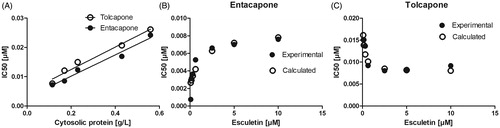
Table 4. Inhibition constants Kiu and Kic of entacapone and tolcapone for COMT catalysed esculetin 6-O-methylation in rat liver cytosol.
Discussion
The catechol compounds are potentially reactive and may cause toxicity such as mutations, chromosomal damage, cancer, and neurodegenerative diseases (Cavalieri et al. Citation2004). The COMT enzyme is an important elimination and defence metabolic pathway for endogenous and exogenous catechol compounds such as amines, estrogens, drugs, and flavonoids (Männistö and Kaakkola Citation1999). In this study, a convenient fluorescence-based assay of the 6-methylation of esculetin into scopoletin was optimised to determine the COMT activity in liver cytosol and microsomes of human, mouse, rat, dog, rabbit, pig, and sheep and ten tissues of the rat. We believe that this is the most comprehensive study comparing COMT activity in different species. Rat, pig, sheep, and dog were characterised as high COMT activity species, whereas the human, mouse, and rabbit COMT activities were lower. In the rat, our detailed comparison of COMT activities in different tissues revealed that the total and protein normalised COMT activity was highest in the liver. The kidney and ileum showed higher COMT activity than other tissues such as the thymus, spleen, pancreas, lung, heart, brain, and muscle. In the brain, the COMT activity was higher in the hippocampus than in other investigated areas. Both entacapone and tolcapone were characterised as potent COMT inhibitors in all the above-mentioned species with IC50 values ranging between 18 and 130 nM at a 10 µM esculetin concentration. The inhibition mechanism experiments confirmed that both drugs are mixed-type tight-binding inhibitors of human and rat COMT.
In mammalian cells, the long membrane-bound MB-COMT and short cytosolic S-COMT isoforms are expressed with different starting reading frames from the same COMT gene in human chromosome 22q11.21 (Männistö et al. Citation1992; Tenhunen et al. Citation1993; Männistö and Kaakkola Citation1999). The cytosol 6-O-methylation of esculetin represents the catalysis reaction by S-COMT whereas the microsome reaction is catalysed by MB-COMT. Here, both the total and protein normalised S-COMT activities were at least three times higher than the MB-COMT activity in the liver, kidney, ileum epithelium, spleen, thymus, lung, or heart. In the pancreas and muscle, the protein normalised MB-COMT activity was five times higher than the S-COMT activity, whereas, in the whole brain, their activities were similar. However, the total S-COMT activity was higher than the microsome activity also in these tissues, as the cytosol protein content is so much higher than the corresponding value of microsomes. Equal S-COMT and MB-COMT protein normalised activities have been previously reported in the adrenal medulla, cortex, and testis (Ellingson et al. Citation1999). In general, our results on the different COMT isoforms are well in line with earlier studies, where COMT mRNA levels, immunoreactive COMT, or COMT enzyme activity have been determined (Tenhunen et al. Citation1994; Ellingson et al. Citation1999; Su et al. Citation2002; Myöhänen et al. Citation2010; Myöhänen and Männistö Citation2010).
The liver is the main metabolising tissue of almost all xenobiotics in the body (Gonzalez et al. Citation2018, Parkinson et al. Citation2019). According to this present study, the same is true for methylation of catechol compounds, as the total esculetin 6-O-methylation was higher in the rat liver than in any of the other nine rat tissues investigated. The COMT activity was four times higher in the liver than in the kidney, which exhibited the second highest COMT activity tissue. In previous studies, the highest COMT activities have also been reported in the liver and kidney (Ellingson et al. Citation1999; Männistö and Kaakkola Citation1999; Myöhänen et al. Citation2010). The protein normalised COMT activities in the ileum epithelium cytosol and pancreatic microsomes were only about 10% of that present in liver. A low protein normalised COMT activity was found in the thymus, spleen, brain, lung, heart, and muscle. Similarly, Ellingson et al. (Citation1999) and Myöhänen et al. (Citation2010) have reported low COMT activities or immunoreactive protein levels in the heart, brain, lung, and spleen in mice. As the skeletal muscle represents about 40% of the bodyweight (Davies and Morris Citation1993; Luttringer et al. Citation2003), its total COMT activity was larger than in the other low activity tissues, whose relative volume is small in comparison to muscle. Therefore, in quantitative terms, skeletal muscle can be a significant tissue in the methylation and elimination of the catechol compounds. Nevertheless, our results indicate that the liver is quantitatively the most important organ for the elimination of catechol compounds via methylation, followed by the kidney. However, our results also imply that methylation occurs widely, although less extensively, in other peripheral tissues. This finding may be of importance since in addition to the elimination, methylation is important for the inactivation of potentially toxic catechol compounds into safe methylated derivatives (Testa and Krämer Citation2008, Parkinson et al. Citation2019).
The function and activity of COMT have been extensively studied in humans, mice, and rats (Männistö and Kaakkola Citation1999), but not in dogs, rabbits, pigs, and sheep. We have extended the liver COMT activity measurements to these species for the first time, and remarkable differences in liver COMT activities emerged. In the high COMT activity species, i.e. rat, pig, and sheep, the esculetin 6-O-methylation was 3–7 times higher than in the low COMT activity species i.e. human, mouse, and rabbit. The differences in the COMT activities were greater in liver cytosols than in microsomes. Another difference in the COMT catalysed esculetin methylation between species was in the stereospecific methylation position of esculetin; in rabbit liver cytosol, the esculetin 6-O-methylation rate was ten times and in sheep five times higher than the esculetin 7-O-methylation rate, while in liver microsomes, it was less than two times higher in rabbit and three times higher in sheep. In other species, the esculetin 6-O-methylation rate was only 1.1–3 times faster than the 7-O-methylation in both liver cytosols and microsomes. As the cytosol contains the S-COMT and the microsome the MB-COMT, it can be concluded that in rabbits but not in other species, the extra peptide in the N-terminal of MB-COMT affected the orientation of esculetin in the active site and altered its stereospecific methylation.
Entacapone and tolcapone are important drugs in the treatment of Parkinson’s disease (Männistö et al. Citation1992). They are used as adjunct therapy to L-dopa to decrease its peripheral metabolism to dopamine. Subsequently, the brain uptake of L-dopa and the formation of dopamine in the CNS increase, which compensates for the loss of endogenous dopamine in the nigrostriatal pathway in patients with Parkinson’s disease (Männistö and Kaakkola Citation1999). Entacapone and tolcapone are potent tight-binding COMT inhibitors both in humans and rats (Schultz and Nissinen Citation1989; Borges et al. Citation1997; De Santi et al. Citation1998; Forsberg et al. Citation2003). We confirm these earlier findings, as the IC50 values were in the nanomolar range at 10 µM substrate concentration, and furthermore the IC50 values increased linearly when the amount of cytosol was increased. Both entacapone and tolcapone potently inhibited the liver cytosol COMT in mouse, rabbit, dog, pig, and sheep with IC50 values in the nanomolar range. Since they are tight-binding inhibitors, we investigated their inhibition mechanism in more detail by studying the effect of the substrate concentration on their IC50 values. The substrate, esculetin, exerted a different type of effect on the IC50 values of entacapone and tolcapone. Thus, when the esculetin concentration increased, the increase in IC50 value was convex shaped for entacapone, indicating that entacapone is a mixed type inhibitor with a lower competitive than uncompetitive (catalytic) inhibition constant. The effect of the esculetin concentration on the IC50 value of tolcapone was opposite, showing a concave type decrease in the IC50 value. Therefore, tolcapone is also a mixed type inhibitor but with a lower uncompetitive than competitive inhibition constant, or it could be a pure uncompetitive inhibitor. This finding is at odds with the previous studies which suggested that entacapone and other nitrocatechol compounds are competitive rat COMT inhibitors (Schultz and Nissinen Citation1989; Bonifácio et al. Citation2002). Nitrocatechol inhibitors possess the same binding mode as COMT substrates, but the nitro substitution hinders their methylation (Ma et al. Citation2014). However, tolcapone is known to be also a substrate for COMT and it is methylated predominantly to p-methyltolcapone (Palma et al. Citation2003), whereas an isomerised Z-isomer m-methylentacapone is formed in vivo and no evidence about direct methylation of entacapone is available (Wikberg et al. Citation1993). These metabolic differences between entacapone and tolcapone may explain their different types of mixed inhibition mechanisms.
Earlier, the COMT activity has been determined as an endpoint measurement using several catechol compounds such as esculetin (Kurkela et al. Citation2004), dihydroyxybenzylamine (Ellingson et al. Citation1999) and hydroxybenzoic acid (Reenilä et al. Citation1995) as a substrate. Here, the COMT catalysed reaction was studied by monitoring the continuous fluorescence increase when the weakly fluorescent esculetin was methylated to a strongly fluorescent metabolite – scopoletin. The COMT activity could be reliably measured with this method, although in the COMT catalysed reaction, the esculetin 7-O-methylation to the nonfluorescent isoscopoletin is also taking place at the same time. This was confirmed by an HPLC-MS analysis, which correlated with the fluorescence-based esculetin 6-O-methylation activity in different species. The clear benefits of this continuous fluorescence-based esculetin 6-O-methylation assay are that it is convenient, fast, and allows high throughput type measurements. To demonstrate the flexibility of this optimised method, we were able to reliably investigate the COMT activities in liver cytosols and microsomes not only in different species and various tissues, but also with different inhibitory experimental set-ups e.g. inhibiting COMT enzyme with entacapone and tolcapone in the presence of varying inhibitor, substrate, and enzyme concentrations. Evidently, these studies would have been more laborious, time-consuming, and expensive, if UV detection, ionisation, or m/z after LC separation had been used. Notably, since the COMT enzyme has a unique role in regulating the prefrontal dopaminergic function in the brain, it has attracted some attention as a potential drug target for treating the cognitive dysfunction in schizophrenia (Kiss and Soares-da-Silva Citation2014) and novel, brain penetrating COMT inhibitors are an area of active research. We believe that our novel straightforward, convenient assay for measuring COMT activity in various mammalian tissues will be beneficial in the discovery of new COMT inhibitors in the future.
In conclusion, rat, pig, sheep, and dog were characterised as high COMT activity, and human, mouse, and rabbit as low COMT activity species. The COMT activity was highest in the liver. In the kidney, its activity was about 25%, in ileum epithelium about 15%, and in other tissues less than 10% of that present in the liver. In the cytosol, the COMT activity is 2–10 times higher than in the microsomes. Two anti-Parkinson drugs, entacapone and tolcapone, were characterised as being different types of tight binding mixed inhibitors of rat COMT enzyme, i.e. entacapone was predominantly competitive type whereas tolcapone was more of an uncompetitive type of inhibitor.
Acknowledgements
The authors thank Dr. Ewen MacDonald for revising the language of the manuscript, and Mrs. Hannele Jaatinen for her excellent technical assistance in the COMT assay. The authors appreciate Biocentre Finland and Biocentre Kuopio for supporting the LC-MS laboratory facility.
Disclosure statement
The authors report no declarations of interest.
References
- Alfa, H.H. and Arroo, R.R.J., 2019. Over 3 decades of research on dietary flavonoid antioxidants and cancer prevention: what have we achieved? Phytochemistry reviews, 18 (4), 989–1004.
- Bianco, M.-A. and Savolainen, H., 1994. Woodworkers’ exposure to tannins. Journal of applied toxicology : JAT, 14 (4), 293–295.
- Bonifácio, M.J., et al., 2002. Kinetics and crystal structure of catechol-o-methyltransferase complex with co-substrate and a novel inhibitor with potential therapeutic application. Molecular pharmacology, 62 (4), 795–805.
- Borges, N., et al., 1997. Studies on the tight-binding nature of tolcapone inhibition of soluble and membrane-bound rat brain catechol-O-methyltransferase. The journal of pharmacology and experimental therapeutics, 282 (2), 812–817.
- Cavalieri, E., et al., 2006. Catechol estrogen quinones as initiators of breast and other human cancers: implications for biomarkers of susceptibility and cancer prevention. Biochimica et biophysica acta, 1766 (1), 63–78.
- Cavalieri, E., Rogan, E., and Chakravarti, D., 2004. The role of endogenous catechol quinones in the initiation of cancer and neurodegenerative diseases. Methods in enzymology, 293–319.
- Davies, B. and Morris, T., 1993. Physiological parameters in laboratory animals and humans. Pharmaceutical research, 10 (7), 1093–1095.
- De Santi, C., et al., 1998. Catechol-O-methyltransferase: variation in enzyme activity and inhibition by entacapone and tolcapone. European journal of clinical pharmacology, 54 (3), 215–219.
- Ellingson, T., et al., 1999. Determination of differential activities of soluble and membrane-bound catechol-O-methyltransferase in tissues and erythrocytes. Journal of chromatography B: biomedical sciences and applications, 729 (1-2), 347–353.
- Forsberg, M., et al., 2003. Pharmacokinetics and pharmacodynamics of entacapone and tolcapone after acute and repeated administration: a comparative study in the rat. The journal of pharmacology and experimental therapeutics, 304 (2), 498–506.
- Gonzalez, F. J., Coughtrie, M., and Tukey, R. H., 2018. Drug metabolism. In: L.L. Brunton, R. Hilal-Dandan, B.C. Knollman, eds. Goodman & Gilmans’s the pharmacological basis of therapeutics. 13th ed. New York: McGraw-Hill, 85–100.
- Heikkinen, A.T., et al., 2015. Quantitative ADME proteomics – CYP and UGT enzymes in the Beagle dog liver and intestine. Pharmaceutical research, 32 (1), 74–90.
- Johnson, K., et al., 2003. Metabolism, pharmacokinetics, and excretion of a highly selective N-methyl-D-aspartate receptor antagonist, traxoprodil, in human cytochrome P450 2D6 extensive and poor metabolizers. Drug metabolism and disposition: the biological fate of chemicals, 31 (1), 76–87.
- Kiss, L.E. and Soares-da-Silva, P., 2014. Medicinal chemistry of catechol O-methyltransferase (COMT) inhibitors and their therapeutic utility. Journal of medicinal chemistry, 57 (21), 8692–8717.
- Kurkela, M., et al., 2004. Microplate screening assay to identify inhibitors of human catechol-O-methyltransferase. Analytical biochemistry, 331 (1), 198–200.
- Lantz, R.J., et al., 2003. Metabolism, excretion, and pharmacokinetics of duloxetine in healthy human subjects. Drug metabolism and disposition: the biological fate of chemicals, 31 (9), 1142–1150.
- Lautala, P., Ulmanen, I., and Taskinen, J., 1999. Radiochemical high-performance liquid chromatographic assay for the determination of catechol O-methyltransferase activity towards various substrates. Journal of chromatography B: biomedical sciences and applications, 736 (1-2), 143–151.
- Lekse, J., et al., 2001. Plant catechols prevent lipid peroxidation in human plasma and erythrocytes. Molecular and cellular biochemistry, 226 (1-2), 89–95.
- Luttringer, O., et al., 2003. Physiologically based pharmacokinetic (PBPK) modeling of disposition of epiroprim in humans. Journal of pharmaceutical sciences, 92 (10), 1990–2007.
- Ma, Z., Liu, H., and Wu, B., 2014. Structure-based drug design of catechol-O-methyltransferase inhibitors for CNS disorders. British journal of clinical pharmacology, 77 (3), 410–420.
- Männistö, P.T. and Kaakkola, S., 1999. Catechol-O-methyltransferase (COMT): biochemistry, molecular biology, pharmacology, and clinical efficacy of the new selective COMT inhibitors. Pharmacological reviews, 51 (4), 593–628.
- Männistö, P. T., et al., 1992., Characteristics of catechol O-methyltransferase (COMT) and properties of selective COMT inhibitors. In: E. Jucker, ed. Progress in drug research/Fortschritte der arzneimittelforschung/Progrès des recherches pharmaceutiques. Basel: Birkhäuser, 291–350.
- Myöhänen, T.T. and Männistö, P.T., 2010. Distribution and functions of catechol-O-methyltransferase proteins: do recent findings change the picture? International review of neurobiology, 95, 29–47.
- Myöhänen, T.T., Schendzielorz, N., and Männistö, P.T., 2010. Distribution of catechol-O-methyltransferase (COMT) proteins and enzymatic activities in wild-type and soluble COMT deficient mice. Journal of neurochemistry, 113 (6), 1632–1643.
- Palma, P.N., et al., 2003. Molecular modeling and metabolic studies of the interaction of catechol-O-methyltransferase and a new nitrocatechol inhibitor. Drug metabolism and disposition: the biological fate of chemicals, 31 (3), 250–258.
- Parkinson, A., et al., 2019. Biotransformation of xenobiotics. In: C.D. Klaassen, ed. Casarett & Doull’s toxicology: the basic science of poisons. 9th ed. New York: Mc Graw Hill Education, 193–399.
- Reenilä, I., Tuomainen, P., and Männistö, P.T., 1995. Improved assay of reaction products to quantitate catechol-O-methyltransferase activity by high-performance liquid chromatography with electrochemical detection. Journal of chromatography B: biomedical sciences and applications, 663 (1), 137–142.
- Reid, A.-M., et al., 2019. In vitro human metabolism and inhibition potency of verbascoside for CYP enzymes. Molecules, 24 (11), 2191.
- Rhodes, L.E., et al., 2013. Oral green tea catechin metabolites are incorporated into human skin and protect against UV radiation-induced cutaneous inflammation in association with reduced production of pro-inflammatory eicosanoid 12-hydroxyeicosatetraenoic acid. The British journal of nutrition, 110 (5), 891–900.
- Riishede, L. and Nielsen-Kudsk, F., 1990. Myocardial effects of adrenaline, isoprenaline and dobutamine at hypothermic conditions. Pharmacology & toxicology, 66 (5), 354–360.
- Sak, K., 2017. Intake of individual flavonoids and risk of carcinogenesis: overview of epidemiological evidence. Nutrition and cancer, 69 (8), 1119–1150.
- Sanders-Bush, E. and Hazelwood, L., 2015. 5-Hydroxytryptamine (serotonin) and dopamine. In: L.L. Brunton, B.A. Chabner, and B.C. Knollmann, eds. Goodman & Gilman’s: the pharmacological basis of therapeutics. New York, NY: McGraw-Hill Education.
- Schultz, E. and Nissinen, E., 1989. Inhibition of rat liver and duodenum soluble catechol-O-methyltransferase by a tight-binding inhibitor OR-462. Biochemical pharmacology, 38 (22), 3953–3956.
- Slominski, A., et al., 2004. Melanin pigmentation in mammalian skin and its hormonal regulation. Physiological reviews, 84 (4), 1155–1228.
- Su, A.I., et al., 2002. Large-scale analysis of the human and mouse transcriptomes. Proceedings of the National Academy of Sciences of the United States of America, 99 (7), 4465–4470.
- Tenhunen, J., et al., 1993. Structure of the rat catechol-O-methyltransferase gene: separate promoters are used to produce mRNAs for soluble and membrane-bound forms of the enzyme. DNA and cell biology, 12 (3), 253–263.
- Tenhunen, J., et al., 1994. Genomic organization of the human catechol O-methyltransferase gene and its expression from two distinct promoters. European journal of biochemistry, 223 (3), 1049–1059.
- Testa, B. and Krämer, S.D., 2008. The biochemistry of drug metabolism-an introduction: part 4. reactions of conjugation and their enzymes. Chemistry & biodiversity, 5 (11), 2171–2336.
- Veser, J., 1987. Kinetics and inhibition studies of catechol O-methyltransferase from the yeast Candida tropicalis. Journal of bacteriology, 169 (8), 3696–3700.
- Wikberg, T., et al., 1993. Identification of major metabolites of the catechol-O-methyltransferase inhibitor entacapone in rats and humans. Drug metabolism and disposition: the biological fate of chemicals, 21 (1), 81–92.
- Yager, J.D., 2012. Catechol-O-methyltransferase: characteristics, polymorphisms and role in breast cancer. Drug discovery today. Disease mechanisms, 9 (1-2), e41–e46.
- Yang, J., Cohen Stuart, M.A., and Kamperman, M., 2014. Jack of all trades: versatile catechol crosslinking mechanisms. Chemical society reviews, 43 (24), 8271–8298.
- Zhu, B.T., 2004. CNS dopamine oxidation and catechol-O-methyltransferase: importance in the etiology, pharmacotherapy, and dietary prevention of Parkinson’s disease. International journal of molecular medicine, 13 (3), 343–353.
- Zucca, F.A., et al., 2014. Neuromelanin of the human substantia nigra: an update. Neurotoxicity research, 25 (1), 13–23.