
 ?Mathematical formulae have been encoded as MathML and are displayed in this HTML version using MathJax in order to improve their display. Uncheck the box to turn MathJax off. This feature requires Javascript. Click on a formula to zoom.
Abstract
We evaluated the in vitro drug–drug interaction (DDI) potential of enerisant (TS-091), a histamine H3 receptor antagonist/inverse agonist, mediated by cytochrome P450 (CYP) and transporters, as well as the pharmacokinetics of enerisant in healthy male subjects.
Enerisant did not inhibit CYP1A2, CYP2A6, CYP2B6, CYP2C8, CYP2C9, CYP2C19, CYP2D6, CYP2E1, or CYP3A4 and did not induce CYP1A2, CYP2B6, or CYP3A4. Enerisant inhibited organic cation transporter 2, multidrug and toxin extrusion protein (MATE) 1, and MATE2-K, but not P-glycoprotein (P-gp), breast cancer resistance protein, organic anion transporting polypeptide (OATP) 1B1, OATP1B3, organic anion transporter (OAT) 1, or OAT3. Enerisant was a substrate for P-gp, but not for eight other transporters.
In healthy male subjects, enerisant was rapidly absorbed after oral administration, and the plasma concentration increased dose-dependently. The urinary excretion of enerisant within 48 h after administration was 64.5% to 89.9% of the dose, indicating that most of the absorbed enerisant was excreted in the urine without being metabolized.
Based on the plasma concentrations at the estimated clinical dose, enerisant is unlikely to cause CYP-mediated, clinically relevant DDI. Although the possibility of transporter-mediated, clinically relevant DDI cannot be ruled out, there is little or no risk of side effects.
Introduction
In the central nervous system, histamine plays an important role in the control of wakefulness. The blockade of histaminergic transmission and the inhibition of histamine synthesis have been reported to increase slow-wave sleep, while the enhancement of histaminergic transmission increases wakefulness (Lin et al. Citation1996, Lin Citation2000, Parmentier et al. Citation2002). Four receptor subtypes of histamine (H1, H2, H3, and H4 receptors) have been identified (Leurs et al. Citation2011), of which the H1 and H3 receptors are involved in the regulation of the sleep–wake cycle. H1 receptors are localized postsynaptically, and the stimulation of H1 receptors by histamine released from histaminergic terminals is involved in the maintenance of wakefulness (Huang et al. Citation2006, Parmentier et al. Citation2016). In contrast, the H3 receptor is localized presynaptically and functions as an autoreceptor that negatively regulates the synthesis and release of histamine (Arrang et al. Citation1983). Thus, the specific blocking of H3 receptors is likely to promote wakefulness by increasing histamine release and subsequently stimulating postsynaptic H1 receptors. Indeed, H3 receptor antagonists have been reported to promote wakefulness and to reduce rapid eye movement sleep and slow-wave sleep during the light phase, during which rodents spend most of their sleep time (Le et al. Citation2008, Parmentier et al. Citation2007), and to reduce the number and duration of cataplexy in animal models of narcolepsy (Bonaventure et al. Citation2007).
Enerisant (TS-091) is a potent and highly selective antagonist/inverse agonist of H3 receptors, and has been shown to increase the release of histamine (Hino et al. Citation2020). In addition, enerisant has been shown to possess wake-promoting effects in rats and monkeys without increasing locomotor activity, unlike psychostimulants (Parmentier et al. Citation2007, Hino et al. Citation2020). In a positron emission tomography study of healthy male subjects, enerisant showed a high receptor occupancy for H3 receptors in the brain at a dose of 5 mg (estimated clinical dose) (in preparation). Given that pitolisant, an H3 receptor antagonist/inverse agonist, is currently on the market in the EU for the treatment of narcolepsy and in the US for excessive daytime sleepiness (Lamb Citation2020), enerisant is also expected to be a therapeutic drug for narcolepsy and other sleep disorders in humans.
Multiple drugs are often used in combination for the treatment of narcolepsy (Barateau et al. Citation2016). In addition, patients with narcolepsy often present with comorbid conditions, such as metabolic and cardiovascular diseases, psychiatric disorders, and gastrointestinal diseases, for which drugs are also used in combination (Ohayon Citation2013). Therefore, it is important to assess the drug–drug interaction (DDI) potential in the treatment of narcolepsy.
The present study was conducted to evaluate the in vitro DDI potential of enerisant mediated by cytochrome P450 (CYP) inhibition, CYP induction, and drug transporters using human liver microsomes, human primary hepatocytes, and transporter-expressing mammalian cells, respectively, and to evaluate the pharmacokinetics (PK) of single oral doses of enerisant hydrochloride in healthy Japanese male subjects. Furthermore, based on the PK of enerisant, we also examined clinically relevant DDI potential of enerisant.
Materials and methods
Materials
Enerisant hydrochloride, [1-(4-{3-[(2R)-2-Methylpyrrolidin-1-yl]propoxy}phenyl)-1H-pyrazol-4-yl](morpholin-4-yl) methanone monohydrochloride, and enerisant-d8 were synthesized at Taisho Pharmaceutical Co., Ltd. (Saitama, Japan). [14C]Enerisant (specific activity, 5 MBq/mg; radiochemical purity, >95%, ) was synthesized at GE Healthcare (Chicago, IL). Human pooled liver microsomes (n = 50 donors, mixed gender) and cryopreserved human hepatocytes (three individual donors, a male and two females) were purchased from Sekisui XenoTech (Kansas City, KS). P-Glycoprotein (P-gp)-transfected Madin–Darby canine kidney (MDCK) II cells (P-gp-MDCK), breast cancer resistance protein (BCRP)-transfected MDCKII cells (BCRP-MDCK), organic anion transporting polypeptide (OATP) 1B1-transfected Chinese hamster ovary (CHO) cells (OATP1B1-CHO), OATP1B3-transfected CHO cells (OATP1B3-CHO), organic cation transporter (OCT) 2-transfected CHO cells (OCT2-CHO), and CHO cells transfected with only the vector (Cont-CHO) were purchased from Solvo Biotechnology (Budaörs, Hungary). Organic anion transporter (OAT) 1-transfected human embryonic kidney (HEK) 293 cells (OAT1-HEK) and control HEK293 cells transfected with only the vector (Cont-HEK-S) developed at Sekisui Medical (Ibaraki, Japan) were also used. Cultured cell plates of OAT3-transfected HEK293 cells (OAT3-HEK), multidrug and toxin extrusion protein (MATE) 1-transfected HEK293 cells (MATE1-HEK), MATE2-K-transfected HEK293 cells (MATE2-K-HEK), and HEK293 cells transfected with only the vector (Cont-HEK-G) were purchased from Genomembrane (Kanagawa, Japan). All other chemicals and solvents were of analytical grade and were obtained from commercial sources.
Figure 1. Chemical structure of [14C]enerisant. Asterisk donates the position of the 14 C label.
![Figure 1. Chemical structure of [14C]enerisant. Asterisk donates the position of the 14 C label.](/cms/asset/1dd87c60-66c7-4a78-a161-a867dd1c28c0/ixen_a_1918361_f0001_b.jpg)
Plasma protein binding
Plasma samples were obtained from rats, dogs, and human volunteers on the morning of the day of the experiment. The protein binding of [14C]enerisant in the plasma was investigated using the ultrafiltration method at final concentrations of 0.05, 0.5, and 5 μg/mL. After incubation at 37 °C for 30 min, a 100-μL aliquot (n = 1) of a [14C]enerisant-spiked plasma sample was used for the radioactivity measurement. The plasma sample was transferred to a centrifugal ultrafilter (Centrifree; Merck, Darmstadt, Germany) and centrifuged at 1600 ×g for 10 min at room temperature. A 100-μL aliquot (n = 1) of each filtrate was subjected to the radioactivity measurement. Radioactivity in the measurement samples was determined using a liquid scintillation counter (LSC). The protein binding (%) was calculated from the Cp (radioactivity concentration in the plasma) and the Cf (radioactivity concentration in the filtrate) using the following equation:
CYP inhibition studies
The potential inhibitory effects of enerisant on the specific activities of nine CYP isoforms (CYP1A2, CYP2A6, CYP2B6, CYP2C8, CYP2C9, CYP2C19, CYP2D6, CYP2E1, and CYP3A4) were evaluated using human pooled liver microsomes. The marker reactions, the concentrations of probe substrates, and the reaction times for CYP inhibition studies are shown in . These substrate concentrations were set near the Km values of the CYP isoforms. The reaction mixture (1 mL) consisted of 0.2 mg/mL protein human liver microsomes, 0.1 M (25 mM for CYP2A6) sodium-potassium phosphate buffer (pH7.4), 0.05 mM EDTA, a probe substrate, enerisant, and a nicotinamide-adenine dinucleotide phosphate, reduced form (NADPH)-generating system (0.5 mM β-NADP+, 5 mM glucose-6-phosphate, 1 unit/mL glucose-6-phosphate dehydrogenase, and 5 mM MgCl2). Enerisant was dissolved in methanol/purified water (1:1, v/v) and added to the reaction mixture at 0 or 0.3 to 100 µM. The final methanol concentration was set at 0.75%. The reaction mixture was prepared on ice and was pre-incubated at 37 °C for 5 min. The reaction was initiated by the addition of the NADPH-generating system, and the reaction mixture was incubated at 37 °C. After the designated incubation times, the reaction was stopped by the addition of acetonitrile. To determine the concentrations of marker metabolites, a liquid chromatography-tandem mass spectrometry (LC-MS/MS) system (Quattro Micro, Waters, Milford, MA) was used.
Table 1. Marker reactions, the concentrations of probe substrates, and the reaction times for CYP inhibition studies.
CYP induction studies
Primary cultured cryopreserved human hepatocytes from three donors were cultured according to previously published methods (Robertson et al. Citation2000, Madan et al. Citation2003, Paris et al. Citation2009) and treated with concentrations of 0, 1, 5, or 20 µM of enerisant for 3 days. The test substances were dissolved in dimethyl sulfoxide (DMSO), with a final concentration of 0.1%. The CYP induction potential was assessed based on changes in the expression of messenger ribonucleic acid (mRNA) for CYP1A2, CYP2B6, and CYP3A4. Omeprazole (50 µM), phenobarbital (750 µM), and rifampicin (20 µM) were used as control inducers for CYP1A2, CYP2B6, and CYP3A4, respectively. Approximately 72 h after the treatment, hepatocytes were lysed in Buffer RLT reagent containing β-mercaptoethanol (100:1). The cell lysates were mixed by shaking for 10 min at 800 rpm. Total RNA was isolated using the RNeasy Mini Kit (Qiagen, Venlo, Netherlands) according to the manufacturer’s recommendations. Complementary deoxyribonucleic acid (cDNA) was prepared from RNA using the AB 7900HT Fast Real Time PCR System (Thermo Fisher Scientific, Waltham, MA). mRNA expression was determined by quantitative polymerase chain reaction according to the manufacturer’s protocol. Reactions were analysed using the AB 7900HT real-time PCR sequence detection system (Thermo Fisher Scientific, Waltham, MA). The relative quantity of the target cDNA compared with that of the control cDNA (GAPDH) was determined using the ΔΔCt method. To evaluate the cytotoxicity of enerisant, the replaced cultured medium was collected at all time points, and the lactate dehydrogenase (LDH) activity in the medium was measured using a cytotoxicity detection kit (Roche Diagnostics, Indianapolis, IN).
Cell culture for transporter studies
P-gp-MDCK and BCRP-MDCK were cultured in Dulbecco’s modified Eagle’s medium (DMEM) containing 10% foetal bovine serum (FBS), 2 mM l-glutamine, 1% non-essential amino acids solution, 100 U/mL penicillin, and 100 µg/mL streptomycin in a 5% CO2 incubator. OATP1B1-CHO, OATP1B3-CHO, OCT2-CHO, and Cont-CHO were cultured in DMEM/F12 containing 10% FBS, 2 mM L-glutamine, 34 µg/mL L-proline, 100 U/mL penicillin, and 100 µg/mL streptomycin in a 5% CO2 incubator. OAT1-HEK and Cont-HEK-S were cultured in DMEM containing 10% FBS, 2 mM l-glutamine, 100 U/mL penicillin, 100 µg/mL streptomycin, and 0.25 µg/mL amphotericin B in a 5% CO2 incubator. OAT3-HEK, MATE1-HEK, MATE2-K-HEK, and Cont-HEK-G were cultured according to the manufacturer’s protocol.
Transport studies
P-gp-MDCK and BCRP-MDCK were seeded at a density of 2 × 10⁵ cells/cm2 in 12-well Transwell inserts (polycarbonate, 1.1 cm2, pore size 3 µm; Corning Inc., Corning, NY). Before the experiment, the media in the culture inserts and wells were replaced with Hanks’ balanced salt solution (HBSS), and the culture inserts and wells were pre-incubated at 37 °C. [14C]Enerisant in a DMSO solution was added to HBSS (donor solution) at 5 µM. For the apical to basolateral (A to B) assay, transport was initiated by replacing the solution with the donor solution on the apical side and with HBSS (acceptor solution) on the basolateral side. For the basolateral to apical (B to A) assay, transport was initiated by replacing the solution with the donor solution on the basolateral side and with the acceptor solution on the apical side. The final concentration of DMSO in both the donor and acceptor solutions was set at 0.2%. Immediately after the initiation of incubation, an aliquot of donor solution was taken to determine the initial concentration of the substrate. An aliquot of the acceptor solution was taken at multiple time points (0.5, 1, 1.5, and 2 h), and the same volume of acceptor solution prewarmed to 37 °C was immediately added. The radioactivity in the acceptor solution was determined after the subtraction of the background data using an LSC. To confirm the presence of P-gp-mediated transport, the effect of verapamil (100 μM) on the transport of the test substance was evaluated at one time point (1 h).
The apparent permeability coefficient (Papp) for the P-gp and BCRP assays was calculated using the following equation:
where dQ/dt is the transport rate (pmol/s) calculated from the slope of the cumulative permeated amount-versus-time curve, C0 is the initial concentration of the probe substance in the donor solution (pmol/mL), and A is the membrane area (cm2).
The efflux ratios were calculated from the mean of the Papp for A to B and the mean of the Papp for B to A using the following equation:
Uptake studies
OATP1B1-CHO, OATP1B3-CHO, OCT2-CHO, and Cont-CHO were seeded at a density of 3 × 10⁵ cells/cm2 in 12-well or 96-well plates and cultured for 24 h. The medium for OATP1B1-CHO and OATP1B3-CHO was supplemented with 5 mM sodium butyrate. OAT3-HEK, MATE1-HEK, MATE2-K-HEK, and Cont-HEK-G were seeded at a density of 2 × 10⁵ cells/well in 12-well or 24-well plates and cultured for 24 h. OAT1-HEK and Cont-HEK-S were seeded at a density of 2.5 × 10⁵ cells/well in 24-well plates and cultured for 2 days. Before the uptake experiment, the cells were rinsed twice with prewarmed HBSS (37 °C). After aspirating the HBSS, uptake was initiated by adding HBSS containing [14C]enerisant, which was added in a DMSO solution at 1 µM. The final concentration of DMSO in the solution was set at 0.2% for OAT1 or 1% for OATPs (OATP1B1 and OATP1B3), OCT2, OAT3, and MATEs (MATE1 and MATE2-K). The time-dependent uptake was measured for 1 min. At the designated time, the uptake was stopped by aspirating the incubation solution and washing the cells three times with ice-cold HBSS. The cells in each well were lysed by the addition of 1 M or 0.1 M sodium hydroxide and neutralized by adding 0.5 M hydrochloric acid (except for OAT1). An aliquot of the lysate was taken, and the radioactivity level was determined using an LSC. The residual samples or samples treated in HBSS containing 1% DMSO instead of [14C]enerisant were examined using a BCA protein assay kit (Thermo Fisher Scientific, Waltham, MA) to determine the cellular protein concentration. The cellular uptake (pmol/mg protein) was calculated from the uptake amount of the substrate per protein content at each time point.
Transporter inhibition studies
The effect of enerisant (1 to 100 μM) on transcellular transport mediated by P-gp and BCRP was examined. The transcellular transport study was performed in the same manner as described above. The probe substrates and reaction conditions are shown in . The incubation times for the inhibition studies were set at one point (). Enerisant or a control inhibitor was added to the donor and acceptor solutions. Verapamil (100 μM) and Ko143 (1 μM) were used as control inhibitors for P-gp and BCRP, respectively.
Table 2. Probe substrates, the concentrations of probe substrates, and the incubation times for transporter inhibition studies
The uptakes of probe substrates in OATP1B1-CHO, OATP1B3-CHO, OAT1-HEK, OAT3-HEK, OCT2-CHO, MATE1-HEK, and MATE2-K-HEK together with the corresponding control cells in the presence of enerisant (1 to 100 µM) were measured to investigate the inhibitory effects on these transporters. The uptake of each probe substrate was examined in the same manner as that for the [14C]enerisant uptake study. The probe substrates and reaction conditions are shown in . Rifampicin (100 μM), probenecid (100 μM), quinidine (100 μM), and pyrimethamine (1 μM) were used as control inhibitors for OATPs, OATs (OAT1 and OAT3), OCT2, and MATEs, respectively.
The Papp value, the efflux ratio, and the cellular uptake were calculated in the same manner as that used for the transport and uptake studies. For the experiments for P-gp and BCRP, the % of the control value of the probe transport was calculated by dividing the efflux ratio in the presence of enerisant or the control inhibitor by that in the absence of enerisant or control inhibitor. For the experiments for OATP1B1, OATP1B3, OAT1, OAT3, OCT2, MATE1, and MATE2-K, the % of the control value of the probe uptake was calculated using the following equation:
where D is the individual value of the individual uptake amount in transporter-expressing cells subtracted from the mean value of the uptake amount in control cells, and E is the mean value of the individual uptake amount in transporter-expressing cells subtracted from the mean value of the uptake amount in control cells without enerisant or the control inhibitor.
The half-maximal inhibitory concentration (IC50) value for the inhibition of each transporter was calculated based on the % of the control using Phoenix WinNonlin Ver. 6.2 (Certara, Princeton, NJ) using the following equation:
where I0 is the % of the control in the absence of enerisant, I is the concentration (µM) of enerisant, and γ is the Hill coefficient.
Phase 1 clinical study
A first-in-humans, randomized, single-blind, placebo-controlled, single-ascending dose study was conducted to evaluate the safety, tolerability, and PK of enerisant. The study was approved by the relevant institutional review boards and conducted in accordance with the standards of the Japanese Pharmaceutical Affairs Law, Good Clinical Practice, and the Declaration of Helsinki. Written informed consent was obtained from all subjects prior to their participation in the study. The study population comprised healthy Japanese male subjects aged 20 to 38 years, body weight 54.9 to 75.3 kg, and body mass index 19.1 to 24.5 kg/m2. The subjects received a single oral dose of 1, 3, 10, 30, 50, 100, or 150 mg of enerisant or a placebo after fasting and were randomly assigned to receive either enerisant (six subjects) or the placebo (two subjects). Blood samples were collected before dosing and at 0.25, 0.5, 1, 1.5, 2, 3, 4, 6, 8, 12, 24, and 48 h after dosing. Urine samples were collected before dosing and at the following time intervals after dosing: 0 to 8 h, 8 to 24 h, and 24 to 48 h. The concentrations of enerisant in the plasma and urine were determined using validated LC-MS/MS methods. The human plasma samples (50 μL) were prepared by solid-phase extraction (OASIS MCX μElution Plate, 30 μm, Waters Corporation, Milford, MA) after the addition of the internal standard (enerisant-d8). The human urine samples (20 μL) were prepared by dilution with acetonitrile/distilled water/formic acid (5:95:0.1, v/v/v) after the addition of the internal standard. Chromatographic separation was performed on a TSKgel ODS-100V (2.0 × 50 mm, 5 μm particle size, Tosoh, Tokyo, Japan) with distilled water/formic acid (100:0.1, v/v) and acetonitrile/formic acid (100:0.1, v/v) as the mobile phase under gradient conditions. Mass spectrometric detection was performed on an API4000 (AB SCIEX, Framingham, MA) with a turbo ion spray source in the positive ion mode using multiple reaction monitoring of the transitions of the m/z 399 precursor ion to the m/z 98 product ion for enerisant and the m/z 407 precursor ion to the m/z 98 product ion for the internal standard. The lowest limit of quantification for enerisant in plasma and urine were 0.0300 ng/mL and 0.0300 µg/mL.
PK analysis
The plasma concentration-time profiles of enerisant were analysed using a non-compartmental analysis with SAS 9.2 (SAS Institute, Cary, NC), and the PK parameters were calculated. The urinary excretion was calculated by dividing the amount of enerisant excreted in urine by the administered dose. The renal clearance was calculated as the total amount of enerisant excreted in urine over 48 h divided by the area under the concentration-time curve (AUC) from 0 to 48 h.
Results
Plasma protein binding
The plasma protein binding of [14C]enerisant was determined using the ultrafiltration method in rats, dogs and humans. The percentage of plasma protein binding of [14C]enerisant (0.05, 0.5, and 5 µg/mL) was 33.3% to 36.9% in rats, 25.5% to 26.0% in dogs, and 31.0% to 31.7% in humans (). These results indicated the absence of any marked species differences or concentration dependence.
Table 3. Plasma protein binding of [14C]Enerisant in rat, dog, and human.
CYP inhibition studies
The inhibitory effects of enerisant on the specific activities of nine CYP isoforms (CYP1A2, CYP2A6, CYP2B6, CYP2C8, CYP2C9, CYP2C19, CYP2D6, CYP2E1, and CYP3A4) were investigated using human liver microsomes. The percent inhibition of enerisant for CYP isoforms did not exceed 50% at concentrations of up to 100 µM (). The IC50 values for all the CYP isoforms were higher than 100 μM.
Table 4. Inhibition of enerisant for CYP activities in human liver microsomes.
CYP induction studies
To examine the induction potential of enerisant on CYP1A2, CYP2B6, and CYP3A4, the mRNAs were measured after the exposure of primary human hepatocytes prepared from three donors to enerisant. The mRNA levels of CYP1A2, CYP2B6, and CYP3A4 following enerisant exposure were in the ranges of 0.945- to 1.13-fold, 1.09- to 1.23-fold, and 1.05- to 1.42-fold of the solvent control mRNA levels, respectively (). The mRNA levels following the exposure of control inducers increased by 14.0- to 92.2-fold of the solvent control mRNA levels. The LDH activity after the treatment of enerisant did not increase.
Table 5. Effects of enerisant and control inducers on mRNA of primary human hepatocytes after 72 h-exposure.
Transport of enerisant by P-gp and BCRP
The bidirectional transcellular transport of [14C]enerisant (5 µM) mediated by P-gp was investigated using P-gp-MDCK for both the A to B and the B to A directions. The Papp of the B to A direction of [14C]enerisant across P-gp-MDCK was 45.9 × 10⁶ (cm/s), which was remarkably greater than that of the A to B direction (4.17 × 106 cm/s) (). The efflux ratio of the Papp for the B to A direction and that for the A to B direction across P-gp-MDCK was 11.0 (). To confirm the contribution of P-gp to the efflux directional transport of [14C]enerisant, the effects of a P-gp inhibitor, verapamil (100 μM), were examined. As a result, verapamil inhibited the efflux directional transport of [14C]enerisant across P-gp-MDCK (), indicating that enerisant is a substrate for P-gp.
Table 6. [14C]Enerisant permeability and efflux ratio across P-gp-expressing MDCK cell and BCRP-expressing MDCK cell monolayers.
The transport of [14C]enerisant (5 µM) mediated by BCRP was investigated using BCRP-MDCK. The Papp of the B to A direction of [14C]enerisant across BCRP-MDCK was slightly greater than that of the A to B direction (). The efflux ratio of [14C]enerisant across BCRP-MDCK was 1.70, indicating that enerisant is not a substrate for BCRP ().
Uptake of enerisant by OATP1B1, OATP1B3, OAT1, OAT3, OCT2, MATE1, and MATE2-K
The cellular uptake of enerisant mediated by OATP1B1, OATP1B3, OAT1, OAT3, OCT2, MATE1, and MATE2-K was evaluated using cells transfected with each transporter. The uptake of [14C]enerisant (1 μM) was measured over time using OATP1B1-CHO, OATP1B3-CHO, OAT1-HEK, OAT3-HEK, OCT2-CHO, MATE1-HEK, and MATE2-K-HEK, together with the corresponding control cells. The time-dependent uptake of [14C]enerisant in all the transporter-expressing cells was almost equal to the uptake in the control cells (). These results indicate that enerisant is not a substrate for OATP1B1, OATP1B3, OAT1, OAT3, OCT2, MATE1, or MATE2-K.
Figure 2. Time-dependent uptake of [14C]enerisant by cells transfected with OATP1B1 (A), OATP1B3 (B), OAT1 (C), OAT3 (D), OCT2 (E), MATE1 (F), and MATE2-K (G) compared with control cells, which were transfected with vector only. Data are represented as mean ± SD of quadruplicate.
![Figure 2. Time-dependent uptake of [14C]enerisant by cells transfected with OATP1B1 (A), OATP1B3 (B), OAT1 (C), OAT3 (D), OCT2 (E), MATE1 (F), and MATE2-K (G) compared with control cells, which were transfected with vector only. Data are represented as mean ± SD of quadruplicate.](/cms/asset/4631d7f6-4259-4346-8119-8c31057c4c01/ixen_a_1918361_f0002_b.jpg)
Inhibitory potential of enerisant on P-gp and BCRP
The inhibitory effects of enerisant at concentrations of 1 to 100 µM on [3H]digoxin transport across P-gp-MDCK and on [3H]prazosin transport across BCRP-MDCK were investigated. The efflux ratio of [3H]digoxin across P-gp-MDCK without enerisant was 9.35. Verapamil (100 μM) decreased the efflux ratio of [3H]digoxin across P-gp-MDCK to 1.78. In the presence of enerisant at 1 to 100 μΜ, the efflux ratio of [3H]digoxin across P-gp-MDCK was in the range of 8.43 to 11.1. The % of the control for the efflux ratio was 90.2% at the maximum concentration of enerisant, indicating that enerisant did not affect [3H]digoxin transport (). The efflux ratio of [3H]prazosin across BCRP-MDCK without enerisant was 7.66, and this value was decreased by Ko143 (1 μM) to 0.832. In the presence of enerisant at 1 to 100 μΜ, the efflux ratio of [3H]prazosin across BCRP-MDCK was in the range of 7.32 to 8.70. The % of the control for the efflux ratio was 97.9% at the maximum concentration of enerisant, indicating that enerisant did not affect [3H]prazosin transport ().
Table 7. IC50 values of enerisant for transporter activities in transporter-expressing cells.
Inhibitory potential of enerisant on OATP1B1, OATP1B3, OAT1, OAT3, OCT2, MATE1, and MATE2-K
The inhibitory effects of enerisant at concentrations of 1 to 100 µM on the uptake of probe substrates were investigated using OATP1B1-CHO, OATP1B3-CHO, OAT1-HEK, OAT3-HEK, OCT2-CHO, MATE1-HEK, MATE2-K-HEK, and the corresponding control cells. As a result, enerisant was found to inhibit the uptake of [3H]N-methyl-4-phenylpyridinium acetate in OCT2-CHO, [14C]tetraethylammonium bromide (TEA) in MATE1-HEK, and [14C]TEA in MATE2-K-HEK to over 50% of that in the control. These IC50 values were 2.21, 1.80, and 2.15 μM (). On the other hand, the uptake of the probe substrates for OATP1B1, OATP1B3, OAT1, and OAT3 was not affected by enerisant (). The control inhibitors were confirmed to be effective in all the experiments.
Phase 1 clinical study
The mean plasma concentration–time profiles and the PK parameters of enerisant after a single oral administration of 1 to 150 mg of enerisant are shown in and . Enerisant was rapidly absorbed, reaching the mean maximum plasma concentration (Cmax) of 4.29 to 835 ng/mL (0.0108–2.10 μM) within 2.00 h (median), and was eliminated with a half-life of approximately 8 h. The mean plasma concentration of enerisant had decreased to less than 2% of the Cmax as of 48 h after administration. The Cmax and the AUC of enerisant increased dose-dependently. The urinary excretion of enerisant within 48 h post-oral dosing was 64.5 to 89.9% of the dose, and the renal clearance was 12.5 to 18.0 L/h (). No deaths or serious or otherwise significant adverse events (AEs) occurred. Sixteen AEs were reported in 12 subjects (elevated white blood cell count, insomnia, feeling hot, salivary hypersecretion, night sweats, and headache), all of which were mild; all the subjects recovered within 3 days of the onset of these AEs. Therefore, a single administration of enerisant at a dose of up to 150 mg was considered tolerable.
Figure 3. Plasma enerisant concentration–time profiles after a single oral administration of enerisant to healthy male subjects. Data are represented as mean ± SD of six subjects.
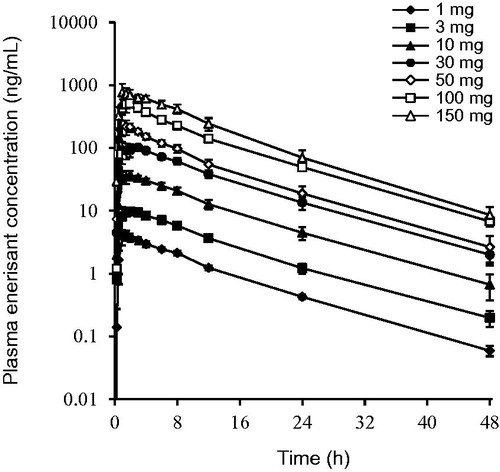
Table 8. Plasma pharmacokinetic parameters after a single oral administration of enerisant to healthy male subjects.
Table 9. Urinary excretion and renal clearance after a single oral administration of enerisant to healthy male subjects.
Discussion
In clinical practice, DDI can cause side effects when multiple drugs are used for treatment (Russel Citation2010, Scheen, Citation2014, PMDA Citation2018). Patients with narcolepsy should be cautious with regard to DDI, as they are likely to be taking multiple medications (Ohayon Citation2013, Barateau et al. Citation2016). DDI is caused by a variety of factors, the most common of which are known to be related to metabolism and transporters (Giacomini et al. Citation2010, Lai et al. Citation2010, Russel Citation2010, Hutzler et al. Citation2011). Since most metabolism-related DDI is associated with CYPs, we evaluated the inhibitory effect of enerisant on nine CYP isoforms according to DDI guidelines or guidance (EMA Citation2012, PMDA Citation2018, US Food and Drug Administration Citation2020). The IC50 values of enerisant were greater than 100 μM for all the CYP isoforms that were evaluated. The unbound Cmax in human plasma at 5 mg of enerisant (estimated clinical dose) was 0.0339 μM (13.5 ng/mL), calculated proportionally from the unbound Cmax of 10 mg of enerisant. Assuming the Ki is IC50/2 because the substrate concentration was around Km, the R values (1 + unbound Cmax of a drug/in vitro inhibition constant, Ki) for all the CYP isoforms that were evaluated were 1.00. These results suggest that enerisant is unlikely to inhibit these CYP isoforms in clinical practice. The induction potential of enerisant for the mRNA expression levels of CYP1A2, CYP2B6, and CYP3A4 was also examined. As a result, 20 μM of enerisant (more than 50 times the unbound Cmax of 5 mg enerisant) did not increase the mRNA levels of CYP1A2, CYP2B6, or CYP3A4 by 2-fold, and the increase in the mRNA levels was less than 20% of the value for the positive control, suggesting that enerisant is unlikely to induce these CYP isoforms. These results suggest that DDI does not occur when enerisant is used in combination with CYP substrate drugs. In a metabolic study of enerisant using recombinant human CYP isoforms, CYP2D6 and CYP3A4 decreased the concentration of enerisant by 5% or more and its metabolites were observed, indicating that these isoforms were involved in the metabolism of enerisant in humans (). However, enerisant was barely metabolized in humans, and up to 90% of the dose had been excreted as an unchanged form in the urine as of 48 h after administration. These results suggest that DDI does not occur when enerisant is used in combination with CYP inhibitors or inducers.
On the other hand, another H3 receptor antagonist, pitolisant, has the induction effects of CYP2B6 and CYP3A4. In addition, pitolisant is primarily metabolized by CYP2D6 and CYP3A4 in the liver in humans. The Cmax and AUC ratio of pitolisant increased by approximately 47% and 105%, respectively, after coadministration with paroxetine (CYP2D6 inhibitor), and decreased by approximately 39% and 50%, respectively, after coadministration with rifampicin (CYP3A4 inducer) (Bioprojet Pharma, Citation2016). Modafinil, which is used for the treatment of narcolepsy, has an inhibitory effect on CYP2C19 and induction effects on CYP1A2, CYP2B6, and CYP3A4 (Robertson et al. Citation2000). The AUC ratio of omeprazole (CYP2C19 substrate) increased by approximately 90% after coadministration with modafinil, and the AUC ratio of midazolam (CYP3A4 substrate) decreased by approximately 34% after coadministration with modafinil (Rowland et al. Citation2018). As enerisant may not produce CYP-mediated DDI, enerisant has an advantage over pitolisant and modafinil when it is used in combination with drugs that are metabolized by CYPs or interact with CYPs.
In addition to CYP-mediated DDIs, we evaluated the DDI potential of enerisant for the nine transporters according to DDI guidelines or guidance (EMA Citation2012, PMDA Citation2018, US Food and Drug Administration Citation2020). When the inhibitory effect of enerisant for the transporters was investigated, the IC50 values of enerisant for OCT2, MATE1, and MATE2-K were 2.21, 1.80, and 2.15 μM, respectively, while the IC50 values for all the other transporters were greater than 100 μM. Assuming the Ki is IC50 because the substrate concentration was sufficiently lower than Km, the R values for OCT2, MATE1, and MATE2-K were 1.02 when 5 mg of enerisant was dosed. These results suggest that DDI is unlikely to occur when 5 mg of enerisant is used in combination with OCT2 substrates, while the possibility of DDI during the coadministration of enerisant with MATE1 or MATE2-K substrates cannot be denied. Ranitidine, an H2 receptor antagonist, also has inhibitory effects on MATE1 with a Ki of 25.4 μM (Tsuda et al. Citation2009). The unbound Cmax at 150 mg of ranitidine is approximately 1.0 μM (Brunton et al. Citation2011), resulting in an R value of 1.04. However, the Cmax and AUC of metformin reportedly did not change when 150 mg of ranitidine was coadministered with 750 mg of metformin (Cho and Chung Citation2016). Following a previous report (Burt et al. Citation2016), the physiologically based PK model of enerisant was developed using a Simcyp simulator (Version 18, Certara) to simulate DDI when 5 mg of enerisant was combined with 250 mg of metformin, resulting in only a 1% increase in both the Cmax and AUC of metformin ( and ). Therefore, the Cmax and AUC of the MATE substrates are expected to show little or no change when enerisant is used in combination with MATE substrates, and the clinical risk of DDI is considered to be low.
We also examined the possibility of enerisant as a substrate for transporters. As a result, enerisant was found to be a substrate for P-gp, but not for the other transporters. P-gp is expressed in many organs, such as the small intestine, brain, liver, and kidney. The increased systemic exposure of P-gp substrates with a low-membrane permeability, such as digoxin, has been reported in situations where P-gp in intestinal epithelial cells is inhibited by a coadministered drug (Giacomini et al. Citation2010). However, because of the high absorption of enerisant in humans, no significant increase in plasma concentrations is expected to occur when it is used in combination with P-gp inhibitors.
Enerisant is mainly excreted into the urine as an unchanged form in humans, and renal clearance greatly exceeds the glomerular filtration rate, suggesting that tubular secretion is involved. The transporters expressed in proximal tubular epithelial cells play an important role in tubular secretion, with each transporter functioning in cooperation with each other to allow transport from the blood to renal cells and from renal cells to the urine. For example, OCT2 and MATE1/MATE2-K for metformin and OAT3 and P-gp for sitagliptin have been implicated in tubular secretion (Chu et al. Citation2007, Giacomini et al. Citation2010). For enerisant, P-gp is considered to be involved in the excretion from renal cells into the urine. Although OAT1, OAT3, and OCT2 are not involved in the uptake of enerisant from the blood to renal cells, preliminary studies in HEK293 cells suggest some involvement of transporters in the uptake of enerisant into renal cells, and further investigation of the renal excretion mechanism of enerisant will be necessary in the future. For P-gp-mediated DDI in the kidney, the combination of cimetidine, a P-gp substrate, and itraconazole, a P-gp inhibitor, has been reported to increase the AUC of cimetidine by 25% and to reduce the tubular secretory CL of cimetidine by 25% in humans (Karyekar et al. Citation2004). Thus, we cannot rule out the possibility of DDI when enerisant is combined with a P-gp inhibitor, but we expect any changes in the AUC and tubular secretory CL of enerisant to be relatively small. In addition, in the Phase 1 study, enerisant was well tolerated up to 150 mg, which is approximately 37 times higher than the 5 mg dose in the AUC. Therefore, if a DDI were to occur, there would be little or no risk of side effects.
Conclusions
Enerisant was rapidly absorbed in humans, and most of the administered drug was excreted in the urine as an unchanged form without undergoing metabolism. Enerisant had no inhibitory effect on nine CYP isoforms and no induction effect on three CYP isoforms. Enerisant was a substrate for P-gp, but not for eight other transporters. It also inhibited OCT2, MATE1, and MATE2-K, but not six other transporters. Based on the plasma concentrations at the estimated clinical dose, enerisant is unlikely to cause CYP-mediated, clinically relevant DDI. Although the possibility of transporter-mediated, clinically relevant DDI cannot be ruled out, we consider the risk of side effects to be minimal or absent.
Supplemental Material
Download Zip (73.2 KB)Disclosure statement
No potential conflict of interest was reported by the author(s).
Correction Statement
This article has been republished with minor changes. These changes do not impact the academic content of the article
References
- Arrang, J.M., Garbarg, M., and Schwartz, J.C., 1983. Auto-inhibition of brain histamine release mediated by a novel class (H3) of histamine receptor. Nature, 302, 832–837.
- Barateau, L., Lopez, R., and Dauvilliers, Y., 2016. Treatment options for narcolepsy. CNS drugs, 30 (5), 369–379.
- Bioprojet Pharma, 2016. Wakix (pitolisant): summary of product characteristics. Available from: https://www.ema.europa.eu/en/documents/product-information/wakix-epar-product-information_en.pdf [last accessed 23 Oct 2020]
- Bonaventure, P., et al., 2007. Histamine H3 receptor antagonists: from target identification to drug leads. Biochemical pharmacology, 73 (8), 1084–1096.
- Brunton, L.L., Chabner, B.A,, and Knollmann, B.C., 2011. Goodman and Gilman's the pharmacological basis of therapeutics. 12th edition. New York, NY: McGraw-Hill Education.
- Burt, H.J., et al., 2016. Metformin and cimetidine: physiologically based pharmacokinetic modelling to investigate transporter mediated drug–drug interactions. European journal of pharmaceutical sciences : official journal of the European federation for pharmaceutical sciences, 88, 70–82.
- Cho, S.K. and Chung, J.Y., 2016. The MATE1 rs2289669 polymorphism affects the renal clearance of metformin following ranitidine treatment. International journal of clinical pharmacology and therapeutics, 54 (4), 253–262.
- Chu, X.Y., et al., 2007. Transport of the dipeptidyl peptidase-4 inhibitor sitagliptin by human organic anion transporter 3, organic anion transporting polypeptide 4C1, and multidrug resistance P-glycoprotein. The journal of pharmacology and experimental therapeutics, 321 (2), 673–683.
- European Medicines Agency., 2012. Guideline on the investigation of drug interactions. Available from: https://www.ema.europa.eu/en/documents/scientific-guideline/guideline-investigation-drug-interactions-revision-1_en.pdf. [last accessed 23 Oct 2020]
- Giacomini, K.M., International Transporter Consortium. et al. (2010). Membrane transporters in drug development. Nature reviews. Drug discovery, 9 (3), 215–236.
- Hino, N., et al., 2020. A novel potent and selective histamine H3 receptor antagonist enerisant: in vitro profiles, in vivo receptor occupancy, and wake-promoting and procognitive effects in rodents. The journal of pharmacology and experimental therapeutics, 375 (2), 276–285.
- Huang, Z.L., et al., 2006. Altered sleep-wake characteristics and lack of arousal response to H3 receptor antagonist in histamine H1 receptor knockout mice. Proceedings of the national academy of sciences of the United States of America, 103 (12), 4687–4692.
- Hutzler, J.M., Cook, J., and Fleishaker, J.C., 2011. Drug–drug interactions: designing development programs and appropriate product labeling. In: Bonate, P.L., Howard, D.R., eds. Pharmacokinetics in drug development. New York: Springer, 21–56.
- Karyekar, C.S., et al., 2004. Renal interaction between itraconazole and cimetidine. The journal of clinical pharmacology, 44 (8), 919–927.
- Lai, Y., Sampson, K.E., and Stevens, J.C., 2010. Evaluation of drug transporter interactions in drug discovery and development. Combinatorial chemistry & high throughput screening, 13 (2), 112–134.
- Lamb, Y.N., 2020. Pitolisant: a review in narcolepsy with or without cataplexy. CNS Drugs, 34 (2), 207–218.
- Le, S., et al., 2008. Correlation between ex vivo receptor occupancy and wake-promoting activity of selective H3 receptor antagonists. The journal of pharmacology and experimental therapeutics, 325 (3), 902–909.
- Leurs, R., et al., 2011. En route to new blockbuster anti-histamines: surveying the offspring of the expanding histamine receptor family. Trends in pharmacological sciences, 32 (4), 250–257.
- Lin, J.S., 2000. Brain structures and mechanisms involved in the control of cortical activation and wakefulness, with emphasis on the posterior hypothalamus and histaminergic neurons. Sleep medicine reviews, 4 (5), 471–503.
- Lin, J.S., et al., 1996. Histaminergic descending inputs to the mesopontine tegmentum and their role in the control of cortical activation and wakefulness in the cat. The journal of neuroscience : the official journal of the society for neuroscience, 16 (4), 1523–1537.
- Madan, A., et al., 2003. Effects of prototypical microsomal enzyme inducers on cytochrome P450 expression in cultured human hepatocytes. Drug metabolism and disposition: the biological fate of chemicals, 31 (4), 421–431.
- Ohayon, M.M., 2013. Narcolepsy is complicated by high medical and psychiatric comorbidities: a comparison with the general population. Sleep medicine, 14 (6), 488–492.
- Paris, B.L., et al., 2009. In vitro inhibition and induction of human liver cytochrome p450 enzymes by milnacipran. Drug metabolism and disposition, 37, 2045–2054.
- Parmentier, R., et al., 2002. Anatomical, physiological, and pharmacological characteristics of histidine decarboxylase knock-out mice: evidence for the role of brain histamine in behavioral and sleep-wake control. The journal of neuroscience : the official journal of the society for neuroscience, 22 (17), 7695–7711.
- Parmentier, R., et al., 2007. The brain H3-receptor as a novel therapeutic target for vigilance and sleep-wake disorders. Biochemical pharmacology, 73 (8), 1157–1171.
- Parmentier, R., et al., 2016. Role of histamine H1-receptor on behavioral states and wake maintenance during deficiency of a brain activating system: a study using a knockout mouse model. Neuropharmacology, 106, 20–34.
- PMDA, 2018. Guideline on drug interaction for drug development and appropriate provision of information. Available from: https://www.pmda.go.jp/files/000225191.pdf [Japanese] [last accessed 23 Oct 2020].
- Robertson, P., et al., 2000. In vitro inhibition and induction of human hepatic cytochrome P450 enzymes by modafinil. Drug metabolism and disposition: the biological fate of chemicals, 28 (6), 664–671.
- Rowland, A., et al., 2018. Evaluation of modafinil as a perpetrator of metabolic drug-drug interactions using a model informed cocktail reaction phenotyping trial protocol. British journal of clinical pharmacology, 84 (3), 501–509.
- Russel, F.G.M., 2010. Enzyme- and transporter-based drug–drug interactions: progress and future challenges. In: Pang, K.S., Rodrigues, A.D., Peter, R.M., eds. Transporters: importance in drug absorption, distribution, and removal. New York: Springer, 27–49.
- Scheen, A.J., 2014. Drug-drug interactions with sodium-glucose cotransporters type 2 (SGLT2) inhibitors, new oral glucose-lowering agents for the management of type 2 diabetes mellitus. Clinical pharmacokinetics, 53 (4), 295–304.
- Tsuda, M., et al., 2009. Involvement of human multidrug and toxin extrusion 1 in the drug interaction between cimetidine and metformin in renal epithelial cells. The journal of pharmacology and experimental therapeutics, 329 (1), 185–191.
- US Food and Drug Administration, 2020. Guidance for industry. In vitro drug interaction studies – cytochrome P450 enzyme- and transporter-mediated drug interactions. Available from: https://www.fda.gov/media/134582/download [last accessed 23 Oct 2020].