
 ?Mathematical formulae have been encoded as MathML and are displayed in this HTML version using MathJax in order to improve their display. Uncheck the box to turn MathJax off. This feature requires Javascript. Click on a formula to zoom.
Abstract
Emvododstat was identified as a potent inhibitor of dihydroorotate dehydrogenase and is now in clinical development for the treatment of acute myeloid leukaemia and COVID-19. The objective of this paper is to evaluate the metabolism, pharmacokinetics, and drug interaction potentials of emvododstat.
Emvododstat showed high binding to plasma protein with minimal distribution into blood cells in mouse, rat, dog, monkey, and human whole blood.
O-Demethylation followed by glucuronidation appeared to be the major metabolic pathway in rat, dog, monkey, and human hepatocytes. CYP2C8, 2C19, 2D6, and 3A4 were involved in O-desmethyl emvododstat metabolite formation. Both emvododstat and O-desmethyl emvododstat inhibited CYP2D6 activity and induced CYP expression to different extents in vitro.
Emvododstat and O-desmethyl emvododstat inhibited BCRP transporter activity but did not inhibit bile salt transporters and other efflux or uptake transporters. Neither emvododstat nor O-desmethyl emvododstat was a substrate for common efflux or uptake transporters investigated.
Emvododstat is bioavailable in mice, rats, dogs, and monkeys following a single oral dose. The absorption was generally slow with the mean plasma Tmax ranging from 2 to 5 h; plasma exposure of O-desmethyl emvododstat was lower in rodents, but relatively higher in dogs and monkeys.
Introduction
Emvododstat, also known as PTC299 (), is an orally bioavailable small molecule that was originally identified as an inhibitor of vascular endothelial growth factor A (VEGFA) (Cao et al. Citation2016). Emvododstat was developed as an oncology therapy for the treatment of solid tumours and entered clinical development in 2006 (Packer et al. Citation2015, Ignacio et al. Citation2016, Weetall et al. Citation2016).
Figure 1. Structures of emvododstat, O-desmethyl emvododstat, O-desmethyl emvododstat glucuronide, emvododstat-D3 and O-desmethyl emvododstat-D4.
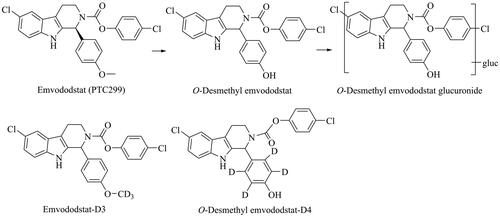
It was later demonstrated that the mechanism of action of emvododstat is due to its direct and potent inhibition of the dihydroorotate dehydrogenase (DHODH) enzyme, a rate-limiting enzyme in de novo pyrimidine nucleotide synthesis. Inhibition of VEGFA production by emvododstat is a downstream effect of inhibiting de novo pyrimidine synthesis as it can be completely rescued by exogenously added uridine (Cao et al. Citation2019). Subsequent studies using cell lines of a broad array of solid tumour and haematologic malignancies indicated that emvododstat is more potent against leukaemic malignancies, including acute myeloid leukaemia (AML), than against solid tumours. In the most recent work, emvododstat has shown broad-spectrum antiviral activity and particularly potently inhibited viral replication and suppressed induction of inflammatory cytokines in SARS-CoV-2 cell-based assays (Luban et al. Citation2021). Thus, emvododstat has the potential to address unmet needs in certain cancers and RNA viral infections where the cancer cells or viruses rely on the de novo biosynthesis of pyrimidine nucleotides for survival or rapid proliferation. Currently emvododstat is under clinical development for the treatment of AML and COVID-19 (coronavirus SARS-CoV-2).
In support of emvododstat clinical development, extensive in vitro and in vivo studies have been conducted to characterise the absorption, distribution, metabolism, excretion, and pharmacokinetic (PK) drug interaction properties of emvododstat. In this manuscript, we report emvododstat drug metabolism and pharmacokinetic (DMPK) properties including plasma protein binding, blood-to-plasma partitioning, metabolite profiles in hepatocytes, cytochrome P450 (CYP) reaction phenotyping and enzyme kinetics, CYP inhibition and induction, transporter interaction potential, and PK in mice, rats, dogs, and monkeys.
Materials and methods
Materials
Emvododstat (>99% purity) and O-desmethyl emvododstat (>97% purity) were synthesised by Siegfried AG (Zofingen, Switzerland); 14C-emvododstat (50.3 mCi/mmol, radiochemical purity >99% and chemical purity >98%) was synthesised by ABC Laboratories (Columbia, MO, USA); 14C-O-desmethyl emvododstat (57 mCi/mmol, radiochemical purity and chemical purity >99%) was prepared by Pharmaron (Cardiff, UK); Radiolabelled substrates: 3H-cholecystokinine-8, 3H-dehydroepiandrosterone, 3H-estradiol 17β-D-glucuronide and 3H-taurocholic acid were obtained from Perkin Elmer (Waltham, MA, USA); 3H-estrone-3-sulfateas was purchased from Radiolab (Szeged, Hungary); 3H-N-methyl-quinidine was provided by SOLVO Biotechnology (Szeged, Hungary); 14C-metformin and 3H-tenofovir were obtained from Moravek Biochemicals (Brea, CA, USA). Mouse, rat, dog, monkey, and human plasma were purchased from Biochemed Services (Winchester, VA, USA); whole blood from same species was obtained from Covance Laboratories, Inc. (Madison, WI, USA) and Harlan Bioproducts for Science, Inc. (Madison, WI, USA); recombinant human CYPs were purchased from BD Biosciences (Woburn, MA, USA) and Cypex Ltd. (Dundee, Scotland, UK); human liver microsomes (HLM) were obtained from BiolVT, LLC (Baltimore, MD, USA) and Sekisui XenoTech, LLC (Kansas City, KS, USA); rat, dog, monkey, and human hepatocytes were obtained from CellzDirect, Inc. (Tucson, AZ, USA) and Sekisui XenoTech, LLC (Kansas City, KS, USA). Inside-out membrane vesicles overexpressing human adenosine triphosphate (ATP)-binding cassette transporters: breast cancer resistance protein (BCRP), multidrug resistance protein 1 (MDR1), bile salt export pump (BSEP), and multidrug resistance-associated proteins 2, 3 and 4 (MRP2, MRP3, and MRP4); Madin-Darby canine kidney strain II (MDCKII) or human embryonic kidney 293 (HEK293) cells stably expressing the respective uptake transporters: sodium (Na+) taurocholate co-transporting polypeptide (NTCP); multidrug and toxin extrusion (MATE) transporters, MATE1 and MATE2-K; organic anion transporters (OAT), OAT1 and OAT3; organic anion-transporting polypeptide (OATP) transporters, OATP1B1 and OATP1B3; organic cation transporters (OCT), OCT1 and OCT2; and BCRP and MDR1 transfected MDCKII cells were provided by SOLVO Biotechnology (Szeged, Hungary).
Methods
Plasma protein binding and blood-to-plasma partitioning
The protein binding was determined by ultrafiltration method. 14C-Emvododstat at final concentrations of 0.05, 0.5, 5, and 50 μg/mL in dimethyl sulfoxide (DMSO, ≤1% final, v/v), was incubated in triplicate with pooled (n ≥ 3) plasma from male CD-1 mice, male Sprague Dawley rats, male beagle dogs, male cynomolgus monkeys, and male and female humans. 14C-Emvododstat, 10 μL in DMSO was mixed well with 1 mL of blank plasma. After 15 minutes (min) incubation at 37 °C, 0.3 mL each of plasma samples were added to wells of the MultiScreen filter plate with Ultracel-PPB membrane (Millipore Corporation, Bedford, MA, USA) with a molecular weight cut-off of 10,000 Da. The ultrafiltration plate was centrifuged at 37 °C and 2,000 g for 45 to 60 min. The ultrafiltrate was weighed and analysed for radioactivity using liquid scintillation counting (LSC).
For blood-to-plasma partition ratio determinations, 14C-emvododstat at final concentrations of 0.05, 0.5, 5, and 50 μg/mL in DMSO (≤1% final, v/v) was incubated in duplicate with pooled (n ≥ 3) whole blood from male CD-1 mice, male Sprague Dawley rats, male beagle dogs, and male cynomolgus monkeys, and with whole blood from male (n = 3) and female (n = 3) human volunteers. 14C-Emvododstat, 10 μL in DMSO was mixed well with 1 mL of whole blood. After 30 min incubation at 37 °C, triplicate samples of blood were removed, oxidised, and analysed by LSC. The remaining blood was centrifuged to obtain plasma. Duplicate samples of plasma were analysed by LSC.
Biotransformation in hepatocytes
The metabolism of emvododstat was assessed in vitro using fresh rat, dog, monkey, and human hepatocytes. 14C-Emvododstat, at 2 and 20 µM in DMSO (1% final, v/v), was incubated in triplicate with hepatocytes (1 × 10⁶ cells) at 37 °C in an atmosphere of 95:5 air:CO2. For each incubation, 10 μL of 14C-emvododstat in DMSO was mixed well with 1 mL of hepatocytes suspension in William’s E medium. After 0, 60, 120, and 240 min incubation, the hepatocyte incubations were terminated by addition of 2 mL methanol, followed by vortex mixing. Protein was removed by centrifugation at 1,400 x g for 10 minutes at approximately 4 °C. The supernatants were analysed for 14C-emvododstat and metabolites by liquid chromatography-tandem mass spectrometry (LC-MS/MS) with radiochemical detection. The LC-MS/MS system consisted of Shimadzu LC-10AD VP pumps and a Shimadzu SIL-HTC autosampler (Shimadzu America, Inc., Columbia, MD, USA) coupled with a 4000 QTrap mass spectrometer (AB Sciex, LLC, Framingham, MA, USA). A Zorbax SB-C18 (150 × 4.6 mm, 3.5 μm) column (Agilent, Santa Clara, CA, USA) maintained at 40 °C was used. The mobile phase A was 1% acetic acid in water and the mobile phase B was 1% acetic acid in acetonitrile. The flow rate was 1 mL/min. The linear gradients were 5% to 100% B in 15 min and hold 100% B for 10 min; and 100% to 5% B in 1 min and maintained at 5% B for 5 min. For the mass spectrometer, the turbo spray was operated in positive ionisation mode; the source temperature was 450 °C. The curtain gas, nebuliser gas, and turbo gas were at 30 psi, 40 psi, and 40 psi, respectively.
Further metabolism of O-desmethyl emvododstat was evaluated in human hepatocytes. 14C-O-desmethyl emvododstat, at 5 µM in DMSO (0.1% final, v/v), was incubated in duplicate with pooled human (mixed gender) hepatocytes (1 × 10⁶ cells/mL) at 37 °C in an atmosphere of 95:5 air:CO2 with 95% humidity. For each incubation, 2 μL of 14C-O-desmethyl emvododstat in DMSO was mixed well with 2 mL of hepatocyte suspension in William’s E medium. After 0, 120, and 240 min incubation, duplicate 0.25 mL of hepatocyte incubations were terminated by addition of 0.5 mL of acetonitrile. The samples were centrifuged (920 × g for 10 min at 10 °C) and the supernatants were analysed for 14C-O-desmethyl emvododstat and metabolites by LC-MS/MS with radiochemical detection. The LC-MS/MS method was the same as the above except that the LC system consisted of Shimadzu LC-30AD pumps and a Shimadzu SIL-30AC autosampler (Shimadzu America, Inc., Columbia, MD, USA). An Atlantis T3 (150 × 2.1 mm, 3 μm) column (Waters Corporation, Milford, MA, USA) was used. The mobile phase A was 0.2% formic acid in water and the mobile phase B was 0.2% formic acid in acetonitrile. The flow rate was 0.6 mL/min. The linear gradients were kept 15% B for 2 min; 15% to 50% B in 10 min; 50% to 65% B in 11 min; 65% to 95% B in 3 min and hold at 95% B for 2 min; and 95% to 15% B in 1 min and maintained at 15% B for 2 min. The mass spectrometer was operated in negative ionisation mode.
CYP reaction phenotyping and enzyme kinetics
CYP reaction phenotyping for O-desmethyl emvododstat formation was evaluated using recombinant human CYP enzymes and HLM in the presence of specific chemical inhibitors. Emvododstat at 1 µM in DMSO (0.1% final, v/v) in duplicate was incubated with a panel of recombinant human CYP enzymes (Bactosomes from BD Biosciences, 1A2, 2B6, 2C8, 2C9, 2C19, 2D6, and 3A4, 50 pmol CYP/mL, final concentration) at 37 °C for 0 and 60 min, or with HLM (1 mg protein/mL, final concentration) at 37 °C for 120 min in the presence of the chemical inhibitors (10 μM furafylline for CYP1A2, 10 μM letrozole for CYP2A6, 30 μM phencyclidine for CYP2B6, 100 μM gemfibrozil glucuronide for CYP2C8, 20 μM tienilic acid for CYP2C9, 10 μM esomeprazole for CYP2C19, 10 μM quinidine and 5 μM paroxetine for CYP2D6, 10 μM diethyldithiocarbamate for CYP2E1, 1 μM ketoconazole and 50 μM troleandomycin for CYP3A4, all final concentrations). For each incubation, 0.6 µL of emvododstat stock solution (1 mM in DMSO) was added in 0.3 mL of supersomal suspension (100 pmole/mL) or 0.3 mL of HLM (2 mg protein/mL), the reactions were initiated by the addition of 0.3 mL of the nicotinamide adenine dinucleotide phosphate, reduced form (NADPH)-regenerating system (1 mM NADP, 5 mM glucose-6-phorsphate, and 1 unit/mL glucose-6-phosphate dehydrogenase, final concentrations) and stopped by the addition of 1.2 mL acetonitrile. The samples were centrifuged (920 g for 10 min at 10 °C), and the supernatant fractions were analysed by LC-MS/MS to monitor the amount of unchanged emvododstat and the amount of O-desmethyl emvododstat formed. The LC-MS/MS method was essentially the same as in the above section (O-desmethyl emvododstat metabolism in human hepatocytes) except that an Atlantis T3 (100 × 2.1 mm, 5 μm) column (Waters Corporation, Milford, MA, USA) was used. The flow rate was 0.8 mL/min. The linear gradients were 55% B for 0.2 min; 55% to 95% B in 2.8 min and 95% B for 0.5 min; and 95% to 55% B in 0.1 min and maintained at 55% B for 0.6 min. The mass spectrometer was operated in negative ionisation mode; ion transitions monitored were at m/z 465 → m/z 127 for emvododstat and m/z 451 → m/z 323 for O-desmethyl emvododstat, respectively.
Enzyme kinetics for O-desmethyl emvododstat formation in recombinant human CYP enzymes and in HLM were estimated. Emvododstat at 0.1, 0.5, 1, 2.5, 5, 10, 50, and 100 µM in DMSO (0.1% final, v/v) was incubated in triplicate with recombinant human CYPs 2C8 (10 pmol/mL CYP), 3A4 (10 pmol/mL CYP), 2C19 (5 pmol/mL CYP), or HLM (0.1 mg protein/mL) at 37 °C for 10 min. For each incubation, 0.7 µL of emvododstat stock solution (0.1 to 100 mM in DMSO) was added in 0.35 mL of supersomal suspension (10 to 20 pmole/mL) or 0.35 mL of HLM (0.2 mg protein/mL). The reactions were initiated by addition of the NADPH-regenerating system (1.3 mM NADP, 3.3 mM glucose-6-phorsphate, and 1 unit/mL glucose-6-phosphate dehydrogenase, final concentrations) and stopped by the addition of 1.4 mL acetonitrile. After plate filtration, the supernatant fractions were analysed by LC-MS/MS to monitor the amount of O-desmethyl emvododstat formed. The LC-MS/MS system consisted of an Accela pump and a PAL autosampler equipped to a TSQ Quantum Ultra mass spectrometer (Thermo Fisher Scientific, Inc., Waltham, MA, USA). A Waters ACQUITY BEH column (C18, 1.7 µm, 50 × 2.1 mm, Waters Corporation, Milford, MA, USA) was used and maintained at 60 °C. The mobile phases were 100 mM ammonium acetate in water (mobile phase A) and acetonitrile (mobile phase B). The flow rate was 0.6 mL/min and the gradient programme was linear gradient from 0% B to 95% B in 0.2 min and hold at 95% B for 1.6 min; and linear gradient from 95% B to 0% B in 0.2 min and hold at 0% B for 1 min. The mass spectrometer was equipped with a heated electrospray ionisation source operated in negative ionisation mode with a vaporiser temperature of 350 °C, capillary temperature of 380 °C and spray voltage of 3 kV. The sheath, auxiliary, and sweep gas pressures were 40, 30, and 3 units, respectively. Ion transition monitored for O-desmethyl emvododstat was m/z 451 → m/z 323. Kinetic parameters for O-desmethyl emvododstat formation were determined by nonlinear regression with GraphPad Prism 5 (version 5.04, GraphPad Software, Inc., San Diego, CA, USA) using the Michaelis-Menten equation or substrate inhibition equation:
where, V, Vmax, [S], Km, and Ki are enzyme reaction velocity, the maximum enzyme reaction velocity, substrate concentration, substrate concentration needed to achieve a half-maximum enzyme reaction velocity and the dissociation constant for substrate binding, respectively. The intrinsic clearance (CLin) for metabolite formation was calculated as CLint = Vmax/Km.
CYP inhibition
CYP inhibition potential of emvododstat and O-desmethyl emvododstat was evaluated using pooled HLM. Emvododstat at 0, 0.01, 0.1, 1, 5, 10, 50, and 100 µM in DMSO (0.1% final, v/v) was incubated in duplicate with HLM (0.05 mg/mL protein concentration) in potassium phosphate buffer (0.1 M, pH 7.4) in the presence of respective CYP marker substrates with and without preincubation in the presence and absence of NADPH for 30 min at 37 °C. O-desmethyl emvododstat at 0, 0.01, 0.03, 0.1, 0.3, 1, 3, and 10 µM in DMSO (0.1% final, v/v) was incubated in duplicate with CYP probe substrates in pooled HLM (0.1 mg/mL protein concentration except for 0.0125 for CYP2C8 and 0.05 for CYP3A4 using midazolam as substrate) with and without preincubation in the presence of NADPH for 30 min at 37 °C. For the direct inhibition, 0.6 µL of emvododstat or O-desmethyl emvododstat stock solution in DMSO was added in 0.3 mL of HLM (0.025 to 0.2 mg protein/mL). The reactions were initiated by adding 0.3 mL of the substrate and NADPH-regenerating system (1.3 mM NADP, 3.3 mM glucose-6-phorsphate, and 1 unit/mL glucose-6-phosphate dehydrogenase, final concentrations) with no preincubation and incubating at 37 °C for 5 min. For the metabolism-dependent inhibition, emvododstat was incubated with HLM (the same protein concentration as for direct inhibition) in the presence of NADPH at 37 °C for 30 min. After the preincubation, the substrate/NADPH solution was added, and the mixture was incubated at 37 °C for an additional 5 min. The reaction was stopped by the addition of equal volume of acetonitrile, followed by membrane plate filtration. The filtrates were used for LC-MS/MS analysis. For Ki determination of CYP2D6 inhibition, emvododstat at 0, 0.01, 0.1, 1, 5, 10 and 50 nM was incubated in duplicate with HLM (0.05 mg/mL protein concentration) in the presence of dextromethorphan at 1, 5, 10, 50, and 100 µM. For each incubation, 0.6 µL of emvododstat stock solution in DMSO and 0.6 µL of dextromethorphan stock solution in water were added in 0.3 mL of HLM (0.1 mg protein/mL). The reactions were initiated by addition of 0.3 mL NADPH-regenerating system (1.3 mM NADP, 3.3 mM glucose-6-phorsphate, and 1 unit/mL glucose-6-phosphate dehydrogenase, final concentrations). After 5 min incubation at 37 °C, the reaction was stopped by adding an equal volume of acetonitrile, followed by membrane plate filtration. The filtrates were used for LC-MS/MS analysis. The CYP marker substrates, metabolites, chemical inhibitors, and the LC-MS/MS methods were the same as in the reference for emvododstat and O-desmethyl emvododstat, respectively (Kong et al. Citation2020) and (Paris et al. Citation2009). IC50 values were determined by nonlinear regression with GraphPad Prism 5 (version 5.04) using the following variable slope model:
where, [I] is the inhibitor concentration, slope describes the steepness of the curve.
Ki values for CYP inhibition were determined by nonlinear regression with GraphPad Prism 5 (version 5.04) using best fit model (competitive, non-competitive, uncompetitive, or mixed).
CYP induction
The CYP induction potential of emvododstat and O-desmethyl emvododstat was evaluated using cultured human hepatocytes from three different donors in modified Eagle's medium. The cultured human hepatocytes (0.1 mL at 5 × 10⁵ cells/mL) were treated once daily for three consecutive days with 5:95 v/v DMSO:acetonitrile (2% final v/v, vehicle control), flumazenil (25 µM, negative control), one of eight concentrations of emvododstat (0.1, 0.25, 1, 2.5, 5, 10, 25, and 50 µM), one of 11 concentrations of O-desmethyl emvododstat (0.1, 0.25, 0.5, 1, 1.5, 2.5, 5, 10, 15, 25, and 50 µM), or one of three known human CYP enzyme inducers, namely, omeprazole (50 µM), phenobarbital (750 µM), and rifampin (20 µM). After treatment, the cells were incubated (5 × 10⁵ cells/mL) in situ with marker substrates for the LC-MS/MS analysis of CYP1A2 (phenacetin O-dealkylation), CYP2B6 (bupropion hydroxylation), and CYP3A4 (midazolam 1′-hydroxylation) activity as previously reported (Paris et al. Citation2009). Following the in situ incubation, total RNA was isolated with a MagMAX-96 for Microarrays Kit on the KingFisher Flex (Thermo Fisher Scientific, Inc., Waltham, MA, USA). Single-stranded cDNA was prepared from RNA with the RT Master Mix using the AB 7900HT Fast Real Time PCR System thermocycling programme (Applied Biosystems, Foster City, CA, USA). PCR data were processed using a laboratory information management system (LIMS) (Thermo Fisher Scientific, Inc.) and the Sequence Detection System Software version 2.4 for Relative Quantification (Applied Biosystems). When the data allowed, EC50 and Emax were calculated using SigmaPlot 12.5 (Systat Software, Inc., San Jose, CA, USA) based on the following Sigmoid 3-parameter equation:
where, [I] is the inducer concentration, slope is the steepness of the curve, Emax is the maximal fold induction, and EC50 is the concentration of inducer associated with half-maximal induction.
Transporter inhibition assays
Inhibitory potentials of emvododstat and O-desmethyl emvododstat towards human efflux transporters and human uptake transporters were evaluated. Vesicular transport assays were performed with inside-out membrane vesicles prepared from HEK293 cells overexpressing human efflux transporters BCRP, MDR1, BSEP, MRP2, MRP3, and MRP4. Uptake experiments were performed using Chinese hamster ovary, MDCKII, or HEK293 cells stably expressing the respective uptake transporters comprising NTCP, MATE1, MATE2-K, OAT1, OAT3, OATP1B1, OATP1B3, OCT1 and OCT2. Bidirectional permeability was assessed using human colon adenocarcinoma (Caco-2) cells and BCRP- or MDR1-transfected MDCKII cell monolayers.
The highest soluble concentrations tested were 4.6 and 7.6 µM for BSEP (3H-taurocholic acid as substrate), 5.3 and 6.6 µM for MRP2 (3H-estradiol 17β-D-glucuronide as substrate), 5.3 and 7.6 µM for MRP3 (3H-estradiol 17β-D-glucuronide as substrate) and MRP4 (3H-dehydroepiandrosterone sulphate as substrate), and 6.0 and 10.5 µM for NTCP (3H-taurocholic acid as substrate) transporter for emvododstat and O-desmethyl emvododstat, respectively, 12 µM for BCRP (3H-estrone-3-sulfateas substrate) and MDR1 (3H-N-methyl-quinidine as substrate) and 5 µM for MATE1 and MATE2-K (14C-metformin as substrate), OAT1 (3H-tenofovir as substrate), OAT3 (3H-estrone-3-sulfate as substrate), OCT1 and OCT3 (14C-metformin as substrate), OATP1B1 (3H-estradiol 17β-D-glucuronide as substrate) and OATP1B3 (3H-cholecystokinine-8 as substrate) transporters for both emvododstat and O-desmethyl emvododstat. For vesicular transport assays, emvododstat and O-desmethyl emvododstat in DMSO (1% final volume), were separately incubated with membrane vesicle preparations and the respective probe substrate in the presence of 4 mM ATP or adenosine monophosphate (AMP). Reaction mixtures were preincubated for 15 minutes at 37 ± 1 °C (32 ± 1 °C for BCRP and MDR1) (75 µL final volume). Reactions were initiated by the addition of 25 µL of 12 µM ATP or AMP and quenched by the addition of 200 µL of ice-cold washing buffer and immediate filtration via glass fibre filters mounted to a 96-well plate (filter plate). The filters were washed with ice-cold washing buffer and vacuum dried, and the amount of substrate inside the filtered vesicles was determined by LSC. For uptake assays, cells (1 × 10⁵ cells/well) were cultured at 37 ± 1 °C in an atmosphere of 95:5 air:CO2 and were plated onto standard 96-well tissue culture plates. Before the experiment, the medium was removed, and the cells were washed twice with Krebs-Henseleit (KH) or Hank’s Balanced Salt Solution (HBSS) buffer at pH 7.4. Uptake experiments were carried out at 37 ± 1 °C in KH or HBSS buffer containing the probe substrate and the test compound or DMSO as solvent control (50 µL final volume). After the experiment, cells were washed twice with 100 µL ice-cold buffer and lysed. Radiolabelled probe substrate transport was determined by LSC. IC50 values were derived from a four-parametric logistic equation (log(inhibitor) vs. response – variable slope) using GraphPad Prism 8.1.1 (GraphPad Software Inc., San Diego, CA).
Transporter substrate assays
Substrate potentials of emvododstat and O-desmethyl emvododstat for human efflux transporters and human uptake transporters were evaluated. Uptake experiments were performed using MDCKII or HEK293 cells stably expressing the respective uptake transporters: MATE1, MATE2-K, OAT1, OAT3, OATP1B1, OATP1B3, OCT1, and OCT2. Bidirectional permeability was assessed using Caco-2 cells and BCRP- or MDR1-transfected MDCKII cell monolayers.
For uptake assays, cells were plated onto standard 24-well tissue culture plates at the density 5 × 10⁵ cells/well and cultured at 37 ± 1 °C in an atmosphere of 95:5 air:CO2. Before the experiment, the medium was removed, and the cells were washed with the respective buffer. Cellular uptake was initiated by adding appropriate buffer (KH for MATE1 and MATE2-K, and HBSS for the others) containing test compound at four concentrations (0.5, 2, 5 and 20 µM) and incubated at 37 ± 1 °C for 10 min (300 µL final volume). Reactions were quenched by removing the buffer containing the test compound and the cells were washed twice with 300 µL of ice-cold buffer. Cells were lysed with 300 μL of methanol:water (2:1) and the amount of emvododstat or O-desmethyl emvododstat in the cell lysate was determined by LC-MS/MS methods.
For monolayer assays, Caco-2-, BCRP-, or MDR1-transfected MDCKII cells were cultured in Dulbecco’s modified Eagle’s medium with 4.5 g/L glucose supplemented with 10% (v/v) foetal bovine serum at 37 ± 1 °C in an atmosphere of 95:5 air:CO2 prior to seeding into collagen pre-coated 24-transwell inserts. Caco-2 (5 × 10⁴ cells/well) or MDCKII cells (1.5 × 10⁵ cells/well) were cultured on the inserts with 400 µL medium per well on the apical side, and 25 mL in a single-well receiver tray for all 24 wells on the basolateral side. Trans-epithelial electric resistance of each well was measured to confirm confluency of the monolayers after the experiments (values above 120 Ωcm2/plate were accepted). Permeability incubations were carried out in HBSS buffer at 37 ± 1 °C. Cells were preincubated in assay buffer for 20 min. Assay buffer containing emvododstat or O-desmethyl emvododstat at four concentrations (0.5, 2, 5, and 20 µM) was then added to the appropriate apical (400 µL) or basolateral chamber (800 µL). The final concentration of DMSO in the incubations did not exceed 0.5% (v/v). Aliquots were taken from the receiver chambers after incubation and from the donor chambers before and after incubation. Emvododstat and O-desmethyl emvododstat concentrations were analysed by LC-MS/MS. The LC-MS/MS system consisted of Thermo Vanquish Flex ultrahigh performance liquid chromatography (UPLC) coupled with a Q-Exactive Focus mass spectrometer (Thermo Fisher Scientific, Inc., Waltham, MA, USA). A Zorbax Eclipse Plus C18 (50 × 2.1 mm, 1.8 μm) column (Agilent, Santa Clara, CA, USA) maintained at 40 °C was used. The mobile phase A was 0.1% formic acid in water and the mobile phase B was 0.1% formic acid in acetonitrile. The flow rate was 0.5 mL/min. The linear gradients were 60% to 95% B in 0.2 min and hold 95% B for 1.7 min; and 95% to 60% B in 0.1 min and maintained at 60% B for 0.5 min. For the mass spectrometer, the heated electrospray spray was operated in negative ionisation mode; the ion transitions monitored were at m/z 465.074 → m/z 126.993 for emvododstat and m/z 451.058 → m/z 323.056 for O-desmethyl emvododstat.
Pharmacokinetic studies in laboratory animals
Study protocols and procedures employed were ethically reviewed and approved by PTC Therapeutics, Inc. All animal facilities used were fully accredited by the Association for Assessment and Accreditation of Laboratory Animal Care International, and all animal studies were conducted after approval by the Institutional Animal Care and Use Committee and were in compliance with the US National Research Council's Guide for the Care and Use of Laboratory Animals, the US Public Health Service's Policy on Humane Care and Use of Laboratory Animals, and Guide for the Care and Use of Laboratory Animals.
Pharmacokinetic study in nude mice following an oral dose
Thirty-six male NCr nu/nu (CrTac:NCr-Foxn1nu) mice (Taconic, Germantown, NY, USA), approximately 7 weeks old and weighing 28 ± 1.9 g (mean ± SD), were not fasted during the study. Each animal was administered an oral gavage dose of emvododstat at 10 mg/kg that was expected to achieve the exposure associated with pharmacological effect. Emvododstat was formulated at 2.7 mg/mL in a proprietary lipid-based formulation. At 0, 0.5, 1, 2, 4, 8, 12, 16, 24, and 32 hours (h) post-dose, mice (n = 4/timepoint) were sacrificed by CO2 and blood samples were collected by cardiac puncture into tubes containing K2EDTA as the anticoagulant. The collected blood samples were gently inverted several times and centrifugated to collect plasma samples. For sample preparation, 50 μL of the plasma sample was mixed with 150 μL of the internal standard (emvododstat-D3 at 1 μg/mL) in acetonitrile followed by plate filtration to remove the precipitated proteins. The filtrate was used for LC-MS/MS analysis. The LC-MS/MS system consisted of ACQUITY UPLC hyphenated to a Micromass mass spectrometer (Waters Corporation, Milford, MA, USA). An ACQUITY BEH C18, 1.7 μm, 2.1 × 50 mm column and two mobile phases, 0.1% formic acid with 5 mM ammonium acetate in water (A) and 0.1% formic acid in acetonitrile (B) were used. The flow rate was 0.6 mL/min and the gradient was linear gradient from 5% B to 95% B in 0.5 min and return from 95% B to 5% B in 0.5 min. The mass spectrometer was equipped with an electrospray ionisation source operated in negative ion mode. The ion transitions monitored were m/z 464.8→ m/z 126.8 and m/z 467.8→ m/z 126.8 for emvododstat and emvododstat-D3, respectively.
Pharmacokinetic study in rats following a single IV or oral dose
Six fasted male Sprague Dawley rats, body weights of 263 to 274 g, were used. Three animals were individually administered an intravenous (IV) bolus dose of 0.5 mg/kg emvododstat or oral gavage dose of 3 mg/kg emvododstat. The objective of this study was to characterise the fundamental pharmacokinetic parameters of emvododstat in rat, therefore a combination of these two doses via IV and PO was selected to ensure that absorption, distribution, metabolism, and execration after these doses were linear. Emvododstat was formulated at 0.5 mg/mL in a proprietary aqueous based formulation for IV doing and at 3.0 mg/mL in a proprietary lipid-based formulation for oral dosing. At 0, 0.033 (IV dose only), 0.083 (IV dose only), 0.25 (IV dose only), 0.5, 1, 2, 3, 5 (oral dose only), 8, 12 (oral dose only), 24, 48, and 72 (oral dose only) h post-dose, approximately 0.2 mL of blood samples were collected via jugular vein into tubes containing K2EDTA as the anticoagulant. Plasma samples were prepared by centrifugation at 3000 g for 10 min at 2 to 8° C. For sample analysis, a 30 μL aliquot of plasma sample was mixed well with 300 μL of acetonitrile containing emvododstat-D3 (100 ng/mL) and O-desmethyl emvododstat-D4 (100 ng/mL) in a protein precipitation plate. After centrifugation, the supernatants were used for LC-MS/MS analysis. The LC-MS/MS system consisted of ACQUITY UPLC (Waters Corporation, Milford, MA, USA) hyphenated to an API 4000 mass spectrometer (AB Sciex, LLC, Framingham, MA, USA). An ACQUITY BEH C4, 1.7 μm, 2.1 × 50 mm column and two mobile phases, 0.1% formic acid with 2 mM ammonium acetate in water:acetonitrile (95:5, v/v) (A) and 0.1% formic acid with 2 mM ammonium acetate in acetonitrile:water (95:5, v/v) (B), were used. The flow rate was 0.8 mL/min and the gradient was linear from 40% B to 90% B in 1.2 min and hold isocratic at 90% B for 0.2 min; and linear gradient from 90% B to 40% B in 0.1 min and hold isocratic at 40% B for 1.19 min. The mass spectrometer was equipped with an electrospray ionisation source operated in negative ion mode. The ion transitions monitored were m/z 465.1→ m/z 127.0 for emvododstat, m/z 451.1→ m/z 323.0 for O-desmethyl emvododstat, m/z 468.1→ m/z 127.0 for emvododstat-D3, and m/z 455.1→ m/z 327.0 for O-desmethyl emvododstat-D4.
Pharmacokinetic study in dogs following a single IV or oral dose
Three naïve male beagle dogs, 7 to 9 months old with body weights of 7.4 to 13.4 kg, were each administered an intravenous bolus dose of 0.5 mg/kg emvododstat followed by an oral gavage dose of 3 mg/kg emvododstat after a 7-day wash period. It was anticipated that emvododstat would exhibit linear pharmacokinetic properties at these respective doses, thus its pharmacokinetic characteristics in dog could be fully defined, which would guide the dose selection in the toxicology study. Emvododstat was formulated at 0.5 mg/mL in a proprietary aqueous based formulation for IV doing and at 0.6 mg/mL in a proprietary lipid-based formulation for oral dosing. At 0, 0.083 (IV dose only), 0.167 (IV dose only), 0.25 (IV dose only), 0.5, 1, 2, 3, 5, 8, 24, 48, 72, and 96 h post-dose, approximately 0.8 mL of blood samples were collected via cephalic vein into tubes containing K2EDTA as the anticoagulant. Plasma samples were prepared by centrifugation of the blood samples at 3000 g for 10 min at 2 to 8 °C. Concentrations of emvododstat and its metabolite O-desmethyl emvododstat in dog plasma were determined by an LC-MS/MS method. For sample analysis, a 20 μL aliquot of plasma sample was mixed well with 200 μL of acetonitrile containing internal standards emvododstat-D3 (60 ng/mL) and O-desmethyl emvododstat-D4 (10 ng/mL). After centrifugation, the supernatants were used for LC-MS/MS analysis. The LC-MS/MS method was essentially the same as in rat pharmacokinetic study following a single IV or oral dose, except that an API 6500+ mass spectrometer (AB Sciex, LLC, Framingham, MA, USA) was used. The flow rate was 0.6 mL/min and the gradient was hold isocratic at 30% B for 0.2 min; linear gradient from 30% B to 95% B in 1.2 min and hold isocratic at 95% B for 0.4 min; and linear gradient from 95% B to 30% B in 0.1 min and hold isocratic at 30% B for 1.19 min.
Pharmacokinetic study in monkeys following a single oral dose
Three non-naïve male rhesus monkeys, body weights of 3.6 to 3.9 kg, were each administered an oral gavage dose of emvododstat at 10 mg/kg that was expected to achieve the exposure associated with pharmacodynamic effect of DHODH inhibition. Emvododstat was formulated at 0.5 mg/mL in a proprietary lipid-based formulation. At 0, 0.083, 0.25, 0.5, 1, 2, 4, 6, 8, 12, 24, 32, 48, and 72 h post-dose, samples of approximately 1 mL of blood were collected via a femoral vein into tubes containing K2EDTA as the anticoagulant. Plasma samples were prepared by centrifugation of the blood samples. Concentrations of emvododstat and O-desmethyl emvododstat in monkey plasma were determined by an LC-MS/MS method. For sample analysis, a 20 μL aliquot of plasma sample was mixed well with 250 μL of acetonitrile containing internal standards emvododstat-D3 (100 ng/mL) and O-desmethyl emvododstat-D4 (100 ng/mL). After plate filtration, the filtrates were used for LC-MS/MS analysis. The LC-MS/MS method was essentially the same as in the mouse pharmacokinetic study following a single oral dose, except that the flow rate was 0.5 mL/min and the gradient was linear gradient from 30% B to 98% B in 0.5 min and return to 30% B in 0.5 min. The mass spectrometer was equipped with an electrospray ionisation source operated in negative ion mode. The ion transitions monitored were m/z 465.1→ m/z 127.0 for emvododstat, m/z 451.1→ m/z 323.0 for O-desmethyl emvododstat, m/z 468.1→ m/z 127.0 for emvododstat-D3, and m/z 455.1→ m/z 327.0 for O-desmethyl emvododstat-D4.
Results
Plasma protein binding and blood-plasma partitioning
Emvododstat was highly bound to the plasma proteins of all species examined, and the binding was independent of emvododstat concentration over the range of 0.05 to 50 μg/mL. The mean percentages of protein binding across four emvododstat concentrations are summarised in . Constant blood-to-plasma concentration ratios of emvododstat were achieved after 15 min incubation in mouse, rat, dog, and monkey blood, and after 30 min in human blood. 14C-Emvododstat radioactivity was largely distributed in plasma fraction with minimal association with blood cells, and the blood-to-plasma concentration ratio was independent of emvododstat concentration over the range from 0.05 to 50 μg/mL in all species examined. The mean blood-to-plasma ratios across four emvododstat concentrations are summarised in .
Table 1. Average percent of protein binding in plasma and blood-to-plasma concentration ratio in whole blood across four emvododstat concentrations (0.05, 0.5, 5, and 50 μg/mL).
Biotransformation in hepatocytes
Emvododstat at 2 µM was extensively metabolised in dog and monkey hepatocytes and moderately metabolised in human hepatocytes in a time-dependent manner to two metabolites, O-desmethyl emvododstat and its glucuronide. In dog hepatocytes, O-desmethyl emvododstat glucuronide was the predominant metabolite; in monkey and human hepatocytes, O-desmethyl emvododstat was the most abundant metabolite. In contrast to other species, only slight metabolism of emvododstat was observed in rat hepatocytes (≤2% of total radioactivity). In addition to common metabolites, two minor and unidentified metabolites, Unknown 1 and Unknown 2, were also present in dog and rat hepatocytes, respectively, but were absent from other species. In all species tested, hepatocyte incubations conducted at 20 µM emvododstat produced similar metabolic profiles when compared with incubations conducted at 2 µM 14C-emvododstat, suggesting no significant concentration-dependent changes in the metabolic biotransformation of 14C-emvododstat. The mean percentages of total radioactivity associated with 14C-emvododstat and its metabolites after 60, 120, and 240 min incubation with rat, dog, monkey, and human hepatocytes are summarised in , and the representative metabolite profiles are shown in .
Figure 2. Metabolite profiles of 14C-emvododstat at 2 µM after 4 h incubation with rat (A), dog (B), monkey (C), and human (D) hepatocytes.
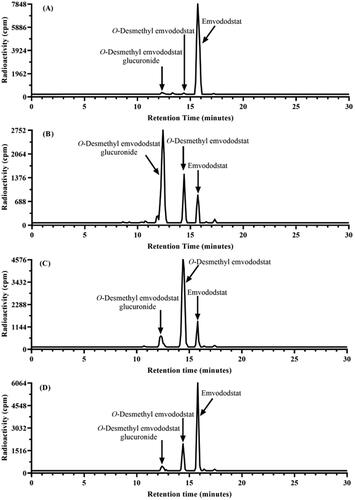
Table 2. Mean percent of total radioactivity associated with 14C-emvododstat and metabolites after 60, 120, and 240 min incubation with rat, dog, monkey, and human hepatocytes.
Further metabolism of O-desmethyl emvododstat in human hepatocytes was evaluated. After 2 h and 4 h incubation of 14C-O-desmethyl emvododstat at 5 µM with human hepatocytes, O-desmethyl emvododstat glucuronide was the only metabolite detected. The mean percent of total radioactivity of 14C-O-desmethyl emvododstat and its glucuronides were 87.4% and 12.6% after 2 h incubation, and 66.0% and 34.0% after 4 h incubation, respectively.
CYP reaction phenotyping and enzyme kinetics
After 60 min incubation of emvododstat (1 µM) with a panel of recombinant human CYP enzymes at 37 °C, disappearance of emvododstat was observed in incubations with recombinant CYP2C8 (64.5%), CYP2D6 (39.9%), and CYP2C19 (34.8%). Similarly, formation of O-desmethyl emvododstat was observed only in incubations with CYP2C8, CYP2D6, and CYP2C19 with formation rates of 0.20, 0.11, and 0.10 pmol/min/pmol CYP, respectively. After 120 min incubation of emvododstat (1 µM) with HLM at 37 °C in the presence of the chemical inhibitors, the direct-acting inhibitors ketoconazole (CYP3A4/5) and quinidine (CYP2D6) inhibited O-desmethyl emvododstat formation by 13.7% and 12.0%, respectively. The metabolism-dependent inhibitor gemfibrozil glucuronide (CYP2C8) inhibited O-desmethyl emvododstat formation by 100%. Incubations with the other metabolism-dependent inhibitors evaluated resulted in less than 13% inhibition. O-desmethyl emvododstat formation kinetics in recombinant human CYPs 2C8, 2C19 and 3A4 and in HLM were estimated under the linear conditions in terms of enzyme concentration and incubation time. The kinetic parameters are summarised in .
Table 3. O-Desmethyl emvododstat formation kinetics in recombinant human CYP enzymes and human liver microsomes (mean ± standard error, n = 3).
CYP inhibition
Emvododstat up to 100 µM did not show inhibition of CYP1A2 and 3A4, but inhibited 2B6, 2C8, 2C9, 2C19, and 2D6 activities. The inhibition of CYP2D6 was potent and non-competitive. There was no metabolism-dependent inhibition of any CYP enzymes. The inhibition parameters are listed in . Up to 10 µM, the highest soluble concentration in the test system, O-desmethyl emvododstat showed CYP inhibition trends similar to those of emvododstat, except it was almost 39x less potent against CYP2D6. The inhibition parameters are summarised in .
Table 4. Emvododstat CYP inhibition parameters in human liver microsomes.
Table 5. O-Desmethyl emvododstat CYP inhibition parameters in human liver microsomes (mean ± standard error, n = 2).
CYP induction
Emvododstat and O-desmethyl emvododstat caused concentration-dependent increases in CYP1A2, CYP2B6, and CYP3A activities and mRNA expression in at least two of the three hepatocyte cultures evaluated with a few exceptions. Maximum fold increases in mRNA expression and the corresponding percentage relative to positive control are CYP1A2 mRNA: 4.5-fold or 15.8% of positive control for emvododstat at 10 µM and 3.44-fold or 10.3% of positive control for O-desmethyl emvododstat at 50 µM; CYP2B6 mRNA: 9.67-fold or 82.8% of positive control for emvododstat at 25 µM and 4.88-fold or 37.0% of positive control for O-desmethyl emvododstat at 15 µM; and CYP3A4 mRNA: 8.53-fold or 22.9% of positive control for emvododstat at 50 µM and 3.22-fold or 6.75% of positive control for O-desmethyl emvododstat at 15 µM. The induction parameters are summarised in .
Table 6. Emvododstat and O-desmethyl emvododstat CYP induction parameters in human hepatocytes.
Transporter inhibition assays
Emvododstat and O-desmethyl emvododstat, up to the highest soluble concentrations in respective buffer systems, did not inhibit bile salts disposition transporters, as shown by BSEP-, MRP2-, MRP3-, MRP4-, and NTCP-mediated probe substrate accumulation. The highest soluble concentrations tested were 4.6 and 7.6 µM (BSEP), 5.3 and 6.6 µM (MRP2), 5.3 and 7.6 µM (MRP3 and MRP4), and 6.0 and 10.5 µM (NTCP) for emvododstat and O-desmethyl emvododstat, respectively. Up to the highest soluble concentration of 12 µM, emvododstat and O-desmethyl emvododstat inhibited the BCRP-mediated substrate accumulation with IC50 values of 1.27 µM and 1.57 µM, respectively. Emvododstat also inhibited the MDR1-mediated substrate transport with a maximum of 29% inhibition at 12 µM, while O-desmethyl emvododstat showed no interaction with the human MDR1 transporter. Emvododstat and O-desmethyl emvododstat, up to the highest soluble concentration of 5 µM, did not show interactions with any of the investigated transporters (MATE1, MATE2-K, OAT1, OAT3, OATP1B1, OATP1B3, OCT1, and OCT2).
Transporter substrate assays
Under the conditions tested, accumulation of emvododstat or O-desmethyl emvododstat was similar in the transporter-expressing and the control cells (transporter-specific fold accumulations were <2), indicating no transporter-specific transport of emvododstat or O-desmethyl emvododstat by the uptake transporters MATE1, MATE2-K, OAT1, OAT3, OATP1B1, OATP1B3, and OCT2. Permeability was low (<1 × 10⁻⁶ cm/s) for both emvododstat and O-desmethyl emvododstat in Caco-2 monolayer assays. In the bidirectional permeability measurements in BCRP- or MDR1-transfected MDCKII cells, emvododstat or O-desmethyl emvododstat did not show higher permeability in the basolateral to apical direction than in the apical to basolateral direction, indicating that there was no active transport in the investigated cell lines. For emvododstat, the highest observed net efflux ratio was 1.35 at 20 µM for MDCKII-BCRP and was 0.99 at 20 µM for MDCKII-MDR1. For O-desmethyl emvododstat, the highest observed net efflux ratio was −0.13 at 5 µM for MDCKII-BCRP and was 0.53 at 20 µM for MDCKII-MDR1.
Pharmacokinetics in nude mice following an oral dose
Following a single 10 mg/kg oral dose, emvododstat was detectable at all timepoints from 0.5 h until 32 h post-dose with mean plasma Cmax occurring at 4 h post-dose. The plasma concentration-time curve is shown in and the PK parameters are summarised in .
Figure 3. Emvododstat and O-desmethyl emvododstat plasma concentrations in (A) mice after a single 10 mg/kg oral dose of emvododstat, (B) rats and (C) dogs after a single 0.5 mg/kg IV dose or a 3 mg/kg oral dose of emvododstat, and (D) monkeys after a single 10 mg/kg oral dose of emvododstat.
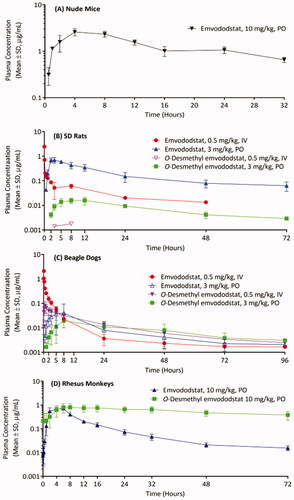
Table 7. Pharmacokinetic parameters of emvododstat and O-desmethyl emvododstat following a single IV or oral dose in mice, rats, dogs and monkeys (Mean ± SD).
Pharmacokinetic in rats following a single IV or oral dose
Emvododstat was detectable at all timepoints up to 48 h following a single 0.5 mg/kg IV dose, and at all timepoints from 0.5 h to 72 h with plasma Cmax occurring at 2 h to 3 h (mean 2.33 h) following a 3 mg/kg oral dose. O-Desmethyl emvododstat was barely detectable following a 0.5 mg/kg IV dose. Low levels of O-desmethyl emvododstat were detectable from 2 h to 72 h post-dose with plasma Cmax occurring at 8 h to 12 h (mean 9.33 h) following a 3 mg/kg oral dose. The plasma concentration-time cures are shown in and the PK parameters are summarised in .
Pharmacokinetics in dogs following a single IV or oral dose
Emvododstat was detectable at all timepoints up to 96 h following a single 0.5 mg/kg IV dose, and at all timepoints from 0.5 h to 96 h post-dose following a 3 mg/kg oral dose with plasma Cmax occurring at 3 h to 8 h (mean 5.33 h). Except for 0.5 h in PO dose group, O-desmethyl emvododstat was detectable at almost all timepoints following either IV or PO dosing. The plasma Cmax was from 0.5 h to 1 h (mean 0.667 h) post IV dosing and from 5 h to 24 h (mean 12.3 h) post PO dosing. The plasma concentration-time curves are shown in and the PK parameters are summarised in .
Pharmacokinetics in monkeys following an oral dose
Following a 10 mg/kg oral dose of emvododstat, emvododstat was detectable at all timepoints up to 72 h post-dose with plasma Cmax occurring at 2 h to 6 h (mean 4.67 h). O-desmethyl emvododstat was also detectable at all timepoints up to 72 h post-dose with the plasma Cmax occurring at 6 h to 16 h (mean 11.3 h) post-dose. The plasma concentration-time curves are shown in and the PK parameters are summarised in .
Discussion
Emvododstat is a lipophilic neutral compound with a calculated LogP >5. The aqueous solubility of emvododstat is estimated to be <1 µg/mL in water (PTC internal data). Consistent with its high lipophilic and low aqueous solubility nature, plasma protein binding of emvododstat was high across species (). Distribution of emvododstat into blood cells was low with the blood-to-plasma partitioning ratio slightly higher than the haematocrit value in each evaluated species (). O-desmethyl emvododstat and its glucuronide were the major metabolites of emvododstat in hepatocytes across species (). CYP reaction phenotyping study indicated that multiple enzymes, CYP2C8, 2C19, 2D6, and 3A4, were involved in emvododstat O-demethylation. Both emvododstat and O-desmethyl emvododstat showed similar trends of in vitro CYP inhibition ( and ), CYP induction (), and BCRP inhibition potentials.
O-Desmethyl emvododstat also showed a tendency of metabolism-dependent inhibition of CYP3A4 after a 30 min preincubation in HLM (). Considering that glucuronidation was the only metabolic pathway for O-desmethyl emvododstat in human hepatocytes, metabolism-dependent inhibition of CYP3A4 due to phase I metabolite formation of O-desmethyl emvododstat in vivo is low. Emvododstat and O-desmethyl emvododstat did not show inhibitory interaction with the bile salts disposition transporters BSEP, MRP2, MRP3, MRP4, and NTCP. Neither emvododstat nor O-desmethyl emvododstat was a substrate for the common transporters investigated.
Following a single 0.5 mg/kg IV dose of emvododstat in rats and dogs, the systemic clearance was low and volume distribution was moderate with similar plasma AUC in both species. Emvododstat was bioavailable in mice, rats, dogs, and monkeys following a single oral dose, the dose normalised plasma AUC was higher in mice and rats than in monkeys, while the lowest in dogs. The absorption was generally slow with the mean plasma Tmax ranging from 2 to 5 h. The absolute oral bioavailability of emvododstat in rats was much higher than in dogs following the same oral dose (). Though the exact mechanism responsible is unknown, relatively low absorption and/or higher first pass metabolism, especially in gastrointestinal tract may play a role in low oral bioavailability of emvododstat in dogs. Relative to the parent drug, the plasma AUC of O-desmethyl emvododstat was lower in rodents, but was much higher in dogs and monkeys following single oral dose. This observation correlated well with in vitro metabolism data that emvododstat was metabolised more in dog and monkey hepatocytes than in rat and human hepatocytes ().
Following a 200 mg twice daily dose of emvododstat in healthy human subjects, the mean plasma Cmax at steady state is predicted to be 2.11 µg/mL or 4.52 µM for emvododstat, and 0.746 µg/mL or 1.65 µM for O-desmethyl emvododstat, and the maximum gastrointestinal concentration of emvododstat is estimated to be <20 μM (PTC internal data). The calculated portal vein concentration (Cmax,inlet) of emvododstat was 5.03 µM (U.S. Department of Health and Human Services and Food and Drug Administration Center for Drug Evaluation and Research Citation2020). Due to high plasma protein binding (>99%), the corresponding unbound plasma Cmax (Cmax,u) was 0.045 µM for emvododstat and 0.017 µM for O-desmethyl emvododstat, and the unbound emvododstat plasma concentration at portal vein (Cmax,u,inlet) was 0.05 µM. The calculated [I] (intestinal drug concentration, Cmax,u or Cmax,u,inlet) over IC50 (the highest tested concentration if inhibition was <50%) ratios for the most of the investigated CYPs (except for CYP2D6) and transporters (except for BCRP) are all lower than the corresponding cut-off values (0.02 for hepatic CYPs; 10 for intestinal CYP3A4, intestinal MDR1 and BCRP transporters; and 0.1 for all other transporters) set for these CYP enzymes and transporters as a static model per the most recent FDA guidance (U.S. Department of Health and Human Services and Food and Drug Administration Center for Drug Evaluation and Research Citation2020), suggesting that at the therapeutic dose of emvododstat, inhibition of CYPs (except for CYP2D6) and transporters (except for BCRP) by emvododstat or its metabolite O-desmethyl emvododstat is not expected in the clinic. Based on in vitro data, the inhibitory interaction potential of emvododstat or O-desmethyl emvododstat with CYP2D6 and BCRP cannot be excluded in the clinic; a clinical drug-drug interaction study is being considered to characterise this in vitro finding in humans.
Conclusion
In summary, in vitro O-demethylation and glucuronidation were the prominent or major metabolic pathways for emvododstat. Multiple CYPs appeared to be involved in emvododstat metabolism. Emvododstat and O-desmethyl emvododstat were both inhibitors of CYP2D6 and BCRP transporter, but neither of them is a substrate for common efflux or uptake transporters investigated in vitro. Emvododstat seemed to be a potent and selective CYP2D6 inhibitor in vitro. Based on in vitro data, the inhibitory interaction potentials of emvododstat or O-desmethyl emvododstat with CYP2D6 and/or BCRP substrate warrant further investigation in the clinic.
Emvododstat is bioavailable in mice, rats, dogs, and monkeys following a single oral dose. The absorption was generally slow with the mean plasma Tmax ranging from 2 to 5 h. Consistent with in vitro metabolism in hepatocytes, plasma exposure of O-desmethyl emvododstat was lower in rodents, but relatively higher in dogs and monkeys.
Disclosure statement
All authors are current employees except that JB and VN were former employees and are currently consutants of PTC Therapeutics, Inc.
Additional information
Funding
References
- Cao L, Weetall M, Bombard J, Qi H, Arasu T, Lennox W, Hedrick J, Sheedy J, Risher N, Brooks PC, et al. 2016. Discovery of novel small molecule inhibitors of VEGF expression in tumour cells using a cell-based high throughput screening platform. PLoS One. 11(12):e0168366. Available from https://doi.org/http://dx.doi.org/10.1371/journal.pone.0168366
- Cao L, Weetall M, Trotta C, Cintron K, Ma J, Kim MJ, Furia B, Romfo C, Graci JD, Li W, et al. 2019. Targeting of hematologic malignancies with PTC299, a novel potent inhibitor of dihydroorotate dehydrogenase with favourable pharmaceutical properties. Mol Cancer Ther. 18(1):3–16.
- Ignacio RAB, Lee JY, Rudek MA, Dittmer DP, Ambinder RF, Krown SE, AIDS Malignancy Consortium (AMC)-059 Study Team 2016. A phase 1b/pharmacokinetic trial of PTC299, a novel post transcriptional VEGF inhibitor, for AIDS-related Kaposi’s sarcoma: AIDS Malignancy Consortium trial 059. J Acquir Immune Defic Syndr. 72 (1):52–57.
- Kong R, Ma J, Hwang S, Moon YC, Welch EM, Weetall M, Colacino JM, Almstead N, Babiak J, Goodwin E. 2020. In vitro metabolism, reaction phenotyping, enzyme kinetics, CYP inhibition and induction potential of ataluren. Pharmacol Res Perspect. 8(2):e00576.. Available from https://doi.org/https://doi.org/10.1002/prp2.576.
- Luban J, Sattler RA, Mühlberger E, Graci JD, Cao L, Weetall M, Trotta C, Colacino JM, Bavari S, Strambio-De-Castillia C, et al. 2021. The DHODH inhibitor PTC299 arrests SARS-CoV-2 replication and suppresses induction of inflammatory cytokines. Virus Res. 292:198246.
- Packer RJ, Rood BR, Turner DC, Stewart CF, Fisher M, Smith C, Young-Pouissant T, Goldman S, Lulla R, Banerjee A, et al. 2015. Phase I and pharmacokinetic trial of PTC299 in pediatric patients with refractory or recurrent central nervous system tumors: a PBTC study. J Neurooncol. 121(1):217–224.
- Paris BL, Ogilvie BW, Scheinkoenig JA, Ndikum-Moffor F, Gibson R, Parkinson A. 2009. In vitro inhibition and induction of human liver cytochrome P450 enzymes by milnacipran. Drug Metab Dispos. 37(10):2045–2054.
- U.S. Department of Health and Human Services, Food and Drug Administration Center for Drug Evaluation and Research 2020. Guidance for Industry: In Vitro Drug Interaction Studies — Cytochrome P450 Enzyme- and Transporter-Mediated Drug Interactions. January 2020. Available from https://www.fda.gov/media/134582/download.
- Weetall M, Davis T, Elfring G, Northcutt V, Cao L, Moon YC, Riebling P, Dali M, Hirawat S, Babiak J, et al. 2016. Phase 1 study of safety, tolerability, and pharmacokinetics of PTC299, an inhibitor of stress-regulated protein translation. Clin Pharmacol Drug Dev. 5(4):296–305.