
 ?Mathematical formulae have been encoded as MathML and are displayed in this HTML version using MathJax in order to improve their display. Uncheck the box to turn MathJax off. This feature requires Javascript. Click on a formula to zoom.
Abstract
Navtemadlin is a potent, selective, orally available inhibitor of murine double minute 2 that restores p53 activity to induce apoptosis in TP53 wild-type malignancies. Using richly sampled pharmacokinetic (PK) and pharmacodynamic (PD) data from healthy volunteers, a population PK/PD model was developed.
A population PK (PPK) model described the PK characteristics of navtemadlin and its major metabolite acyl glucuronide (M1) and quantified enterohepatic recirculation (EHR). Post hoc individual PK parameters from this model were coupled with PD data for serum macrophage inhibitory cytokine-1 (MIC-1, GDF15), a cytokine biomarker of p53 activation, to construct a population PK/PD model that described plasma concentration-driven MIC-1 excursions and enabled simulation of the extent and duration of navtemadlin PD effects.
The median apparent clearance (CL/F) and apparent central volume (V2/F) of navtemadlin were 36.4 L/hr and 159 L. The typical maximum stimulatory effect (Smax) was close to the median maximum MIC-1 ratio to baseline of 7.29 in observed data.
Simulation revealed a dose-dependent increase of MIC-1 with steady state attained in approximately 7 days, in a 7-day-on/21-day-off dose regimen. Elevated MIC-1 concentrations persist through 17–19 days, leaving about 9-11 PD-free days in a 28-day cycle.
Introduction
Navtemadlin (KRT-232) is a potent, selective, orally available, small-molecule inhibitor of murine double minute 2 (MDM2), a key negative regulator of the tumour suppressor protein p53 (Canon et al. Citation2015; Sun et al. Citation2014). Navtemadlin restores p53 activity to drive apoptosis of TP53 wild type malignancies and has demonstrated anti-tumour activity in preclinical xenograft models, as well as in patients with haematologic malignancies and solid tumours (Al-Ali et al. Citation2020; Canon et al. Citation2015; Erba et al. Citation2019; Gluck et al. Citation2020; Wong et al. Citation2022; Wong et al. Citation2020). Navtemadlin is currently being evaluated in a phase 3 trial of patients with relapsed or refractory myelofibrosis (ClinicalTrials.gov identifier: NCT03662126. Citation2022).
Navtemadlin is a 569 Da, highly protein-bound (97.5%), lipophilic carboxylic acid (logP 5.5, pKa 4.35) that is primarily metabolised to a major circulating acyl glucuronide metabolite (M1) (Figure S1, Taylor et al. Citation2021). M1 was also found to be stable in vitro and demonstrated 5-fold lower pharmacologic activity in vitro than parent drug in the presence of 15% serum using a biochemical homogeneous time-resolved fluorescence pharmacologic potency assay (Taylor et al. Citation2021). The mean accumulation ratio of M1 was <2-fold over a 7-day once daily (QD) dosing period, and the mean metabolite-to-parent 24-hour AUC ratio was 0.20 in healthy volunteers (Wong et al. Citation2022) and 0.46 in solid tumour patients (Gluck et al. Citation2020).
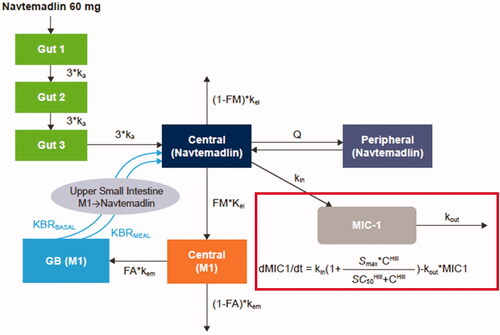
Figure 1. Schematic of PPK and PK/PD models. The outline indicates the addition of MIC-1 to the PPK model to create the PK/PD model. PPK model equations:
C: navtemadlin concentration; FA: fraction of rate M1 excreted in the gall bladder to the total M1 elimination rate kem; FM: fraction of rate navtemadlin metabolised to M1 to the total navtemadlin elimination rate kel; GB: gall bladder; I: amount from the absorption compartment; ka: absorption rate; Hill: Hill coefficient; KBRBASAL: bile acid base release rate in gall bladder; KBRMEAL: bile acid incremental release rate in gall bladder during meal; kel: navtemadlin elimination rate; kem: M1 elimination rate; kin: response formation rate; kout: response elimination rate; M1: navtemadlin acyl glucuronide metabolite; mc: M1 amount in metabolite central compartment; MEALTIME: flag for meal time (0 for non-meal time, 1 for meal time); mg: M1 amount in gallbladder compartment; MWTR: molecular weight ratio between navtemadlin and M1; nc: navtemadlin amount in central compartment; np: navtemadlin amount in peripheral compartment; Q: intercompartmental clearance; SC50: drug concentration producing 50% of Smax; Smax: maximum stimulatory effect; t: time; V2: volume of navtemadlin central compartment; V3: volume of navtemadlin peripheral compartment.
Navtemadlin pharmacokinetics (PK) in cancer patients were described by a 2-compartment population PK model with first-order absorption using data from 2 oncology studies (Ma et al. Citation2019) – a phase 1 study that evaluated navtemadlin in patients with advanced TP53 wild-type solid tumours (n = 97) or multiple myeloma (MM) (n = 10) (Gluck et al. Citation2020), and a phase 1 b study that evaluated navtemadlin alone (n = 26) or in combination with trametinib (n = 10) in patients with relapsed or refractory acute myeloid leukaemia (R/R AML) (Erba et al. Citation2019). In the population PK (PPK) modelling, 141 patients with solid tumours, MM, or R/R AML had a terminal half-life of navtemadlin of 17.1 hours, apparent oral central volume of distribution of 62.9 L, and apparent oral clearance (CL/F) of 24.9 L/h (Ma et al. Citation2019). Exposure was linear over a dose range of 15 to 480 mg. Overall, PK data in humans was supportive of QD dosing. Dose and regimen-dependent mechanisms by which disruption of MDM2–p53 elicits therapeutic efficacy are discussed in Jeay et al. (Citation2018).
Macrophage inhibitory cytokine-1 (MIC-1 or Growth Differentiation Factor 15 [GDF15]), a pleiotropic member of the transforming growth factor-beta family, is expressed in response to various cellular stressors and modifies pro-growth and pro-apoptosis signal transduction pathways, both in cancer cells and in the tumour microenvironment (Tan et al. Citation2000; Wischhusen et al. Citation2020). MIC-1 is a direct target of p53 transcriptional activation, and navtemadlin elicits dose-dependent increases of serum MIC-1, with the magnitude of MIC-1 fold change limited by higher baseline MIC-1 concentrations (Allard et al. Citation2020). Therefore, increases in MIC-1 relative to baseline serum concentrations provide a viable pharmacodynamic (PD) marker of response to MDM2 inhibition by navtemadlin in cancer patients.
The KRT-232-105 Phase 1 study evaluated the effect of a high-fat meal and a formulation change on the PK and MIC-1 PD of navtemadlin 60 mg tablets in 30 healthy adult volunteers (Wong et al. Citation2022). Mean peak plasma concentration was observed at 2–4 h post-navtemadlin treatment, and enterohepatic recirculation (EHR) was evident as a second distinct peak around 10 h post-dose in the concentration-time profiles of both navtemadlin and M1. Excretion in urine was minor. Further, navtemadlin elicited a reproducible and robust MIC-1 response that correlated with navtemadlin exposure, indicating concentration-dependent inhibition of the MDM2-p53 interaction and activation of p53-mediated gene transcription pathways. These findings provided the rationale to use these richly sampled PK/PD data from the KRT-232-105 study to develop a model that elucidates the role of EHR in the disposition of navtemadlin and M1 and the biomarker MIC-1 in healthy volunteers.
Materials and methods
Phase 1 study KRT-232-105
The KRT-232-105 Phase 1, open-label, 4-period PK/PD food-effect study included a 3-sequence crossover of navtemadlin 60 mg tablets in 30 healthy adult volunteers (Wong et al. Citation2022). Supplemental Table S1 and Table S2 summarise the categorical and continuous covariates of the study population. The study was conducted in accordance with Institutional Review Board guidelines per Good Clinical Practices and ethical requirements from the European Union (EU) directive 2001/20/EC, and the Declaration of Helsinki. Written informed consent was obtained from all study participants.
Briefly, all healthy volunteers received a 60 mg low-drug-load navtemadlin tablet (old tablet) under a fasting condition on Day 1 of the first study period (treatment C), and were then randomised 1:1:1 in 3 groups on Day 1 of each subsequent treatment period to receive a single 60 mg navtemadlin tablet as either treatment A (a high-drug-load tablet [new tablet] under a fasting condition, administered on two occasions), or treatment B (new tablet at 30 minutes after the start of a high fat meal), followed by PK, PD, and safety assessments through 96 h post-dose. Each volunteer received a total of 4 doses, with a 7-day washout period between doses in each period. Details on study design, methodology and results were previously published (Wong et al. Citation2022).
Population pharmacokinetic-pharmacodynamic model development
The population PK/PD model was developed in a sequential analysis (Zhang et al. Citation2003) where a PPK model was fitted to navtemadlin and M1 PK data, and then a PK/PD model was fitted to the post hoc (by individual) PK parameters and MIC-1 data.
PPK and PK/PD dataset construction, exploratory plots, and statistical summaries were performed in R version 4.0. Datasets were created from Analysis Data Model (ADaM) source datasets according to data specification documents. Log-transformed navtemadlin, M1, and MIC-1 concentrations were modelled. Candidate semi-mechanistic models describing EHR were tested in the analysis. PPK and PK/PD model development used the first-order conditional estimation with eta-epsilon interaction (FOCE-I) method in NONMEM® 7.4. Post hoc PK parameter estimates from the final PPK model were added to the PK/PD dataset and were utilised to generate individual predicted navtemadlin concentrations (Zhang et al. Citation2003). Model covariates for the PPK and PK/PD models were selected using a stepwise forward addition and backward elimination method based on likelihood ratio tests with a significance level of 0.05. The final model quality was checked by inspection of model parameters and their confidence intervals (CIs), as well as standard residual-based and simulation-based diagnostics and prediction-corrected visual predictive checks (pcVPCs). PK exposures were then simulated using the final PPK model. MIC-1 levels in various scenarios were then simulated using the final PK/PD model.
Results
Data summary
There were 1920 PK observations for both navtemadlin and M1, with 206 and 370 observations below the limit of quantitation (BLQ), respectively, and 1320 MIC-1 observations with 72 BLQ values. All the BLQ values were treated as missing in the models.
Population pharmacokinetic model
Based on nonclinical absorption, distribution, metabolism, and excretion (ADME) data and the physicochemical properties of navtemadlin (Ye et al. Citation2015), a structural model was developed with gut, central, and peripheral compartments for navtemadlin, central and gall bladder (GB) compartments for M1, and first-order elimination ().
Following absorption from the gut with rate ka, navtemadlin entered the central compartment, where minor renal elimination, distribution to the peripheral compartment, and metabolism to major metabolite M1 occurred. The majority of navtemadlin was expected to be metabolised to M1 in the liver, followed by excretion in bile with accumulation in the GB and continuous or pulsatile release to the gut. The overall elimination rate of M1 from the central compartment was estimated as kem. FA was the ratio of the rate that M1 enters the GB to kem. The GB compartment included a constant basal emptying rate (KBRBASAL) and an additional ‘mealtime’ emptying rate (KBRMEAL) occurring 8–10 h after the first dose. The model also provided direct return from the GB into the central navtemadlin compartment because glucuronide hydrolysis in the intestine is an enzymatic/chemical process and is faster than the disintegration and subsequent dissolution of an oral tablet for navtemadlin absorption. In addition, a 3-transit-compartment model was utilised for the absorption phase in the gut.
All three treatment sequences from the KRT-232-105 study (A, B, and C) were tested, and a good fit was found with the addition of inter-volunteer variability on clearance, central volume of navtemadlin (V2/F), and kem. Adding a food effect on the absorption rate and a sex effect on relative bioavailability significantly improved the fit. NONMEM code for the final Population PK model is in Table S3.
Parameter estimates for the final PPK model are shown in . The median CL/F of navtemadlin was estimated to be 36.4 L/h (9.66% RSE). The median apparent central volume (V2/F) and apparent peripheral volume (V3/F) of navtemadlin were 159 L (11.28%) and 390 L (13.70%), respectively. Female volunteers had 1.89 times higher relative bioavailability than male volunteers. Diagnostic goodness of fit and weighted residuals plots confirmed an adequate model fit (Supplemental Figure S2). Individual and geometric mean navtemadlin and navtemadlin acyl glucuronide plasma concentration-time data under fasted conditions (Group A) overlaid nicely with modelled concentration-time data (Supplemental Figure S3). The pcVPCs in indicated an underprediction of low plasma concentrations over the 0–96 h time interval for both navtemadlin and M1 at the population level, suggesting a limitation of the two-compartment PK model in capturing concentrations in the later elimination phase. Nevertheless, pcVPCs for the 0-24 h post-dose interval () indicated that the modelled concentrations aligned adequately with the median, 5th, and 95th percentiles of the measured concentrations in all 3 study cohorts over the major part of navtemadlin exposure (Group A data shown in ).
Figure 2. Visual predictive checks for the final PPK model over 0–96 h post dose (A) and 0–24 h post dose (B). Dots: observed. Lines: observed and predicted 5th, 50th, and 95th percentiles. Bands: 95% confidence intervals around predicted 5th, 50th, and 95th percentiles.
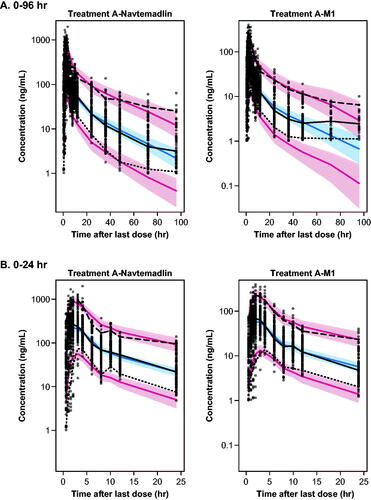
Table 1. Parameter estimates for PPK model.
Pharmacokinetic/pharmacodynamic model
All three treatment sequences from the KRT-232-105 study reached maximum MIC-1 response around 8 h after dosing, 6 h later than achievement of maximum navtemadlin concentrations (Wong et al. Citation2022). A previous analysis showed serum MIC-1 exposure in navtemadlin-treated cancer patients was correlated with navtemadlin plasma exposure (Allard et al. Citation2020). In the KRT-232-105 study, MIC-1 serum concentration time profiles showed that Tmax was delayed relative to navtemadlin Tmax by ∼8 h and that navtemadlin AUC0–t and MIC-1 AUC0–t were significantly correlated, consistent with induction of MIC-1 gene expression and protein synthesis following reactivation of p53 by navtemadlin (Wong et al. Citation2022). Therefore, an indirect stimulatory response model was combined with the EHR PPK model to characterise the relationship between navtemadlin PK and MIC-1 PD ().
The equation in the figure assumes that when there is no drug in the body (C equals 0) and the MIC-1 change rate equals 0 (steady state), kin is related to kout by the equation:
Therefore, kin was set to this expression in the estimation. Adding a Hill coefficient as an exponent on navtemadlin concentrations (i.e. using a sigmoid Emax expression for effect) improved the model fit.
Final PK/PD parameter estimates are shown in . NONMEM code for the final PK/PD model is in Table S4. Diagnostic goodness of fit and weighted residuals plots confirmed an adequate model fit (Figure S4). The pcVPCs in suggested that the modelled concentrations aligned adequately with the median, 5th, and 95th percentiles of the measured MIC-1 serum concentrations and the Tmax that was delayed relative to the navtemadlin Tmax, at approximately 8 h post-dose.
Figure 3. Visual predictive checks for the final PK/PD model for treatments A, B, and C over 0–96 h post dose. Dots: observed. Lines: observed and predicted 5th, 50th, and 95th percentiles. Bands: 95% confidence intervals around predicted 5th, 50th, and 95th percentiles.
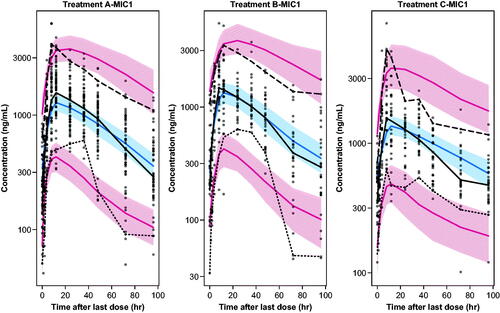
Table 2. Parameter estimates for final PK/PD model.
The typical maximum stimulatory effect (Smax) was 6.82, which is close to the median maximum serum MIC-1 ratio to baseline of 7.29 in observed data. The typical navtemadlin concentration producing 50% of the maximum stimulatory effect (SC50) was 85.22 ng/mL, with a Hill coefficient of 2.02, indicating a steep increase of MIC-1 with navtemadlin concentration.
Covariates of interest were screened in the base PK/PD model to test the impact of demographic and physiologic characteristics on navtemadlin-induced MIC-1 PD. Supplemental Figure S5 shows the effect of baseline MIC-1 on the navtemadlin-induced MIC-1 response. Healthy volunteers with a lower baseline MIC-1 had a larger navtemadlin-induced MIC-1 response, and also took a longer time to reach the maximum MIC-1 serum concentration. Those with a higher baseline MIC-1 had a smaller navtemadlin-induced MIC-1 response.
Effects of age, C-reactive protein (CRP), and alpha-1-acid glycoprotein (AAG), on navtemadlin-induced MIC-1 response in male and female volunteers are shown in Figure S6. The simulation was conducted using population estimates of PK parameters. Younger age, higher baseline AAG, and lower baseline CRP levels led to a lower navtemadlin-induced MIC-1 response for both males and females. There was not a substantial correlation within the relatively narrow range of CRP or AAG concentrations observed in this healthy volunteer population. Age had the biggest impact on the navtemadlin-induced MIC-1 response, while CRP exhibited the least. Female healthy volunteers with a higher C-reactive protein level were estimated to have a higher MIC-1 kout. Lower AAG and greater age were associated with higher Smax.
Simulated amounts of navtemadlin, M1, and MIC-1 in model compartments over time
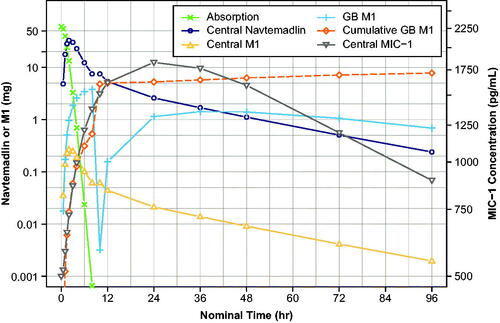
shows simulated navtemadlin and M1 amounts (mg) in various compartments over time, and navtemadlin induced MIC-1 concentrations (pg/mL) over time for the single 60 mg dose, using population estimates of PK and PD parameters. Similar to the observed results from the KRT-232-105 food effect study, navtemadlin (open circle) and M1 (open triangle) reached a maximum concentration between 2 and 4 h post-dose, with a subsequent meal-induced EHR second peak at 10 h. The glucuronide metabolite in bile (+ symbol) increased over the initial post-dose interval and then dropped at 8-10 h due to meal-stimulated gall bladder emptying at dinner time, consistent with the notion that when stored bile enters the intestine, the glucuronide is hydrolysed and released navtemadlin is reabsorbed, resulting in the EHR peak. Thereafter, the amount of M1 starts to build again through 24 h post-dose. The cumulative amount of M1 in the GB (open diamond) showed that ∼10–20% of the initial navtemadlin dose was processed through the glucuronide. Finally, central compartment MIC-1 (inverted triangle) increased to maximum concentration 12–24 h post-dose and declined thereafter. The serum MIC-1 concentration profile is driven primarily by the plasma navtemadlin amount, which was 4 times higher than the less active glucuronide metabolite M1.
Figure 4. Simulated amounts of navtemadlin, M1 (left axis), and MIC-1 (right axis) concentration in various compartments and cumulative M1 excreted in bile over time after a single 60-mg dose.
Steady-state PK simulations over the 60–480 mg dose range
Doses selected for simulation (60–480 mg) reflected the healthy subject dose in the study used to create the model (60 mg, Wong et al. Citation2022), up to the highest tested clinical dose in the FIH trial (480 mg, Gluck et al., Citation2020). Model-based simulations of PK concentrations and PK parameters for a typical navtemadlin clinical dose regimen in oncology patients are shown for seven daily navtemadlin doses of 60, 120, 180, 240, 300, 360, and 480 mg, with 21 days off in a 28 day cycle. Simulation of a typical healthy volunteer using population estimates of PK parameters is shown in , and simulation using post hoc individual estimates of PK parameters from 30 healthy volunteers is shown in . At a typical clinical oncology dose of 240 mg QD given for 7 days, elevated plasma navtemadlin and M1 concentrations persisted through 9–11 days, leaving about 17–19 drug-free days in a 28-day cycle.
Figure 5. Model-based simulations of steady state navtemadlin PK (upper panels) and glucuronide metabolite M1 PK (lower panels) for 60–480 mg navtemadlin doses given once daily for 7 days over one 28-day cycle in healthy volunteers. Curves are based on the typical healthy volunteer, i.e. the volunteer with the population parameter estimates from the PK model. The top row demonstrates navtemadlin linear scale (left panel) and a semi-log scale (right panel). The bottom row shows M1 linear scale (left panel) and a semi-log scale (right panel). Navtemadlin and M1 concentrations increase with dose. QD: once a day dosing.
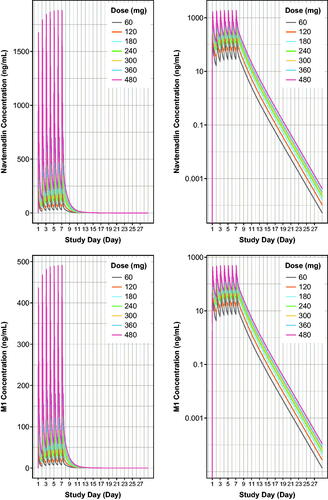
Table 3. Estimated steady state (day 7) navtemadlin and M1 PK parameters (SI units) from model-based population simulations in healthy volunteers.
Steady-State MIC-1 PD simulations over the 60–480 mg dose range
Based on the typical population PK and PD parameters from the final PK/PD model, MIC-1 serum concentration profiles after a single 60-mg navtemadlin dose were shown with model-based simulations and PD parameters of serum MIC-1 concentrations for one cycle following seven daily navtemadlin doses of 60, 120, 180, 240, 300, 360, and 480 mg in healthy volunteers. Simulation of a typical healthy volunteer using population estimates of PK/PD parameters is shown in , and simulation using post hoc PK/PD parameters from 30 healthy volunteers is shown in . The simulation revealed saturable steady-state MIC-1 PD attained within 7 days, in 7-days-on, 21-days-off navtemadlin dose regimens. At a typical clinical dose of 240 mg QD for 7 days, elevated serum MIC-1 concentrations persisted through 17–19 days, leaving about 9–11 PD-free days in a 28-day cycle.
Figure 6. Model-based simulations of serum MIC-1 excursions for 60–480 mg doses of navtemadlin given once daily for 7 days over one 28-day cycle to healthy volunteers. Curves are based on the typical healthy volunteer, i.e. the volunteer with the population parameter estimates from the PK/PD model with median age, AAG, and CRP. MIC-1 linear scale (left panel) and semi-log scale (right panel). MIC-1 concentrations increase with dose. AAG: alpha-1-acid glycoprotein; CRP: C-reactive protein; QD: once a day dosing.
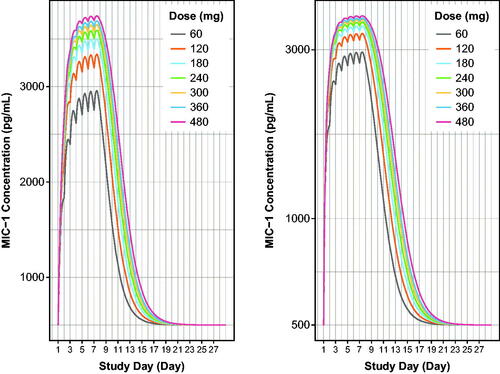
Table 4. Estimated steady state (day 7) serum MIC-1 PD parameters from model-based population simulations in healthy volunteers.
Discussion
Navtemadlin and M1 population PK model and simulations over the 60–480 mg dose range
The population PK/PD analysis used intense data from 30 healthy volunteers after a single 60 mg dose of navtemadlin. Extrapolations to clinical steady-state multiple dose regimens are based on the assumption of PK dose linearity that was observed in PPK modelling of the FIH study. The earlier PPK model was developed using data from 141 patients (1783 samples) with advanced solid tumours or multiple myeloma and relapsed/refractory acute myeloid leukaemia (AML, Ma et al. Citation2019). Navtemadlin plasma concentrations, as described by a two-compartment linear PK model with first-order absorption, showed no change in apparent clearance following oral adminstration with increasing navtemadlin dose. AML tumour type and low baseline serum albumin were associated with decreased navtemadlin clearance, suggesting indication-specific differences in PK and a possible influence of inflammation on PK, respectively (Data on file, Ma et al. Citation2019). In this EHR PPK model, steady-state simulated mean navtemadlin AUC and Cmax for a 240 mg therapeutic dose were 9591 ng*h/mL and 1220 ng/mL () and were similar to steady-state mean AUC and Cmax estimates from the solid tumour population PK model (9492 ng*h/mL and 975 ng/mL, respectively (Data on file, Ma et al. Citation2019).
In EHR PPK model development, several parameters were fixed to allow the model to converge with good stability: (1) FM was fixed to 0.95 (subsequently simplified to 1.0 without a significant change in the fit) and metabolite volume of distribution (Vmet) was fixed to 5 L based on previous model estimates and the average circulating blood volume of a human adult (Sharma and Sharma Citation2022). (2) FA, KBRBASAL, and KBRMEAL were fixed as follows: From the initial model, the estimated basal rate of GB emptying, 0.21/h, was closer to the estimated incremental rate of emptying during mealtime, 0.12/h, than expected based on physiologic processes; also, navtemadlin clearance, 69 L/h, was much higher than the clearance in a prior two-compartment patient model, which was 24.9 L/h in solid tumour patients (Ma et al. Citation2019). A large amount of metabolite estimated to enter the GB with insufficient mealtime emptying was suspected to cause the high basal rate. Given that FA could not be estimated reliably from the dataset, it was fixed to 0.1 to limit metabolite entrance into EHR. The resulting model produced estimates of KBRBASAL, KBRMEAL and clearance of 0.01/h, 3.66/h, and 27.5 L/h, respectively. These lower estimates agreed better with the two-compartment patient model (Ma et al. Citation2019) and appeared more physiologically plausible. Even lower values of FA were tested but produced significantly worse fits. A separate semi-mechanistic model estimating the gastric emptying rate and GB total bile acid release rates using data from a crossover study in 15 healthy volunteers and 15 diabetic patients found that the basal GB emptying rate was 0.03/h, and the rate during mealtime was about 70/h (Guiastrennec et al. Citation2018, Guiastrennec et al. Citation2016). Based on these findings and the difficulty estimating these rates reliably from the dataset, KBRBASAL and KBRMEAL were fixed to these values.
Stringent conservation of endogenous bile acids by conjugate hydrolysis and EHR provided a convenient starting point for the population PK model (Guiastrennec et al. Citation2018, Guiastrennec et al. Citation2016). The second-peak EHR phenomenon could be observed due to frequent sampling and a timed meal schedule providing prandial GB emptying in the controlled environment of a Phase 1 clinic. All volunteers were scheduled to receive lunch and dinner at approximately 4 and 8 h after the first dose, respectively, and the observable EHR peak, around 8–10 h after the dose, was suspected to arise from GB emptying during and after dinner. A lunchtime effect was not included because an EHR peak was not observed around that time and may not have been as evident at higher navtemadlin plasma concentrations just after Cmax.
Previously reported estimates of GB basal release rate and incremental mealtime release rate of bile acids (Guiastrennec et al. Citation2018, Ye et al. Citation2015) fit the navtemadlin and M1 data well in our analysis. The median apparent clearance following oral administration of navtemadlin was estimated to be 36.4 L/h, which is higher than the 24.9 L/h estimated in the earlier model in cancer patients (Ma et al. Citation2019), perhaps due to the very different populations as well as model differences. Female volunteers had about 1.89 times higher relative bioavailability of navtemadlin than male volunteers had in this study; however, no sex difference was observed in the previous population PK model developed in 76 male and 66 female, generally older, cancer patients (Ma et al. Citation2019).
EHR of aglycones of biliary glucuronide metabolites is relatively well established, and enteric hydrolysis of glucuronides by bacterial β-glucuronidases is such that glucuronide metabolites do not generally survive long enough to be excreted in faeces (Yang et al. Citation2017). Half-lives of glucuronidated drugs can be extended proportional to the fraction of dose glucuronidated, and EHR effects on PK have been modelled in monkeys (Shou et al. Citation2005, Sun and Welty Citation2021) and in humans (Ezzet et al. Citation2001).
Approaches that model EHR of both the parent drug and the glucuronide are less common and are exemplified by ezetimibe and its phenolic glucuronide (Soulele and Karalis Citation2019) and the ester prodrug, mycophenolate mofetil and its acyl and phenolic glucuronides (Sam et al. Citation2009, Yau et al. Citation2009). EHR population PK and PK/PD of the active metabolite, mycophenolic acid (MPA) and its acyl glucuronide were described by a one-compartment model with first-order elimination in patients undergoing haematopoietic stem cell transplantation. The model was combined with a maximal inhibitory PD model to establish the relationship between MPA plasma concentrations and inosine-5′-monophosphate dehydrogenase activity (IMPDH) (Yoshimura et al. Citation2018).
MIC-1 PK/PD model and steady-state MIC-1 PD simulations over the 60–480 mg dose range
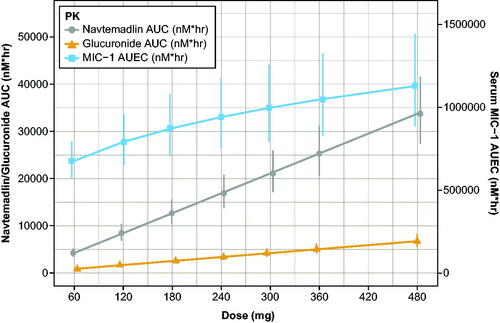
MIC-1 PD data were coupled with the PPK model to create an indirect stimulatory PK/PD model that described the relationship between navtemadlin and MIC-1 in healthy volunteers, with key parameters Smax, SC50, and power transformations for concentrations. Whereas the PPK model generated linear increases in PK AUC with dose for navtemadlin and the acyl glucuronide metabolite, the increase in AUEC with dose suggested a saturable PD curve with a possible maximum PD effect at very high doses (, ).
Figure 7. Simulated dose proportionality of molar navtemadlin and M1 AUC and the MIC-1 AUEC. AUC: area-under-the-curve on Day 7; AUEC: area-under-the-effect-curve on Day 7; PK: pharmacokinetics. Values are the mean estimate with 95% confidence intervals using a t-distribution. Conversion factors from ng/mL to nM use navtemadlin molecular weight (MWt) of 568.6 gm/mole: conversion factor ng/mL to nM = 1/MWt × 1000 = 1.758706. Conversion factors from ng/mL to nM use M1 molecular weight (MWt) of 744.7 gm/mole: conversion factor ng/mL to nM = 1/MWt × 1000 = 1.342823. Conversion from pg/mL to nM uses MIC-1 molecular weight (MWt) of 24,600 gm/mole: conversion ng/mL to nM = 1/MWt × 106 = 40.650407.
Our previous PK/PD analysis in cancer patients demonstrated that serum MIC-1 fold-excursions increased with increasing dose, treatment duration (up to 7 days), and navtemadlin AUC, and also found that patients with a higher baseline MIC-1 concentration had a smaller MIC-1 fold change (Allard et al. Citation2020). This is important because baseline levels of the cytokine MIC-1 vary according to disease indication in myeloid disorders (Uchiyama et al. Citation2015), and pathogenesis and progression in myeloid malignancies has an inflammation component (Craver et al. Citation2018), so fold excursions of MIC-1 may differ by disease indication and stage. For example, baseline MIC-1 concentrations in healthy volunteers were lower than the mean baseline concentrations of 2246 pg/mL (N = 49) and 3109 pg/mL (N = 15) in solid tumour/multiple myeloma patients and AML patients that were used in earlier MIC-1 concentration-response and dose-response modelling (Allard et al. Citation2020).
In oncology studies, MIC-1 concentration-response was typically measured over time alongside other PK parameters, for example with navtemadlin (Gluck et al. Citation2020) or siremadlin (Stein et al. Citation2022). MIC-1 PK/PD was assessed similarly, with percent change from predose concentration over time for milademetan (Takahashi et al. Citation2021) and idasanutlin (Italiano et al. Citation2021, Nemunaitis et al. Citation2018). Overall, MIC-1 data are found to be highly variable and are generally related to dose and/or plasma concentrations of the parent MDM2 inhibitor drug.
Italiano et al. (Citation2021) and Jamois et al. (Citation2020) both used a stimulatory indirect response model for MIC-1 release from idasanutlin treatment. Data from 99 solid tumour patients were used to simulate median (90% CI) MIC-1 excursions in pg/mL over a 28 day cycle for 50, 100, and 150 mg QD × 5 and QW × 3 dose regimens (Italiano et al. Citation2021). The highest simulated median peak MIC-1 excursions occurred after the 5th dose of the 150 mg QD × 5 regimen. The model was also applied to 245 Phase 3 patients with AML, polycythaemia vera, or solid tumours treated with idasanutlin (Jamois et al. Citation2020). Patients with higher treatment exposures had higher MIC-1 release, irrespective of TP53 mutational status, but no difference in MIC-1 response was seen between responders and non-responders, so it cannot be used as a surrogate marker of clinical response to idasanutlin. These idasanutlin clinical response data and the PK/PD response characterised in healthy volunteers in this study serve to emphasise that serum MIC-1 is a useful biomarker of p53 target engagement, secondary to MDM2 inhibitor action in dividing cells throughout the body. It is noteworthy that data from healthy volunteers in this study, and the similar MIC-1 response to idasanutlin in patients with wild type and TP53 mutant AML, both indicate that serum MIC-1 is not a tumour-specific marker of p53 activation. Serum MIC-1 from the tumour itself is not likely to be discerned against the backdrop of whole-body MIC-1 production.
In conclusion, this PK/PD model described navtemadlin EHR secondary to acyl glucuronidation and connected navtemadlin PK to a robust MIC-1 concentration-response. This model can be used as a starting point to address EHR effects on navtemadlin PK profiles (e.g. peak concentration and extended half-life) and the role of MIC-1 induction as a surrogate marker for p53 activation in various patient populations.
Supplemental Material
Download PDF (417.1 KB)Acknowledgements
The authors thank the investigators on the KRT-232-105 clinical study. The authors also thank Russ Wada from Certara, who initiated the conceptual work on the models, and Cecile Krejsa, Chunyan Gu, and Terry Podoll who helped with the MIC-1 analysis. Editorial support was provided by Team 9 Science and funded by Kartos Therapeutics. The authors directed development of the publication and are fully responsible for all content and editorial decisions.
Disclosure statement
LZ and BP are current employees of Certara, Inc. SW is a current employee at Kartos Therapeutics, a current holder of stock options for Telios Pharma, and a current equity holder of AbbVie Biotherapeutics. JGS is a current employee at Kartos Therapeutics, current holder of AstraZeneca stock and stock options for Telios Pharma,. MG is a current employee of qPharmetra, LLC and was previously employed by Certara, Inc. (within the past 24 months) and is a current stock holder of AbbVie. The authors report no declarations of interest.
Data availability statement
The authors confirm that the data supporting the findings of this analysis are available within the article and its supplementary materials.
Additional information
Funding
References
- Al-Ali HK, Delgado RG, Lange A, Pluta A, McLornan DP, Vachhani P, Damaj GL, Jost PJ, Rejto L, Hus M, et al. 2020. KRT‑232, a first‑in‑class, murine double minute 2 inhibitor (MDM2i), for myelofibrosis (MF) relapsed or refractory (R/R) to Janus‑associated kinase inhibitor (JAKi) treatment (TX). HemaSphere. 4 (S1):65.
- Allard M, Wada D, Krejsa C, Greg Slatter J. 2020. Exposure-macrophage inhibitory cytokine-1 (MIC-1) response analysis of the MDM2 antagonist KRT-232 in patients with advanced solid tumors, multiple myeloma, or acute myeloid leukemia. HemaSphere. 4:212.
- Canon J, Osgood T, Olson SH, Saiki AY, Robertson R, Yu D, Eksterowicz J, Ye Q, Jin L, Chen A, et al. 2015. The MDM2 inhibitor AMG 232 demonstrates robust antitumor efficacy and potentiates the activity of p53-inducing cytotoxic agents. Mol Cancer Ther. 14 (3):649–658.
- ClinicalTrials.gov. 2022. KRT-232 versus best available therapy for the treatment of subjects with myelofibrosis who are relapsed or refractory to JAK inhibitor treatment (BOREAS). ClinicalTrials.gov identifier: NCT03662126 [updated 2022 Jul 14. accessed July 27]. https://clinicaltrials.gov/show/NCT03662126.
- Craver BM, El Alaoui K, Scherber RM, Fleischman AG. 2018. The critical role of inflammation in the pathogenesis and progression of myeloid malignancies. Cancers (Basel). 10 (4):104.
- Data on file. Kartos Therapeutics.
- Erba HP, Becker PS, Shami PJ, Grunwald MR, Flesher DL, Zhu M, Rasmussen E, Henary HA, Anderson AA, Wang ES. 2019. Phase 1b study of the MDM2 inhibitor AMG 232 with or without trametinib in relapsed/refractory acute myeloid leukemia. Blood Adv. 3 (13):1939–1949.
- Ezzet F, Krishna G, Wexler DB, Statkevich P, Kosoglou T, Batra VK. 2001. A population pharmacokinetic model that describes multiple peaks due to enterohepatic recirculation of ezetimibe. Clin Ther. 23 (6):871–885.
- Gluck WL, Gounder MM, Frank R, Eskens F, Blay JY, Cassier PA, Soria JC, Chawla S, de Weger V, Wagner AJ, et al. 2020. Phase 1 study of the MDM2 inhibitor AMG 232 in patients with advanced p53 wild-type solid tumors or multiple myeloma. Invest New Drugs. 38 (3):831–843.
- Guiastrennec B, Sonne DP, Bergstrand M, Vilsboll T, Knop FK, Karlsson MO. 2018. Model-based prediction of plasma concentration and enterohepatic circulation of total bile acids in humans. CPT Pharmacometrics Syst Pharmacol. 7 (9):603–612.
- Guiastrennec B, Sonne DP, Hansen M, Bagger JI, Lund A, Rehfeld JF, Alskar O, Karlsson MO, Vilsboll T, Knop FK, et al. 2016. Mechanism-based modeling of gastric emptying rate and gallbladder emptying in response to caloric intake. CPT Pharmacometrics Syst Pharmacol. 5 (12):692–700.
- Italiano A, Miller WH, Jr., Blay JY, Gietema JA, Bang YJ, Mileshkin LR, Hirte HW, Higgins B, Blotner S, Nichols GL, et al. 2021. Phase I study of daily and weekly regimens of the orally administered MDM2 antagonist idasanutlin in patients with advanced tumors. Invest New Drugs. 39(6):1587–1597.
- Jamois C, Anders D, Beckermann BM, Genevray M, Mundt K, Petry C, Yang J, Kassir N, Schmitt C. 2020. Contribution of idasanutlin exposure to safety, pharmacodynamics and clinical response of patients with acute myeloid leukemia treated with idasanutlin + cytarabine in phase I and III studies. Blood. 136 (Supplement 1):7–8.
- Jeay S, Ferretti S, Holzer P, Fuchs J, Chapeau EA, Wartmann M, Sterker D, Romanet V, Murakami M, Kerr G, et al. 2018. Dose and schedule determine distinct molecular mechanisms underlying the efficacy of the p53-MDM2 inhibitor HDM201. Cancer Res. 78 (21):6257–6267.
- Ma SC, Wada R, Allard M, Slatter G. 2019. Population pharmacokinetic analysis of the MDM2 inhibitor KRT-232 (formerly AMG 232) in subjects with advanced solid tumors, multiple myeloma or acute myeloid leukemia. Blood. 134 (Supplement_1):5766–5766.
- Nemunaitis J, Young A, Ejadi S, Miller W, Chen LC, Nichols G, Blotner S, Vazvaei F, Zhi J, Razak A. 2018. Effects of posaconazole (a strong CYP3A4 inhibitor), two new tablet formulations, and food on the pharmacokinetics of idasanutlin, an MDM2 antagonist, in patients with advanced solid tumors. Cancer Chemother Pharmacol. 81 (3):529–537.
- Sam WJ, Akhlaghi F, Rosenbaum SE. 2009. Population pharmacokinetics of mycophenolic acid and its 2 glucuronidated metabolites in kidney transplant recipients. J Clin Pharmacol. 49 (2):185–195.
- Sharma R, Sharma S. 2022. Physiology, blood volume. Treasure Island (FL): StatPearls.
- Shou M, Lu W, Kari PH, Xiang C, Liang Y, Lu P, Cui D, Emary WB, Michel KB, Adelsberger JK, et al. 2005. Population pharmacokinetic modeling for enterohepatic recirculation in Rhesus monkey. Eur J Pharm Sci. 26 (2):151–161.
- Soulele K, Karalis V. 2019. Development of a joint population pharmacokinetic model of ezetimibe and its conjugated metabolite. Eur J Pharm Sci. 128:18–26.
- Stein EM, DeAngelo DJ, Chromik J, Chatterjee M, Bauer S, Lin CC, Suarez C, de Vos F, Steeghs N, Cassier PA, et al. 2022. Results from a first-in-human phase I study of siremadlin (HDM201) in patients with advanced wild-type TP53 solid tumors and acute leukemia. Clin Cancer Res. 28 (5):870–881.
- Sun D, Li Z, Rew Y, Gribble M, Bartberger MD, Beck HP, Canon J, Chen A, Chen X, Chow D, et al. 2014. Discovery of AMG 232, a potent, selective, and orally bioavailable MDM2-p53 inhibitor in clinical development. J Med Chem. 57 (4):1454–1472.
- Sun K, Welty D. 2021. Elucidation of metabolic and disposition pathways for maribavir in nonhuman primates through mass balance and semi-physiologically based modeling approaches. Drug Metab Dispos. 49 (11):1025–1037.
- Takahashi S, Fujiwara Y, Nakano K, Shimizu T, Tomomatsu J, Koyama T, Ogura M, Tachibana M, Kakurai Y, Yamashita T, et al. 2021. Safety and pharmacokinetics of milademetan, a MDM2 inhibitor, in Japanese patients with solid tumors: a phase I study. Cancer Sci. 112 (6):2361–2370.
- Tan M, Wang Y, Guan K, Sun Y. 2000. PTGF-beta, a type beta transforming growth factor (TGF-beta) superfamily member, is a p53 target gene that inhibits tumor cell growth via TGF-beta signaling pathway. Proc Natl Acad Sci USA. 97 (1):109–114.
- Taylor A, Lee D, Allard M, Poland B, Greg Slatter J. 2021. Phase 1 concentration-QTc and cardiac safety analysis of the MDM2 antagonist KRT-232 in patients with advanced solid tumors, multiple myeloma, or acute myeloid leukemia. Clin Pharmacol Drug Dev. 10 (8):918–926.
- Uchiyama T, Kawabata H, Miura Y, Yoshioka S, Iwasa M, Yao H, Sakamoto S, Fujimoto M, Haga H, Kadowaki N, et al. 2015. The role of growth differentiation factor 15 in the pathogenesis of primary myelofibrosis. Cancer Med. 4 (10):1558–1572.
- Wischhusen J, Melero I, Fridman WH. 2020. Growth/differentiation factor-15 (GDF-15): from biomarker to novel targetable immune checkpoint. Front Immunol. 11:951.
- Wong MKK, Burgess MA, Chandra S, Schadendorf D, Silk AW, Olszanski AJ, Grob J-J, Jang S, Grewal JS, Lewis K, et al. 2022. Navtemadlin (KRT-232) activity after failure of anti-PD-1/L1 therapy in patients with TP53WT Merkel cell carcinoma. Presented at American Society of Clinical Oncology Meeting; June 5, Chicago, IL.
- Wong MKK, Kelly CM, Burgess MA, Lewis K, Grewal JS, Olszanski AJ, McGreivy J, Rothbaum W, Qamoos H, DeCaprio JA. 2020. KRT-232, a first-in-class, murine double minute 2 inhibitor (MDM2i), for TP53 wild-type (p53WT) Merkel cell carcinoma (MCC) after anti–PD-1/L1 immunotherapy. JCO. 38 (15_suppl):10072–10072.
- Wong S, Krejsa C, Lee D, Harris A, Simard E, Wang X, Allard M, Podoll T, O'Reilly T, Slatter JG. 2022. Pharmacokinetics and macrophage inhibitory cytokine-1 (MIC-1) pharmacodynamics of the murine double minute 2 (MDM2) inhibitor, KRT-232 in fed and fasted healthy subjects. Clin Pharmacol Drug Dev. 11 (5):640–653.
- Yang G, Ge S, Singh R, Basu S, Shatzer K, Zen M, Liu J, Tu Y, Zhang C, Wei J, et al. 2017. Glucuronidation: driving factors and their impact on glucuronide disposition. Drug Metab Rev. 49 (2):105–138.
- Yau WP, Vathsala A, Lou HX, Zhou S, Chan E. 2009. Mechanism-based enterohepatic circulation model of mycophenolic acid and its glucuronide metabolite: assessment of impact of cyclosporine dose in Asian renal transplant patients. J Clin Pharmacol. 49 (6):684–699.
- Ye Q, Jiang M, Huang WT, Ling Y, Olson SH, Sun D, Xu G, Yan X, Wong BK, Jin L. 2015. Pharmacokinetics and metabolism of AMG 232, a novel orally bioavailable inhibitor of the MDM2-p53 interaction, in rats, dogs and monkeys: in vitro-in vivo correlation. Xenobiotica. 45 (8):681–692.
- Yoshimura K, Yano I, Yamamoto T, Kawanishi M, Isomoto Y, Yonezawa A, Kondo T, Takaori-Kondo A, Matsubara K. 2018. Population pharmacokinetics and pharmacodynamics of mycophenolic acid using the prospective data in patients undergoing hematopoietic stem cell transplantation. Bone Marrow Transplant. 53 (1):44–51.
- Zhang L, Beal SL, Sheinerz LB. 2003. Simultaneous vs. sequential analysis for population PK/PD data II: robustness of methods. J Pharmacokinet Pharmacodyn. 30(6):405–416.