
 ?Mathematical formulae have been encoded as MathML and are displayed in this HTML version using MathJax in order to improve their display. Uncheck the box to turn MathJax off. This feature requires Javascript. Click on a formula to zoom.
Abstract
Valsartan is an antihypertensive drug that was developed using common marmosets (Callithrix jacchus) in pivotal toxicity studies as a non-rodent species. The aim of the present study was to investigate the utility of marmosets in the candidate selection of this drug from a pharmacokinetic and metabolic viewpoint.
Valsartan, as well as three other angiotensin II type-I receptor blockers, assumed as competitive candidates, were administered to common marmosets. Human pharmacokinetic parameters predicted by single-species allometric scaling and Wajima superposition suggested that valsartan may exhibit promising pharmacokinetic properties in humans.
In vitro metabolic studies of valsartan using isolated rat, dog, marmoset, cynomolgus monkey, and human hepatocytes revealed that the marmoset was the most relevant animal species to humans presenting with the most abundant human metabolite, 4-hydroxyvalsartan. Oral administration of an elevated dose of valsartan to a common marmoset demonstrated that the level of 4-hydroxyvalsartan in the plasma was comparable to that in clinical practice and suggested that safety of the human metabolite might have been confirmed in the toxicity studies using common marmosets.
These results suggest that common marmosets, the small, non-human primates, had been a suitable species for the development of valsartan.
Introduction
In the process of new drug development, the clinical candidate compound is proposed after years of compound optimisation exploration (Hughes et al. Citation2011). The candidate compound which will later be subjected to the first-in-man study must first pass a formal toxicity evaluation, including 2-week repeated dose studies in one rodent and one non-rodent species for small-molecule chemical entities (European Medicines Agency Citation2009). In general practice, rats and dogs or cynomolgus monkeys (Old World monkeys) have been used as rodent and non-rodent animal species, respectively, and minipigs can be used in some cases as an alternative to non-human primates (Prior et al. Citation2020). Common marmosets (Callithrix jacchus, hereafter referred to as marmosets) are small New World monkeys that have rarely been selected as a non-rodent species for toxicity studies. Moreover, while cynomolgus monkeys harbour both advantages and disadvantages in toxicology studies (Smith et al. Citation2001; Zühlke and Weinbauer Citation2003; Orsi et al. Citation2011), toxicology data using marmosets are accepted by regulatory authorities worldwide. The potential benefits of using marmosets include high reproductive efficacy in captivity (Korte and Everitt Citation2019), easy handling (Layne and Power Citation2003), and reduced amounts of test drugs required (ca. 1/10 of that for macaque monkeys), which saves time and reduces the cost of drug synthesis (Smith et al. Citation2001; Zühlke and Weinbauer Citation2003). Moreover, marmosets may be preferred for ethical reasons, as they are phylogenetically more distant from humans than are cynomolgus monkeys (Orsi et al. Citation2011; Son et al. Citation2020).
Valsartan is an angiotensin II type-I receptor blocker widely used in the treatment of hypertension (Criscione et al. Citation1995; Holwerda et al. Citation1996). For the safety evaluation of the compound, a series of toxicity studies, including two-week, three-month, and 12-month oral toxicity studies, were conducted using marmosets as a non-rodent species (Drug Approval Package, Food and Drug Administration Citation1996). Recently, Mochizuki et al. (Citation2018) reproduced the two-week oral toxicity study of valsartan with marmosets using a new approach, i.e. the plasma micro sampling toxicokinetic technique. Valsartan efficiently lowered blood pressure of normotensive sodium-depleted marmosets (Criscione et al. Citation1995), which supports the use of marmosets as a non-rodent species in toxicity studies.
A clinical candidate compound under development is generally selected from more than one chemical entity in the final optimisation process (Hughes et al. Citation2011) and choosing a candidate drug that may exhibit the most appropriate pharmacokinetic (PK) behaviour in the human body is essential (Di et al. Citation2013). Because marmoset CYP2C19 is genetically polymorphic (Uehara et al. Citation2016; Kusama et al. Citation2018), we aimed to predict PK parameters of 24 model compounds in humans using the single-species allometric scaling (SSS) method using marmosets genotyped for CYP2C19 (Matsumoto et al. Citation2021). The total clearance (CLt) values and volumes of distribution at steady state (Vss) of these compounds could be reasonably predicted in marmosets with extensive (EM) and poor metaboliser (PM) phenotypes. In the present study, assuming that valsartan was in the stage of compound optimisation, the human CLt and Vss values were retrospectively predicted using the SSS method with PM marmosets. As we assumed competing candidate compounds in the early development stage, we could not prepare structurally related compounds that exhibited unfavourable PK properties in humans. Therefore, the generally used antihypertensive drugs, eprosartan, losartan, and telmisartan (), were administered simultaneously, and predicted human CLt and Vss and calculated elimination half-life (t1/2) values were compared with those of valsartan. Moreover, to support the use of marmosets in toxicity studies of valsartan under Metabolites in Safety Testing (MIST) guidance (European Medicines Agency Citation2009; U.S. Food and Drug Administration Citation2016), comparative in vitro metabolic studies were conducted using isolated rat, dog, marmoset, cynomolgus monkey, and human hepatocytes. Subsequently, plasma concentration-time profiles of the unchanged drug and the presumed human major metabolite were measured after elevated oral dosing of valsartan to marmosets.
Figure 1. Chemical structures of valsartan, 4-hydroxyvalsartan, eprosartan, losartan, and telmisartan.

Materials and methods
Chemicals
Valsartan, eprosartan mesylate, losartan potassium, and telmisartan were purchased from Tokyo Chemical Industry (Tokyo, Japan). Additionally, 4-hydroxyvalsartan (a racemic mixture) was purchased from Santa Cruz Biotechnology Inc. (Dallas, TX). The solubilising agent, Wellsolve (Hamid et al. Citation2009), was purchased from Celeste Corporation (Tokyo, Japan). The other reagents and solvents used were of analytical and high-performance liquid chromatography (HPLC) grade.
Animals and cryopreserved hepatocytes
Male PM marmosets (3.0–4.5 years of age) with homozygous amino acid sequences of p.[Leu7, Leu254, Ile469] in their CYP2C19 isozyme were selected from a breeder cohort of CLEA Japan (Tokyo, Japan) by direct sequencing of marmoset CYP2C19 exons (Uehara et al. Citation2016). A complete diet (CMS-1M, CLEA Japan) and water were provided ad libitum during the experiments, unless otherwise stated.
Cryopreserved hepatocytes from male Sprague-Dawley rats (lot number, R3000.H15), male beagle dogs (D1000.H15A), male cynomolgus monkeys (P2000.H15), and a female human donor (9 years of age, HC2-19) for the in vitro metabolism studies were provided by Sekisui XenoTech (Tokyo, Japan). Viabilities after thawing according to the vendor’s instructions were 70.0%, 85%, 86%, and 85%, respectively. Marmoset hepatocytes were obtained from a male marmoset (5.3 years of age) using the Worthington Hepatocyte Isolation System (Worthington Biochemical Co., Ltd, Lakewood, NJ) according to the vendor’s instructions. The marmoset had heterozygous amino acid sequences of p.[Leu7/Phe7, Leu254/Ser254, Ile469/The469] in the CYP2C19 isozyme, which was considered to exhibit intermediate metabolic activity between EM and PM phenotypes. The isolated hepatocytes were suspended in the cell cryopreservation medium, Cellbanker 1 plus (Nippon Zenyaku Kogyo Co., Ltd, Fukushima, Japan), followed by gradual freezing in a −80 °C freezer using the BICEL (Nihon Freezer Co., Ltd., Tokyo, Japan) freezing treatment container. The viability after thawing was >80%.
Dosing and sample collection
Drug administration and blood sample collection from marmosets were performed in compliance with the protocol (protocol number 58-023YBF) approved by the Animal Care and Use Committees of CLEA Japan Inc. and Meiji Seika Pharma Co., Ltd. (application number C2021-008-0). In the cassette dosing study, valsartan, eprosartan mesylate, losartan potassium, and telmisartan were administered intravenously to three marmosets as a mixed solution in saline containing 1% Tween 80 and 8% dimethyl sulfoxide at a dose of 0.2 mg each in its free form/2.5 mL/kg. Blood samples (approximately 180 μL) were taken from the femoral vein at 10 min, 30 min, and 1, 2, 4, 8, and 24 h without anaesthesia. Two weeks later, the same animals orally received a mixture of the same test compounds suspended in water containing approximately 7% Wellsolve at a dose of 2.0 mg each in its free form/5.0 mL/kg after an overnight fast. In an elevated dose study, which mimicked the first day of the three-month toxicity study (Drug Approval Package, Food and Drug Administration Citation1996), a marmoset was orally administered 30 mg/10.0 mL/kg of valsartan suspended in an aqueous solution of 0.5% w/v carboxymethyl cellulose sodium containing 0.1% Tween 80. After oral administration, samples of blood (approximately 200 μL) were taken from the femoral vein at 15 min, 45 min, and 2, 4, 8, and 24 h. All blood samples were centrifuged at 1200 × g for 10 min, and the obtained plasma samples were stored in a freezer and subjected to liquid chromatography/tandem mass spectrometry (LC-MS/MS) analyses.
Quantification of the unchanged drugs and 4-hydroxyvalsartan by LC-MS/MS
Concentrations of the model compounds in plasma samples (5 μL each) were determined by LC-MS/MS. Internal standard solution containing zonisamide in acetonitrile (20 μL) was added to the analytical and standard samples. The tube was closed, vortex mixed for approximately 10 s, and subsequently centrifuged. The supernatant (10 μL) was pipetted into a polypropylene vial, an equal volume of Milli-Q-water was added, and the mixture (2 μL) was injected into the column. LC-MS/MS analysis was performed in negative ionisation mode using a Shimadzu Nexera UHPLC system (Shimadzu, Kyoto, Japan) coupled with an API QTRAP 5500 triple quadrupole mass spectrometer (Thermo Fisher Scientific, Waltham, MA, USA). The columns (CAPCELL CORE ADME, 50 mm × 2.1 mm i.d., 2.7 μm; Osaka Soda, Japan) were maintained at 40 °C. The mobile phases were 0.1% aqueous formic acid (A) and acetonitrile (B). A linear gradient elution with a flow rate of 0.4 mL/min was performed as follows: 20% B during 0–0.5 min; 20–90% B during 0.5–3.0 min; 90% B during 3.0–3.5 min; and 20% B during 3.5–5.0 min. The detection and quantification of target analytes were performed using the multiple reaction monitoring mode. The optimised MS/MS method for this analysis used the transitions m/z 434.1 → 179.0, m/z 423.2 → 379.1, m/z 421.1 → 179.1, m/z 513.2 → 469.2, m/z 450.1 → 350.0, and m/z 211.0 → 119.0 for valsartan, eprosartan, losartan, telmisartan, 4-hydroxyvalsartan, and zonisamide, respectively. The quantitative concentration was determined by linear regression analysis using the analyte/internal standard peak area ratio. The LC–MS/MS data were acquired and processed using Analyst version 1.6.3 (AB SCIEX, Framingham, MA, USA).
PK analyses
PK parameters of valsartan, eprosartan, losartan, and telmisartan were determined using Phoenix WinNonlin software version 8.1 (Certara USA, Inc., Princeton, NJ). The non-compartment model was applied to plasma concentration-time profiles obtained after oral administration. The area under the plasma concentration-time curve (AUCpo) was obtained from 0 h to the last measurable time point by the trapezoidal method and by extrapolating the plasma concentration to infinity with an assumed mono-exponential decline. The two-compartment model was applied to plasma concentration-time profiles after intravenous administration (Wajima et al. Citation2004). The AUCiv, CLt, Vss, and mean residence time (MRT) values were estimated by curve fitting techniques using the following equations:
(1)
(1)
(2)
(2)
(3)
(3)
(4)
(4)
(5)
(5)
(6)
(6)
(7)
(7)
where C represents the plasma concentration in marmosets and t is the time after dosing. A, B, α, and β are macroscopic parameters, and k21 and k12 are the first-order transfer rate constants (microscopic parameters) for the two-compartment model.
Oral bioavailability values (Fpo) of the four compounds were calculated by dividing the AUCpo values by the corresponding AUCiv values of each marmoset following dose normalisation. In the oral administration study with an elevated dose of valsartan, the observed maximum plasma concentration of M1 was deemed as the maximum plasma concentration (Cmax).
Prediction of human CLt and Vss by SSS
The CLt and Vss values in humans (CLt, pred and Vss, pred) were extrapolated from those obtained in marmosets using the following equations:
(8)
(8)
(9)
(9)
where BWhuman and BWmarmoset represent the standard species body weights for humans (70 kg) and marmosets (0.35 kg), respectively. The scaling exponents ‘a’ in EquationEquation (8)
(8)
(8) and ‘b’ in EquationEquation (9)
(9)
(9) represent floating exponents of 0.65 and 0.87, tentatively proposed in the previous report using 24 model compounds for PM marmosets (Matsumoto et al. Citation2021), respectively. As a reference, generally accepted fixed exponents (a = 0.75 and b = 1.0) were also used for the calculation (Hosea et al. Citation2009).
Prediction of human t1/2
The t1/2, pred values were estimated from the β phase (elimination phase) of the two-compartment model following intravenous administration. Wajima et al. (Citation2004) assumed that the plasma concentration-time curves of different species could be superimposed after normalisation of the concentration axis (Y-axis) and time axis (X-axis) by their ratios of the concentration at steady state (Css) and MRT values, respectively. When this concept was applied to the two-compartment model, EquationEquation (1)(1)
(1) could be converted to:
(10)
(10)
where Cpred, Css, human, and MRTpred represent predicted plasma concentration, Css in humans, and predicted MRT, respectively.
As β × (MRT/MRTpred) in EquationEquation (10)(10)
(10) corresponds to β in humans (βhuman) in comparison to EquationEquation (1)
(1)
(1) , t1/2, pred in the terminal phase could be calculated as follows:
(11)
(11)
(12)
(12)
The Wajima approach allowed the CLt, pred and Vss, pred values obtained by any prediction method to be adopted for the calculation of MRTpred (=Vss, pred/CLt, pred) (Wajima et al. Citation2004). In the present report, CLt, pred and Vss, pred values obtained by the SSS method were used for the prediction of t1/2 (EquationEquations (11)(11)
(11) and Equation(12)
(12)
(12) ) as reported by Miyamoto et al. (Citation2019).
Metabolism of valsartan in isolated hepatocytes and characterisation of the major metabolite in marmosets and humans
Valsartan (100 μM) dissolved in Williams’ E medium (Williams Medium E, BSA free; Thermo Fisher Scientific) containing 1% acetonitrile was incubated in a 24-well plate with rat, dog, marmoset, cynomolgus monkey, and human hepatocytes (4 × 10⁶ cells/mL) at 37 °C in an atmosphere of 5% CO2 and 95% relative humidity for 4 h under mild shaking. The total volume was 1.0 mL per vial, and the reaction was terminated by adding 4.0 mL of ice-cold acetonitrile. The mixtures were then centrifuged at 3000 × g for 10 min, and the supernatants were evaporated under a nitrogen stream. The residue was reconstituted in 150 μL of a 25% acetonitrile aqueous solution and 5 μL of the solution was injected into the column.
An LC-quadrupole time-of-flight (QTOF)-MS system (QTOF6530, Agilent Technologies, Santa Clara, CA, USA) equipped with a ZORBAX Eclipse Plus C18 Rapid Resolution HD (1.2 µm, 2.1 mm × 100 mm) column (Agilent Technologies) maintained at 40 °C was used for the analyses. The mobile phases consisted of an aqueous solution of 0.1% v/v formic acid (A) and 0.1% v/v formic acid in acetonitrile (B). Chromatographic separations were performed with a gradient using a flow rate of 0.3 mL/min. The concentration of B was increased linearly from 15% to 50% during 0–18 min, then to 90% during 18–19 min, and maintained at 90% for 4 min. The UV absorbance of the eluate was monitored using a diode array detector with a wavelength range from 210–400 nm. The UV chromatogram at a wavelength of 254 nm with a reference wavelength of 360 nm was extracted from the diode array detector data. The metabolic profile of valsartan in each species was evaluated by subtracting the UV chromatogram of the reaction mixture at 0 h from that after 4 h of incubation. Formation of the major marmoset and human metabolite, 4-hydroxyvalsartan, was confirmed by referring its retention time (Rt) to that of the chemically synthesised standard. The MS analyses in electrospray positive and negative ionisation modes were performed within a scan range of m/z 90–1000 with a scan rate of 1.00 spectra/s, with the following instrument and scan source parameters: gas temperature 350 °C, gas flow 10 L/min, nebuliser 50 psig, sheath gas temperature 350 °C, sheath gas flow 7.5 L/min, VCap 3500, nozzle voltage 1000 V, and fragmentor 100).
Results
PK of four model compounds following intravenous and oral administration
Following intravenous administration, plasma concentrations of valsartan, eprosartan, and telmisartan declined in a bi-exponential manner with different elimination rates (). PK parameters of the three compounds were calculated according to the two-compartment model. Moreover, the plasma concentration of losartan declined in a biphasic manner in two of the three marmosets. However, that in one marmoset did not fit the two-compartment model. This was likely because the plasma level had decreased rapidly, and the elimination phase could not be detected properly. Therefore, the PK parameters of losartan were obtained from the two other marmosets. The average CLt and Vss values varied widely from 3.1–25.6 mL/min/kg and 0.22–9.96 L/kg, respectively ().
Figure 2. Plasma concentrations of the unchanged drugs following intravenous (A) and oral (B) administration of a mixture of valsartan (open circle), eprosartan mesylate (solid square), losartan potassium (open triangle), and telmisartan (solid diamond) in poor metaboliser marmosets. Doses of 0.2 and 2 mg/kg each were administered as free forms by intravenous and oral administration, respectively. Data points are means of three animals and whiskers show SDs.
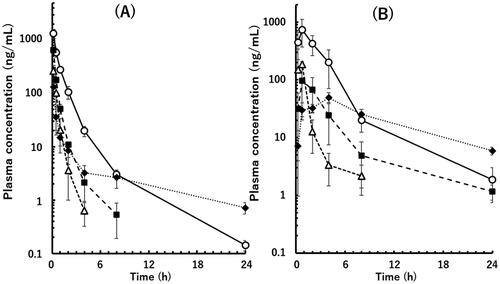
Table 1. Pharmacokinetic parameters following intravenous and oral administration of four angiotensin II type-I receptor blockers to poor metaboliser marmosets.
Following oral administration of a mixture of the four model compounds in the same three marmosets, the mean plasma concentrations of valsartan, losartan, and eprosartan reached a maximum at 0.75 h () and declined giving AUCpo values of 0.21–2.07 μg × h/mL and Fpo values of 0.09–0.19 (). In contrast, the mean plasma concentration of telmisartan reached a maximum at 4 h, suggesting a slow oral absorption rate. However, this compound exhibited the highest Fpo value of 0.42.
Retrospective prediction of human CLt, Vss, and t1/2
As shown in and , human CLt values of valsartan and eprosartan were favourably predicted by the floating exponent of 0.65, while the fixed exponent of 0.75 gave better prediction of losartan and telmisartan. Human Vss value of valsartan was two times lower than the reported value with the floating exponent of 0.87 (, ). In contrast, telmisartan was demonstrated to have a significantly large Vss value with high prediction accuracy.
Figure 3. Relationships between observed human CLt (A), Vss (B), and t1/2 (C) values and those obtained by a single-species allometric scaling method and Wajima superposition for valsartan (circle), eprosartan (square), losartan (triangle), and telmisartan (diamond) using average PK data from poor metaboliser marmosets. The observed human t1/2 value of telmisartan is the mean value obtained from two different reports. The exponent values used in the scaling method are shown in each panel. The solid and dashed lines represent unity and two-fold differences, respectively.
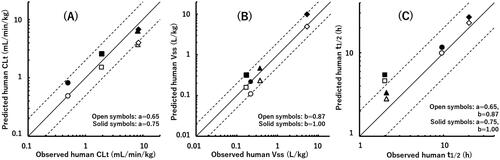
Table 2. Human pharmacokinetic parameters predicted by a single-species allometric scaling method and Wajima superposition from marmoset PK datasets.
MRT was calculated by dividing Vss by CLt (EquationEquation (7)(7)
(7) ), and MRTpred was used for the estimation of t1/2, pred (EquationEquations (11)
(11)
(11) and Equation(12)
(12)
(12) ). Therefore, effects of the different scaling exponents on Vss and CLt were partially cancelled out, resulting in small differences in MRTpred and t1/2, pred values when floating or fixed exponent values were selected (, ). The t1/2, pred values of valsartan and telmisartan were 10.0 and 22.9 h with the floating exponent, respectively, and correlated well with the reported human values. The t1/2, pred values of eprosartan and losartan were 4.7 and 2.8 h, respectively.
In vitro metabolism of valsartan in isolated hepatocytes from various species
When valsartan was incubated with rat hepatocytes, a large peak at Rt of 12.6 min (M2) followed by a peak at Rt of 14.2 min (M3) was observed (). Because both peaks were also detected by selected ion monitoring at m/z 612.26 and 610.25 ([M + 1]+ and [M − 1]− under positive and negative ionisation modes, respectively), the two metabolites were considered to be glucuronide conjugates of valsartan possessing the same molecular weight of 611.3. Formation of valsartan metabolites in dog hepatocytes was relatively small, but the metabolic pattern was comparable to that of rat hepatocytes, suggesting that M2 was also the major metabolite in vitro in dogs (). In the incubation mixture of hepatocytes from cynomolgus monkeys, almost the same amounts of M2 and M3 were observed ().
Figure 4. Differential HPLC-UV chromatograms of in vitro incubation mixtures of valsartan and isolated hepatocytes from rats (A), dogs (B), a marmoset (C), cynomolgus monkeys (D), and a human donor (E) (chromatograms at 0 h were subtracted from those at 4 h). Synthesised 4-hydroxyvalsartan (a racemic mixture) was analysed under the same HPLC conditions (F). M1, 4-hydroxyvalsartan; M2 and M3, valsartan glucuronides.
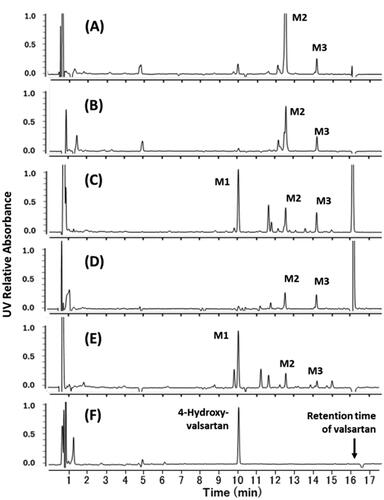
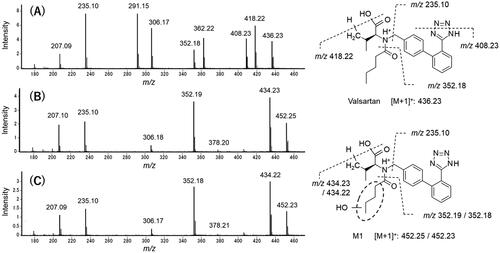
The two glucuronides of valsartan found in rats, dogs, and cynomolgus monkeys were also generated in marmosets () and human hepatocytes (). In contrast to rats, dogs, and cynomolgus monkeys, hepatocytes from marmosets and humans exhibited the largest peak of M1 at Rt of 10.1 min. Additionally, the mass spectra of M1 from marmosets and humans were almost identical (), giving the molecular ion at m/z 452 ([M + 1]+), which was 16 mass units larger than that of the parent drug (). However, a characteristic fragment peak of valsartan at m/z 352 was not shifted in the metabolite, suggesting that the oxopentane moiety was the site of oxidation. The Rt of synthesised 4-hydroxyvalsartan in the HPLC chromatograms corresponded with those of M1 generated in marmoset and human hepatocytes ().
Figure 5. Mass spectrometric characterisation of valsartan (A) and M1 found in the incubation mixtures of valsartan and isolated hepatocytes from a marmoset (B) and a human donor (C). Mass spectra were obtained by scanning the HPLC eluate between retention times of 16.2 and 16.3 min for valsartan (marmoset sample) and 10.0 and 10.2 min for M1 (marmoset and human samples) (see ).
Plasma concentration of M1 following oral administration of valsartan
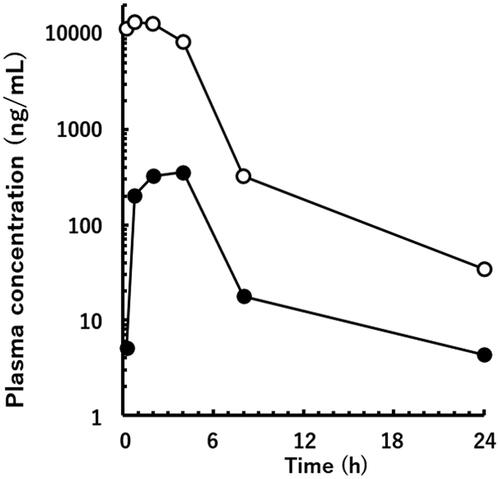
As shown in , the Cmax values of the unchanged drug (13,300 ng/mL) and M1 (355.3 ng/mL) were obtained at 45 min and 4 h following a single oral administration of 30 mg/kg of valsartan to a PM marmoset, respectively.
Figure 6. Plasma concentrations of the unchanged drug (open circle) and M1 (solid circle) after oral administration of 30 mg/kg of valsartan in a poor metaboliser marmoset.
Discussion
In humans, approximately 80% of valsartan was excreted into bile in the unchanged form, while the remaining drug was primarily metabolised by CYP2C9 (Waldmeier et al. Citation1997; Nakashima et al. Citation2005). Hepatic uptake and biliary excretion of valsartan were mediated by OATP1B1/3 and MRP2, respectively (Yamashiro et al. Citation2006). In the case of eprosartan, hepatic uptake and biliary excretion mediated by OATP1B1 and MRP2 were also the primary routes of elimination, and <2% of the administered drug was recovered in the urine as its glucuronide (Bottorff and Tenero Citation1999; Sun et al. Citation2014). In contrast, losartan, known as the substrate of efflux transporter MDR1 (Göktaş et al. Citation2016), was mainly metabolised by CYP3A4 and CYP2C9 to an active metabolite, E3174, in humans (Williamson et al. Citation1998; Zaidenstein et al. Citation2001; Li et al. Citation2009). Telmisartan was transported into human hepatocytes by OATP1B3 and metabolised to its acyl glucuronide by UGT1A3 (Yamada et al. Citation2011; Hirvensalo et al. Citation2020). In the present report, valsartan and the other three angiotensin II type I receptor blockers, were simultaneously administered to three male marmosets. Although cassette dosing is a convenient procedure for screening in drug discovery (White and Manitpisitkul Citation2001; Nagilla et al. Citation2011), information about membrane transporters and metabolic enzymes responsible for the hepatic uptake and elimination of the four compounds in marmosets was previously limited. In the present study, therefore, small doses of 0.2 and 2.0 mg/kg were selected for intravenous and oral administrations, respectively, to evade potential PK drug-drug interactions.
Various theoretical and empirical methodologies have been used for the prediction of human hepatic clearance (CLh) or CLt (Ring et al. Citation2011) and Vss (Jones et al. Citation2011). For the prediction of CLh, in vitro-in vivo extrapolation is one of the major theoretical methodologies that can be expanded to the extended clearance (Riede et al. Citation2016) and physiologically based PK models for valsartan (Poirier et al. Citation2009). In the meantime, the SSS method is a simple approach that can be used to predict human CLt and Vss as well as CLh. This method is based on a power-low relationship with body mass (Hosea et al. Citation2009). Therefore, scaling exponents are essential for determining reliability of the predicted PK values, and fixed values derived from physiological factors (i.e. 0.75 for CLt and 1.0 for Vss) are generally used. However, better predictive performances could be obtained by using optimal scaling exponents for a certain set of test compounds or specific experimental conditions (Mahmood Citation2010). In a previous study, human CLt and Vss values of 24 model compounds were predicted using groups of EM and PM marmosets (Matsumoto et al. Citation2021). Marmoset CYP2C19 was responsible for the metabolism of human CYP2C8/9/19 substrates, and among the set of 24 compounds, 11 were metabolised, at least in part by human CYP2C8/9/19. Floating exponents of 0.648 and 0.872 provided the highest predictability for human CLt and Vss in the PM marmoset group, respectively. As far as prediction of human CLh using cynomolgus monkeys is concerned, Tess et al. (Citation2020) reported good predictive performance for the CLh of 27 acidic and zwitterionic compounds, including valsartan, with a floating exponent of 0.5. We also reported that an allometric exponent of 0.597 was suitable for the prediction of CLt of 15 selected compounds using macaque monkeys (Matsumoto et al. Citation2021).
In the present study using PM marmosets, CLt, pred values of valsartan and eprosartan were favourably predicted using the tentatively proposed exponent value of 0.65 (Matsumoto et al. Citation2021). In contrast, the fixed exponent of 0.75 gave better predictability of losartan and telmisartan. However, the underestimation of CLt values of losartan and telmisartan by the floating exponent was acceptable for positioning the CLt, pred value of valsartan in comparison with the other compounds assumed as competitive candidates. The tentatively proposed exponent value of 0.87 for PM marmosets was used for the prediction of human Vss (Matsumoto et al. Citation2021). Although the Vss, pred value of valsartan was two times lower than the reported value with the floating exponent, the result roughly suggested that valsartan possessed relatively low human Vss values, similar to eprosartan and losartan.
Correction of observed CLt and Vss values by the ratios of plasma unbound fraction would theoretically improve predictive performance. However, in the previous study (Matsumoto et al. Citation2021), the average absolute fold error (AAFE) values for CLt and Vss in PM marmosets conversely increased from 2.0 and 1.6 to 2.1 and 1.7 based on unbound plasma concentrations, respectively. Similar results were observed in the prediction of human CLt and Vss values of 30 model compounds using the SSS method in rats and monkeys (Miyamoto et al. Citation2017). Therefore, in the present study, we did not take the correction of the observed PK parameters of the four compounds by plasma free fraction ratios into consideration.
The CLt and Vss values are important determinants of t1/2. The relevance of the t1/2, pred values (using the floating exponents (a = 0.65, b = 0.87)) to the dosage regimens in clinical practice is discussed below.
Valsartan and telmisartan
The t1/2, pred values of valsartan and telmisartan (10.0 and 22.9 h, respectively) suggested that the two compounds would exhibit elimination t1/2 values suitable for once daily dosing with oral drugs (generally 12–48 h, Smith et al. Citation2018). The low CLt value of valsartan contributed to its high t1/2 value, while the t1/2 value of telmisartan, which exhibited the highest CLt value, might be enhanced by the significantly high Vss value, indicating extensive distribution into the tissue compartment (Stangier et al. Citation2000b). According to the t1/2 values, valsartan should be administered once or twice daily (Anand et al. Citation2010), and telmisartan should be administered orally once daily (McClellan and Markham Citation1998) in clinical practice.
Eprosartan
The predicted t1/2 value of eprosartan in the present study was 4.7 h, whereas the t1/2, obs value of this drug was approximately 2 h following intravenous administration in a clinical study (). However, Tenero et al. (Citation1998) reported that the terminal t1/2 value of eprosartan following oral administration was 5–7 h in humans. The longer t1/2, obs after oral administration than that after intravenous injection was considered to be due to the detection of an additional elimination phase or absorption rate-limited elimination. In the present study, the human CLt and Vss values of eprosartan were reasonably predicted (), and elimination t1/2 values after intravenous administration may be greater than 2 h. In fact, eprosartan is administered orally once or twice per day for the treatment of hypertension (Hedner and Himmelmann Citation1999).
Losartan
The t1/2, pred value of 2.8 h for losartan suggests that this drug might be eliminated rapidly in humans. Although the t1/2, obs of losartan following intravenous administration was only 2.1 h (Lo et al. Citation1995), this drug is also administered orally once per day in clinical practice (Kirsten et al. Citation1998). This is likely possible due to the formation of the pharmacologically more active metabolite, E3174, compensating for the short t1/2 of the parent drug (Ohtawa et al. Citation1993; Zaidenstein et al. Citation2001; Li et al. Citation2009).
The Fpo, obs values of valsartan, eprosartan, losartan, and telmisartan were reported to be 0.39, 0.13, 0.33, and 0.43–0.47 in humans, respectively (). Following oral administration of these compounds to PM marmosets, smaller or comparative Fpo values were obtained (). Fpo is defined as Fpo = Fa × Fg × Fh (Fa, Fg, and Fh are the fraction absorbed, intestinal availability, and hepatic availability, respectively). Although Fh can be estimated from the CLt value, if extra-CLh and a blood-to-plasma concentration ratio are available, Fa and Fg cannot be predicted by the present study alone. However, the Fpo value of 0.19 and early onset of Cmax observed in marmosets () suggest that valsartan could be administered orally to humans.
In the present study, commercially available drugs with known human PK data were used as assumed competitive candidates. When the present screening system is applied to new chemical entities in the stage of candidate selection, coadministration of a marker drug, which is known to exhibit a favourable PK profile in humans, would be beneficial.
The MIST guidelines request that pivotal toxicology studies cover safety of human-specific or disproportionate metabolites before initiating large-scale clinical studies (European Medicines Agency Citation2009; U.S. Food and Drug Administration Citation2016). If these human metabolites are found after entering the first-in-man studies, various countermeasures are required, as demonstrated by the six case studies introduced in the cross-industry review (Schadt et al. Citation2018). As valsartan was developed before implementation of the MIST guidelines, this issue might not have been considered. Therefore, in the present study, we conducted comparative in vitro metabolic studies using isolated hepatocytes from various animal species and humans.
According to the drug approval package of valsartan (Food and Drug Administration Citation1996), incubation of 14C-labelled valsartan with rat hepatocytes and liver slices gave an acyl glucuronide of valsartan as the predominant metabolite, which might correspond to M2 in the present study. In contrast, Huskey et al. (Citation1993) reported formation of tetrazole N-glucuronides of three biphenyl tetrazole-containing angiotensin II receptor antagonists using liver microsomes from rats, dogs, monkeys, and humans. Therefore, M3 may have been an N-glucuronide of valsartan conjugated at the biphenyl tetrazole moiety. No distinct valsartan metabolites were reportedly found in vivo in dogs (Food and Drug Administration Citation1996). In the present study, the metabolic pattern of this species in vitro was comparable to that of rat hepatocytes; however, formation of M2 and M3 was relatively low, as was the case in cynomolgus monkeys.
The two glucuronides of valsartan were also generated in marmosets and human hepatocytes. Soars et al. (Citation2001) conducted an in vitro glucuronidation study of a wide range of compounds using microsomes prepared from marmoset livers and kidneys and concluded that marmosets might be an alternative animal model for human drug glucuronidation. Recently, 11 cDNAs of marmoset UDP-glucuronosyltransferases (UGTs) were isolated and characterised. Marmoset UGT1As were found to have high sequence identity with human UGT1As (Uno et al. Citation2020). However, which UGT isozymes are responsible for the formation of M2 and M3 remains unknown.
Although metabolism was not the major elimination route for valsartan and it was mainly eliminated by biliary excretion as described above, the important route of metabolism in humans was 4-hydroxylation (). Judging from the ratio of the proton signals attached at the newly created chiral carbon atom of the metabolite isolated from human urine (1H-NMR spectrum, signals at 1.1 and 1.2 ppm), the diastereomer ratio of the metabolite was approximately 3:2 (Waldmeier et al. Citation1997). Taavitsainen et al. (Citation2000) reported that inhibitory effect of valsartan on the human CYP2C9 was weak (the Ki value for tolbutamide methylhydroxylation was 135 μM). In the incubation studies, a substrate concentration of 100 μM was chosen to allow comprehensive detection of the valsartan metabolites based on the UV response. Selected ion monitoring using LC-QTOF-MS with substrate concentrations of 10 and 100 μM was also performed, and similar results were obtained supporting the weak inhibitory effects of valsartan (data not shown). Consequently, the Rt of synthesised 4-hydroxyvalsartan (1:1 mixture of diastereomers) in the HPLC chromatograms corresponded with those of M1, and mass spectra of the isolated metabolites reasonably elucidated the chemical structure. Although further studies are necessary to determine the diastereomeric ratio, the major metabolite of valsartan in marmosets was also considered to be 4-hydroxyvalsartan. The results of in vitro metabolite cross-species comparison using isolated hepatocytes from rats, dogs, marmosets, cynomolgus monkeys, and humans suggested that marmosets are the animal species with the greatest relevance to humans for valsartan. Similar observations were made in the metabolism of the selective inhibitor of sodium-glucose cotransporter 2, YM543 (Nakada Citation2017). Following oral administration of YM543, 5-hydroxyazulene-2′-O-β-glucuronide conjugate of YM543 was found in humans and chimeric mice with humanised liver. However, the metabolite was not detected in the plasma and urine samples from conventional experimental animals such as mice, rats, golden hamsters, guinea pigs, rabbits, beagle dogs, rhesus monkeys and cynomolgus monkeys excluding those from marmosets.
The human mass balance study using 14C-labelled valsartan revealed that M1 comprised more than 11% of the AUC of the total plasma radioactivity following a single oral administration (Waldmeier et al. Citation1997). Therefore, if the MIST guidelines had been implemented at the time of approval, the ratio of M1 may have exceeded 10% of the total exposure after repeated administration, and M1 would have been identified as the metabolite whose safety should have been confirmed before initiation of the large-scale clinical studies. Iriarte et al. (Citation2007) demonstrated the plasma concentration of M1 in 12 different patients with hypertension who were treated with a daily dose of 80 or 160 mg of valsartan. Blood samples were taken once from each patient at different time points (0.5–9 h), and the observed concentration values ranged from 25 to 380 ng/mL. In the present study, the Cmax value of M1 at 4 h was 355.3 ng/mL following a single oral administration of 30 mg/kg of valsartan to a PM marmoset. As stated above, approximately 20% of valsartan was primarily converted to M1 by CYP2C9 in humans. If marmoset CYP2C19 was responsible for the formation of M1, higher levels of M1 in plasma might be observed after oral administration of the same dose of valsartan to EM marmosets, or those with heterozygous amino acid sequences (see ‘Materials and Methods’ section). Because of the different experimental conditions, these plasma concentration values cannot be directly compared between marmosets and humans. However, exposure levels of marmosets to M1 in the toxicity study dosed with the maximum no-effect dose level of 60 mg/kg once daily for 14 days (Drug Approval Package, Food and Drug Administration Citation1996) might exceed the plasma levels of M1 in the clinical study, thereby confirming the safety of M1 in humans.
Conclusion
In this comparative retrospective PK study with three assumed competitor drugs using PM marmosets and their floating scaling exponents of 0.65 and 0.87 for CLt, pred and Vss, pred, respectively, valsartan was suggested to have favourable PK properties in humans. Only marmoset hepatocytes exhibited a metabolic profile with valsartan similar to that of humans, and a certain level of the major human metabolite was found in marmoset plasma, supporting safety evaluation of this metabolite in toxicity studies. These results suggest that marmosets could be a useful animal species for new drug development.
Acknowledgements
We thank Mses. Rie Nishii, Megumi Nishiwaki and Machiko Hattori of CLEA Japan for supporting this research.
Disclosure statement
HK, HI, SM, KK, and KF are employees of CLEA Japan, Inc., the contract research organisation and breeder of common marmosets. The other authors have no interests to declare.
References
- Anand IS, Deswal A, Kereiakes DJ, Purkayastha D, Zappe DH. 2010. Comparison of once-daily versus twice-daily dosing of valsartan in patients with chronic stable heart failure. Vasc Health Risk Manag. 6:449–455.
- Bottorff MB, Tenero DM. 1999. Pharmacokinetics of eprosartan in healthy subjects, patients with hypertension, and special populations. Pharmacotherapy. 19(4 Pt 2):73S–78S.
- Criscione L, Bradley WA, Bühlmayer P, Whitebread S, Glazer R, Lloyd P, Mueller P, Gasparo M. 1995. Valsartan: preclinical and clinical profile of an antihypertensive angiotensin-II antagonist. Cardiovasc Drug Rev. 13(3):230–250.
- Di L, Feng B, Goosen TC, Lai Y, Steyn SJ, Varma MV, Obach RS. 2013. A perspective on the prediction of drug pharmacokinetics and disposition in drug research and development. Drug Metab Dispos. 41(12):1975–1993.
- European Medicines Agency. 2009. ICH topic M3 (R2) non-clinical safety studies for the conduct of human clinical trials and marketing authorization for pharmaceuticals. London (UK): European Medicines Agency.
- Flesch G, Müller P, Lloyd P. 1997. Absolute bioavailability and pharmacokinetics of valsartan, an angiotensin II receptor antagonist, in man. Eur J Clin Pharmacol. 52(2):115–120.
- Food and Drug Administration. 1996. Drug Approval Package: Diovan (Valsartan) NDA#020665, Review and evaluation of pharmacology and toxicology data. https://www.accessdata.fda.gov/drugsatfda_docs/nda/pre96/020665_s000.pdf. (CDER’s historical data file)
- Food and Drug Administration. 2016. Guidance for industry: safety testing of drug metabolites. Silver Spring (MD): US Department Health and Human Services FaDA, Center for Drug Evaluation and Research.
- Göktaş MT, Pepedil F, Karaca Ö, Kalkışım S, Cevik L, Gumus E, Guven GS, Babaoglu MO, Bozkurt A, Yasar U. 2016. Relationship between genetic polymorphisms of drug efflux transporter MDR1 (ABCB1) and response to losartan in hypertension patients. Eur Rev Med Pharmacol Sci. 20(11):2460–2467.
- Hamid KA, Lin Y, Gao Y, Katsumi H, Sakane T, Yamamoto A. 2009. The effect of Wellsolve, a novel solubilizing agent, on the intestinal barrier function and intestinal absorption of griseofulvin in rats. Biol Pharm Bull. 32(11):1898–1905.
- Hedner T, Himmelmann A. 1999. The efficacy and tolerance of one or two daily doses of eprosartan in essential hypertension. J Hypertens. 17(1):129–136.
- Hirvensalo P, Tornio A, Launiainen T, Paile‐Hyvärinen M, Tapaninen T, Neuvonen M, Backman JT, Niemi M. 2020. UGT1A3 and sex are major determinants of telmisartan pharmacokinetics-a comprehensive pharmacogenomic study. Clin Pharmacol Ther. 108(4):885–895.
- Holwerda NJ, Fogari R, Angeli P, Porcellati C, Hereng C, Oddou-Stock P, Heath R, Bodin F. 1996. Valsartan, a new angiotensin II antagonist for the treatment of essential hypertension: efficacy and safety compared with placebo and enalapril. J Hypertens. 14(9):1147–1151.
- Hosea NA, Collard WT, Cole S, Maurer TS, Fang RX, Jones H, Kakar SM, Nakai Y, Smith BJ, Webster R, et al. 2009. Prediction of human pharmacokinetics from preclinical information: comparative accuracy of quantitative prediction approaches. J Clin Pharmacol. 49(5):513–533.
- Hughes JP, Rees S, Kalindjian SB, Philpott KL. 2011. Principles of early drug discovery. Br J Pharmacol. 162(6):1239–1249.
- Huskey SE, Miller RR, Chiu SH. 1993. N-glucuronidation reactions. I. Tetrazole N-glucuronidation of selected angiotensin II receptor antagonists in hepatic microsomes from rats, dogs, monkeys, and humans. Drug Metab Dispos. 21(5):792–799.
- Iriarte G, Ferreirós N, Ibarrondo I, Alonso RM, Maguregui MI, Jiménez RM. 2007. Biovalidation of an SPE-HPLC-UV-fluorescence method for the determination of valsartan and its metabolite valeryl-4-hydroxy-valsartan in human plasma. J Sep Sci. 30(14):2231–2240.
- Jones RD, Jones HM, Rowland M, Gibson CR, Yates JWT, Chien JY, Ring BJ, Adkison KK, Ku MS, He H, et al. 2011. PhRMA CPCDC initiative on predictive models of human pharmacokinetics, part 2: comparative assessment of prediction methods of human volume of distribution. J Pharm Sci. 100(10):4074–4089.
- Kirsten R, Nelson K, Kirsten D, Heintz B. 1998. Clinical pharmacokinetics of vasodilators. Part I. Clin Pharmacokinet. 34(6):457–482.
- Korte S, Everitt J. 2019. The common marmoset in captivity and biomedical research. American College of Laboratory Animal Medicine. Cambridge (MA): Academic Press. Chapter 27. In: The use of the marmoset in toxicity testing and nonclinical safety assessment studies; p. 493–513.
- Kusama T, Toda A, Shimizu M, Uehara S, Inoue T, Uno Y, Utoh M, Sasaki E, Yamazaki H. 2018. Association with polymorphic marmoset cytochrome P450 2C19 of in vivo hepatic clearances of chirally separated R-omeprazole and S-warfarin using individual marmoset physiologically based pharmacokinetic models. Xenobiotica. 48(10):1072–1077.
- Layne DG, Power RA. 2003. Husbandry, handling, and nutrition for marmosets. Comp Med. 53(4):351–359.
- Li Z, Wang G, Wang L-S, Zhang W, Tan Z-R, Fan L, Chen B-L, Li Q, Liu J, Tu J-H, et al. 2009. Effects of the CYP2C9*13 allele on the pharmacokinetics of losartan in healthy male subjects. Xenobiotica. 39(10):788–793.
- Lo MW, Goldberg MR, McCrea JB, Lu H, Furtek CI, Bjornsson TD. 1995. Pharmacokinetics of losartan, an angiotensin II receptor antagonist, and its active metabolite EXP3174 in humans. Clin Pharmacol Ther. 58(6):641–649.
- Mahmood I. 2010. Theoretical versus empirical allometry: facts behind theories and application to pharmacokinetics. J Pharm Sci. 99(7):2927–2933.
- Matsumoto S, Uehara S, Kamimura H, Ikeda H, Maeda S, Hattori M, Nishiwaki M, Kato K, Yamazaki H. 2021. Human total clearance values and volumes of distribution of typical human cytochrome P450 2C9/19 substrates predicted by single-species allometric scaling using pharmacokinetic data sets in common marmosets genotyped for P450 2C19. Xenobiotica. 51(4):479–493.
- McClellan KJ, Markham A. 1998. Telmisartan. Drugs. 56(6):1039–1044.
- Miyamoto M, Iwasaki S, Chisaki I, Nakagawa S, Amano N, Hirabayashi H. 2017. Comparison of predictability for human pharmacokinetics parameters among monkeys, rats, and chimeric mice with humanised liver. Xenobiotica. 47(12):1052–1063.
- Miyamoto M, Iwasaki S, Chisaki I, Nakagawa S, Amano N, Kosugi Y, Hirabayashi H. 2019. Prediction of human pharmacokinetics of long half-life compounds using chimeric mice with humanised liver. Xenobiotica. 49(12):1379–1387.
- Mochizuki H, Murota N, Sato S, Nii K, Kouhei Y, Taniguchi M, Inoue R, Nishime C, Tsutsumi H. 2018. Approaches of validation of a 2-week combined repeated oral dose toxicity study with plasma micro sampling toxicokinetics (PMS-TK) in common marmosets. J Toxicol Sci. 43(11):685–695.
- Nagilla R, Nord M, McAtee JJ, Jolivette LJ. 2011. Cassette dosing for pharmacokinetic screening in drug discovery: comparison of clearance, volume of distribution, half-life, mean residence time, and oral bioavailability obtained by cassette and discrete dosing in rats. J Pharm Sci. 100(9):3862–3874.
- Nakada N. 2017. Evaluation of the utility of chimeric mice with humanized livers for the characterization and profiling of the metabolites of a selective inhibitor (YM543) of the sodium-glucose cotransporter 2. Pharm Res. 34(4):874–886.
- Nakashima A, Kawashita H, Masuda N, Saxer C, Niina M, Nagae Y, Iwasaki K. 2005. Identification of cytochrome P450 forms involved in the 4-hydroxylation of valsartan, a potent and specific angiotensin II receptor antagonist, in human liver microsomes. Xenobiotica. 35(6):589–602.
- Ohtawa M, Takayama F, Saitoh K, Yoshinaga T, Nakashima M. 1993. Pharmacokinetics and biochemical efficacy after single and multiple oral administration of losartan, an orally active nonpeptide angiotensin II receptor antagonist, in humans. Br J Clin Pharmacol. 35(3):290–297.
- Orsi A, Rees D, Andreini I, Venturella S, Cinelli S, Oberto G. 2011. Overview of the marmoset as a model in nonclinical development of pharmaceutical products. Regul Toxicol Pharmacol. 59(1):19–27.
- Poirier A, Cascais AC, Funk C, Lavé T. 2009. Prediction of pharmacokinetic profile of valsartan in humans based on in vitro uptake-transport data. Chem Biodivers. 6(11):1975–1987.
- Prior H, Haworth R, Labram B, Roberts R, Wolfreys A, Sewell F. 2020. Justification for species selection for pharmaceutical toxicity studies. Toxicol Res (Camb)). 9(6):758–770.
- Riede J, Poller B, Umehara K, Huwyler J, Camenisch G. 2016. New IVIVE method for the prediction of total human clearance and relative elimination pathway contributions from in vitro hepatocyte and microsome data. Eur J Pharm Sci. 86:96–102.
- Ring BJ, Chien JY, Adkison KK, Jones HM, Rowland M, Jones RD, Yates JWT, Ku MS, Gibson CR, He H, et al. 2011. PhRMA CPCDC initiative on predictive models of human pharmacokinetics, part 3: comparative assessment of prediction methods of human clearance. J Pharm Sci. 100(10):4090–4110.
- Schadt S, Bister B, Chowdhury SK, Funk C, Hop CECA, Humphreys WG, Igarashi F, James AD, Kagan M, Khojasteh SC, et al. 2018. A decade in the MIST: Learnings from investigations of drug metabolites in drug development under the “Metabolites in Safety Testing” regulatory guidance. Drug Metab Dispos. 46(6):865–878.
- Smith D, Trennery P, Farningham D, Klapwijk J. 2001. The selection of marmoset monkeys (Callithrix jacchus) in pharmaceutical toxicology. Lab Anim. 35(2):117–130.
- Smith DA, Beaumont K, Maurer TS, Li D. 2018. Relevance of half-life in drug design. J Med Chem. 61(10):4273–4282.
- Soars MG, Riley RJ, Burchell B. 2001. Evaluation of the marmoset as a model species for drug glucuronidation. Xenobiotica. 31(12):849–860.
- Son YW, Choi HN, Che JH, Kang BC, Yun JW. 2020. Advances in selecting appropriate non-rodent species for regulatory toxicology research: policy, ethical, and experimental considerations. Regul Toxicol Pharmacol. 116:104757.
- Stangier J, Schmid J, Türck D, Switek H, Verhagen A, Peeters PA, van Marle SP, Tamminga WJ, Sollie FA, Jonkman JH. 2000a. Absorption, metabolism, and excretion of intravenously and orally administered [14C]telmisartan in healthy volunteers. J Clin Pharmacol. 40(12 Pt):1):1312–1322.
- Stangier J, Su CA, Roth W. 2000b. Pharmacokinetics of orally and intravenously administered telmisartan in healthy young and elderly volunteers and in hypertensive patients. J Int Med Res. 28(4):149–167.
- Sun P, Wang C, Liu Q, Meng Q, Zhang A, Huo X, Sun H, Liu K. 2014. OATP and MRP2-mediated hepatic uptake and biliary excretion of eprosartan in rat and human. Pharmacol Rep. 66(2):311–319.
- Taavitsainen P, Kiukaanniemi K, Pelkonen O. 2000. In vitro inhibition screening of human hepatic P450 enzymes by five angiotensin-II receptor antagonists. Eur J Clin Pharmacol. 56(2):135–140.
- Tenero D, Martin D, Ilson B, Jushchyshyn J, Boike S, Lundberg D, Zariffa N, Boyle D, Jorkasky D. 1998. Pharmacokinetics of intravenously and orally administered eprosartan in healthy males: absolute bioavailability and effect of food. Biopharm Drug Dispos. 19(6):351–356.
- Tess DA, Eng H, Kalgutkar AS, Litchfield J, Edmonds DJ, Griffith DA, Varma MVS. 2020. Predicting the human hepatic clearance of acidic and zwitterionic drugs. J Med Chem. 63(20):11831–11844.
- Uehara S, Uno Y, Inoue T, Kawano M, Shimizu M, Toda A, Utoh M, Sasaki E, Yamazaki H. 2016. Individual differences in metabolic clearance of S-warfarin efficiently mediated by polymorphic marmoset cytochrome P450 2C19 in livers. Drug Metab Dispos. 44(7):911–915.
- Uno Y, Uehara S, Inoue T, Kawamura S, Murayama N, Nishikawa M, Ikushiro S, Sasaki E, Yamazaki H. 2020. Molecular characterization of functional UDP-glucuronosyltransferases 1A and 2B in common marmosets. Biochem Pharmacol. 172:113748.
- Wajima T, Yano Y, Fukumura K, Oguma T. 2004. Prediction of human pharmacokinetic profile in animal scale up based on normalizing time course profiles. J Pharm Sci. 93(7):1890–1900.
- Waldmeier F, Flesch G, Müller P, Winkler T, Kriemler HP, Bühlmayer P, De Gasparo M. 1997. Pharmacokinetics, disposition and biotransformation of [14C]-radiolabelled valsartan in healthy male volunteers after a single oral dose. Xenobiotica. 27(1):59–71.
- White RE, Manitpisitkul P. 2001. Pharmacokinetic theory of cassette dosing in drug discovery screening. Drug Metab Dispos. 29(7):957–966.
- Williamson KM, Patterson JH, McQueen RH, Adams KF Jr, Pieper JA. 1998. Effects of erythromycin or rifampin on losartan pharmacokinetics in healthy volunteers. Clin Pharmacol Ther. 63(3):316–323.
- Yamada A, Maeda K, Ishiguro N, Tsuda Y, Igarashi T, Ebner T, Roth W, Ikushiro S, Sugiyama Y. 2011. The impact of pharmacogenetics of metabolic enzymes and transporters on the pharmacokinetics of telmisartan in healthy volunteers. Pharmacogenet Genomics. 21(9):523–530.
- Yamashiro W, Maeda K, Hirouchi M, Adachi Y, Hu Z, Sugiyama Y. 2006. Involvement of transporters in the hepatic uptake and biliary excretion of valsartan, a selective antagonist of the angiotensin II AT1-receptor, in humans. Drug Metab Dispos. 34(7):1247–1254.
- Zaidenstein R, Soback S, Gips M, Avni B, Dishi V, Weissgarten Y, Golik A, Scapa E. 2001. Effect of grapefruit juice on the pharmacokinetics of losartan and its active metabolite E3174 in healthy volunteers. Ther Drug Monit. 23(4):369–373.
- Zühlke U, Weinbauer G. 2003. The common marmoset (Callithrix jacchus) as a model in toxicology. Toxicol Pathol. 31(Suppl):123–127.