
 ?Mathematical formulae have been encoded as MathML and are displayed in this HTML version using MathJax in order to improve their display. Uncheck the box to turn MathJax off. This feature requires Javascript. Click on a formula to zoom.
Abstract
In vitro incubation of the bacterial β-glucuronidase inhibitor UNC10201652 (4-(8-(piperazin-1-yl)-1,2,3,4-tetrahydro-[1,2,3]triazino[4',5':4,5]thieno[2,3-c]isoquinolin-5-yl)morpholine) with mouse, rat, and human liver microsomes and hepatocytes generated metabolites at multiple sites via deethylations, oxidations and glucuronidation.
Two UNC10201652 metabolites were detected in human, and four in mouse and rat liver microsomal incubations. Intrinsic clearances of UNC10201652 in human, mouse, and rat liver microsomes were 48.1, 115, and 194 µL/min/mg respectively.
Intrinsic clearances for human, mouse, and rat hepatocytes were 20.9, 116, and 140 µL/min/106 cells respectively and 24 metabolites were characterised: 9 for human and 11 for both rodent species.
Plasma clearance was 324.8 mL/min/kg with an elimination half-life of 0.66 h following IV administration of UNC10201652 to Swiss Albino mice (3 mg/kg). Pre-treatment with 1-aminobenzotriazole (ABT) decreased clearance to 127.43 mL/min/kg, increasing the t1/2 to 3.66 h.
Comparison of profiles after oral administration of UNC10201652 to control and pre-treated mice demonstrated a large increase in Cmax (from 15.2 ng/mL to 184.0 ng/mL), a delay in Tmax from 0.25 to 1 h and increased AUC from 20.1 to 253 h ng/ml. ABT pre-treatment increased oral bioavailability from 15% to >100% suggesting that CYP450's contributed significantly to UNC10201652 clearance in mice.
Introduction
Our understanding of the role of conjugates in the disposition and detoxication of drugs and xenobiotics has evolved significantly since these biotransformations were first described. Originally designated as a means to inactivate compounds and facilitate excretion, our more nuanced understanding of their effects includes the potential for bioactivation and toxicity. In particular, a number of the adverse drug reactions (ADRs) observed with carboxylic acid-containing non-steroidal anti-inflammatory drugs (NSAIDs) (Allison et al. Citation1992; Bjarnason et al. Citation1993) have been attributed to the chemical reactivity of their acyl glucuronides which, after excretion in the bile were at one time thought to directly damage the gut mucosa (e.g. see Boelsterli and Ramirez-Alcantara Citation2011). However, it now seems clear that this toxicity was in fact due to the release of the pharmacologically active aglycone, which can be blocked (at least in rodents) using novel, and specific gut commensal bacterial β-glucuronidase (GUS) inhibitors (LoGuidice et al. Citation2012; Saitta et al. Citation2014). Even where the glucuronides themselves are benign they can still act as a ‘prodrug’ (or actually a protoxin) that results in significant toxicity at a particular site. Thus, the dose-limiting gut toxicity of the anticancer drug irinotecan has been attributed to the hydrolysis of the glucuronide of its hydroxylated active metabolite (SN38), following excretion in the bile, by bacterial β-glucuronidases (Takasuna et al.Citation1996). Studies in rodent models using specific bacterial β-glucuronidase inhibitors have also shown highly beneficial effects that can mitigate/eliminate gut toxicity by preventing the hydrolysis of both NSAID acyl glucuronides and the ether glucuronide of SN38 (e.g. Wallace et al. Citation2010; Bhatt et al. Citation2020).
However, whilst the pharmacological effectiveness of these GUS inhibitors in rodent models has now been established, much less is known concerning the metabolic fate of these compounds in mammalian systems. We have therefore performed in vitro metabolism studies on the GUS inhibitor UNC10201652 ((4-(8-(piperazin-1-yl)-1,2,3,4-tetrahydro-[1,2,3]triazino[4′,5′:4,5]-thieno[2,3-c] isoquinolin-5-yl)morpholine in mouse, rat and human microsomes and hepatocytes. In addition, preliminary in vivo pharmacokinetic studies (with and without predosing with 1-aminobenzotriazole (ABT)) have been undertaken in the mouse as described below.
Materials and methods
Chemicals and reagents
UNC10201652, (4-(8-(piperazin-1-yl)-1,2,3,4-tetrahydro-[1,2,3]triazino[4′,5′:4,5]thieno[2,3-c]isoquinolin-5-yl)morpholine, (Inh 9), was synthesised by the authors as described elsewhere (Pellock et al. Citation2018).
Reduced nicotinamide adenine dinucleotide phosphate (NADPH) was purchased from Roche Diagnostics (Mannheim, Germany). Diazepam, diphenhydramine, dextromethorphan, verapamil, Williams E media, l-glutamine, HEPES, non-essential amino acids, lucifer yellow, umbelliferone, metoprolol, raloxifene, atenolol, antipyrine, oestrone 3-sulfate, elacridar, MK-571 and warfarin were purchased from Sigma-Aldrich (St. Louis, MO). Talinolol was purchased from Toronto Research Chemicals (Toronto, ON, Canada).
Dimethyl sulphoxide (DMSO), Hanks balanced salt solution (GibcoTM HBSS; containing CaCl2 and MgCl2), Dulbecco’s modified eagle medium (GibcoTM DMEM; high glucose with GlutaMax and pyruvate), foetal bovine serum (GibcoTM; heat inactivated), ammonium formate, formic acid, acetonitrile (ACN) and methanol (MeOH) used for in vitro profiling were purchased from Fisher Scientific (Loughborough, UK). ACN for plasma analysis was from RCI Labscan, Bangkok, Thailand with 0.1% aqueous formic acid sourced from Fluka, Fair Lawn, NJ.
N-Methyl pyrrolidone, polyethylene glycol (PEG-400), sodium carboxymethyl cellulose (NaCMC,) Tween-80 and ABT were obtained from Sigma-Aldrich (St. Louis, MO).
Pooled male ICR/CD-1 mouse microsomes (MuLM), pooled mixed gender human hepatocytes, pooled male ICR/CD-1 mouse hepatocytes, pooled male Sprague Dawley rat hepatocytes, pooled male ICR/CD-1 mouse plasma and pooled male Sprague Dawley rat plasma were purchased from BioIVT (Brussels, Belgium). Pooled mixed gender human liver microsomes (HLM) and male Sprague Dawley rat liver microsomes (RLM) were purchased from Corning (Woburn, MA). Pooled mixed gender human plasma was purchased from Research Donors Ltd (London, UK).
Millicell-96 multiwell cell culture insert plates (with polycarbonate membranes; 0.4 μm pore size, 0.12 cm2 surface area) and Millicell 96-well transport companion plates were purchased from Millipore (Watford, UK).
Caco-2 cells (HTB37, supplied at passage number 17) were obtained from American Type Culture Collection.
In vitro metabolic stability and metabolism studies
Liver microsomal metabolic stability
UNC10201652 (1 µM) was incubated with human, mouse and rat liver microsomes at a final protein concentration of 0.5 mg/mL in 0.1 M phosphate buffer pH 7.4. The final DMSO concentration in the incubation was 0.25%. Samples were pre-incubated at 37 °C with NADPH (at a final concentration of 1 mM) added to initiate the reaction. A control incubation, with NADPH replaced with 0.1 M (pH 7.4) phosphate buffer, was also performed. Two positive control compounds were incubated in addition to UNC10201652 for each species (human, dextromethorphan and verapamil; mouse and rat, diazepam and diphenhydramine). All incubations were performed on the individual test compounds.
UNC10201652 was incubated with NADPH for 0, 5, 15, 30 and 45 min (the control incubation without NADPH was 45 min only) with incubations terminated by transferring one volume of incubate into three volumes of acetonitrile (1:3 v/v). The precipitated proteins were removed by centrifugation at 1530g for 30 min at 4 °C.
For determination of the intrinsic clearance (CLint) of UNC10201652, an aliquot (50 μL) of the supernatant was diluted with 50 μL of deionised water containing 0.55 μM metoprolol which was employed as an internal standard. For the metabolite identification studies (see below), 80 μL of the supernatant was diluted with 80 μL of deionised water.
Hepatocyte metabolic stability
UNC10201652 was incubated with cryopreserved human, mouse and rat hepatocytes in Williams E media supplemented with 2 mM l-glutamine and 25 mM HEPES at a final substrate concentration of 1 µM (final DMSO concentration 0.25%). The medium was pre-incubated at 37 °C prior to the addition of a suspension of hepatocytes at a final cell density 0.5 × 10⁶ viable cells/mL to initiate the reaction. The final incubation volume was 500 µL. Two control compounds (human, verapamil and umbelliferone; mouse, verapamil and raloxifene; rat, verapamil and umbelliferone) were included with each species, alongside an appropriate vehicle control. The reactions were stopped by transferring 40 µL of incubate to 120 µL acetonitrile at the appropriate time points (0, 10, 20, 40, 60 and 120 min). The termination plates were centrifuged at 1530g at 4 °C for 30 min to precipitate the protein. For determination of the CLint of UNC10201652, 25 μL of supernatant was diluted with 25 μL of deionised water containing internal standard (0.55 μM metoprolol). For the metabolite identification studies, 80 μL of supernatant was diluted with 80 μL of deionised water.
Determination of plasma protein binding and fraction unbound in the incubation
In order to measure the extent of binding of UNC10201652 to plasma and microsomal protein, UNC10201652 was added into either plasma or microsomes at a concentration of 2 µM (containing 0.5% DMSO v/v). For these experiments, undiluted pooled mixed gender human, male mouse CD-1 and male rat Sprague Dawley plasma and 0.5 mg/mL human, mouse and rat liver microsomes were used. Buffer (0.1 M phosphate, pH 7.4) was prepared containing 0.5% DMSO v/v to ensure the experiment was maintained at 0.5% final DMSO concentration. The experiment was performed using a Rapid Equilibrium Dialysis (RED) device, with the two compartments separated by a semi permeable membrane. Buffer was added to one side of the membrane and the plasma or microsomal initial solution to the other side. The incubations were performed in triplicate. The RED device and the plasma initial solutions were incubated for 4 h at 37 °C at 5% CO2, with agitation at 128 g to allow the system to reach equilibrium. After equilibration, samples were taken from both sides of the membrane and the plasma initial solutions. Calibration curves were prepared in blank plasma and blank buffer, both containing 0.5% DMSO concentration v/v. The samples and standards were precipitated with 3 volumes of acetonitrile containing internal standard and centrifuged (1280g, 30 min, 4 °C). Supernatant was then diluted with water prior to LC-MS/MS analysis. A control compound was included per matrix in each experiment (amitriptyline for microsomes; warfarin for plasma).
Caco-2 permeability
Caco-2 cells were used between passage numbers 50–60. Cells were seeded onto Millicell-96 multiwell insert plates at 1 × 10⁵ cells/cm2. The cells were cultured in cell culture medium (DMEM supplemented with 10% (w/v) foetal bovine serum, 2 mmol/L l-glutamine, 1% (v/v) nonessential amino acids, 50 U/mL penicillin and 50 μg/mL streptomycin) at 37 °C in an atmosphere of 5% CO2 with a relative humidity of 95%. Media was changed every 2 or 3 days and on day 20, the permeability study was performed. Cell monolayers were prepared by rinsing both apical and basolateral surfaces twice with prewarmed (37 °C) assay buffer (Hanks Balanced Salt Solution containing 25 mmol/L HEPES and 4.45 mmol/L glucose, pH 7.4). Cells were then preincubated with assay buffer in the apical and basolateral compartments for 40 min at 37 °C to stabilise physiological parameters.
At the end of the preincubation period, donor solutions of assay buffer containing 10 µM UNC10201652 with or without an inhibitor mix were added to the relevant apical and basolateral donor compartments. The inhibitor mix consisted of 10 μM elacridar and 100 μM MK-571 (inhibitors of P-gp and BCRP, and BCRP and MRP-2, respectively). Donor solutions also contained the fluorescent integrity marker lucifer yellow (100 μmol/L). Assay buffer containing DMSO or inhibitor mix was added to the corresponding receiver compartments. The final DMSO concentration of donor and receiver solutions was ≤1% v/v. The bidirectional [apical-to-basolateral (A-B) and basolateral-to-apical (B-A)] apparent permeability (Papp) of UNC10201652 was assessed in duplicate. Four positive control compounds were also included in the experiments: atenolol, antipyrine, talinolol (a P-gp substrate) and oestrone 3-sulfate (a BCRP substrate). Talinolol and oestrone 3-sulphate were incubated in the absence and presence of the inhibitor mix.
Following a 120-min incubation at 37 °C, the apical compartment inserts and the companion plates were separated and the apical and basolateral samples were diluted for analysis. UNC10201652 and positive control compounds were quantified by LC-MS/MS analysis using a 7 point calibration line. The starting concentration (C0) was determined from the dosing solution and the experimental recovery calculated from C0 and both apical and basolateral compartment concentrations.
Appearance of lucifer yellow in the receiver compartments was quantified using a fluorescence plate reader and used to calculate permeation across the cell monolayer. Integrity of the cell monolayer was considered acceptable for a well if the calculated Papp for lucifer yellow was ≤1.0 cm/sec (× 10−6).
UHPLC-MS/MS analysis
In vitro sample analysis of UNC10201652 was performed via reversed-phase (RP) UHPLC/MS using an Acquity™ Binary Solvent Manager (BSM), Acquity™ 4 position heated column manager, 2777 Ultra High Pressure Autosampler and a Xevo-TQ MS Triple Quadrupole mass spectrometer (Waters Ltd, Herts, UK). For analysis, 4 µL of sample was injected onto an ACQUITY™ HSS T3 (1.8 µm) 2.1 × 30 mm column (Waters Ltd, Herts, UK) fitted with SecurityGuard™ ULTRA Fully Porous Polar C18 cartridge (Phenomenex, Cheshire, UK) guard column. The analysis was performed at a column temperature of 40 °C using rapid gradient elution with mobile phase A formed from 10 mM ammonium formate + 0.1% v/v formic acid in water and ACN as mobile phase B. The gradient conditions are as shown in Table S1. The weak and strong washes used to clean the loop were MeOH:H2O 1:9 v/v and MeOH:acetone:IPA 4:3:3 v/v containing 0.1% formic acid.
Table 1. Summary of metabolites of UNC10201652 detected in microsome and hepatocyte stability assay samples.
Mass spectrometry was performed using positive electrospray ionisation (+ve ESI) using multiple reaction monitoring (MRM) with the parent to daughter ion transition 412.13 > 109.15 amu monitored for detection and quantification, respectively. The cone voltage was 28 V with a collision energy of 40 eV. A capillary voltage of 0.5 kV was applied, with a source temperature of 150 °C and a desolvation temperature of 650 °C. A cone gas (N2) flow rate of 50 L/h was employed with the desolvation gas (N2) flow set at 1200 L/h.
UHPLC/MS-based characterisation of in vitro metabolites of UNC10201652
The detection and characterisation of metabolites of UNC10201652 following either microsomal or hepatocyte incubation was also undertaken using RP-UHPLC/MS via a Waters Xevo QTof G2-S mass spectrometer, Acquity Binary Solvent manager, Acquity Column Manager and 2777 Auto sampler, fitted with a 10 µL loop (Waters Ltd, Herts, UK). For analysis 10 µL of sample were injected onto a 2.1 × 100 mm C18 ACQUITY UPLC HSS T3 1.8 µM column (Waters Ltd, Herts, UK) maintained at 60 °C. The separation was via rapid gradient elution with mobile phase A formed from 10 mM ammonium acetate in water and MeOH as mobile phase B. The gradient conditions were as shown in Table S2. The weak and strong washes used to clean the loop were MeOH:H2O 1:9 v/v and MeOH:acetone:IPA 4:3:3 v/v containing 0.1% formic acid.
Table 2. Pharmacokinetic parameters for UNC10201652 following IV and PO Administration to mice (3 mg/kg) with and without ABT pre-treatment.
Mass spectrometry was performed using positive electrospray ionisation (+ve ESI) over the Product Ion Scan Range m/z 45–800, a capillary voltage of 0.3 kV, a source temperature of 120 °C and desolvation temperature of 650 °C. The cone gas (N2) flow was 50 L/h and the desolvation gas (N2) flow was 1050 L/h.
The cone voltage was 40 V with mass spectra obtained using MSE with a collision energy ramp from 20 to 50 V. The lockmass was leucine enkephalin (0.4 µg/mL, 10 µL/min).
For microsomes, the 15 min (human and mouse) and 5 min (rat) incubation samples and for hepatocytes the 60 and 120 min (human), and 10 and 20 min (mouse and rat) incubation samples were compared against the respective 0 min control sample to establish which, and how many, metabolites were formed.
The data were processed using Metabolynx XS (Waters Ltd), employing mass defect filtering and a generic dealkylation approach. The validity of detected metabolites, data interpretation and structural elucidation were performed manually.
In vitro data analysis
The in vitro CLint (μL/min/mg protein or μL/min/106 cells for liver-microsomes and hepatocytes, respectively) was determined by following the depletion of UNC10201652 over the incubation time. From a plot of ln peak area ratio (UNC10201652 peak area/internal standard peak area) against incubation time, the elimination rate constant (k; -slope) was determined and the half-life (t1/2) and CLint of UNC10201652 was calculated according to the following equations:
(1)
(1)
(2)
(2)
where V (µL/mg protein or 106 cells) represents the incubation volume (µL) divided by the microsomal protein content (mg) or number of hepatocytes (106 cells) in the incubation.
The fraction unbound (fu) of UNC10201652 in plasma and microsomes was calculated according to the following equation:
(3)
(3)
where PC is the sample concentration in the protein containing side and PF is the sample concentration in the protein free side.
The extent of binding of UNC10201652 in hepatocytes was not measured experimentally but was estimated by utilising the measured fu in microsomes in accordance with approaches reported in the literature (Kilford et al. Citation2008).
Caco-2 Papp and efflux ratio were calculated according to the following equations:
(4)
(4)
where dQ/dt is the rate of permeation of the drug across the cells. C0 is the donor compartment concentration at time zero and A is the area of the cell monolayer
(5)
(5)
In vitro hepatic CLint values from the microsomal and hepatocyte incubations were corrected for incubational binding using fu values determined as described above and scaled to the in vivo whole liver equivalent using the following equation:
(6)
(6)
where SF represents the physiological scaling factors: number of cells per gram of liver (hepatocellularity) or the milligrams of microsomal protein per gram of liver, and the liver-to-body weight ratio. Microsomal recovery factors of 40, 45 and 61 mg microsomal protein/g liver, hepatocellularity of 120, 125 and 163 (×106) hepatocytes/g liver and liver weights of 25.7, 87.5 and 40 g/kg body weight were used for human, mouse and rat, respectively. Scaling factors were derived from literature, in-house experience and allometric calculations (Davies and Morris Citation1993; Houston and Carlile Citation1997; Riley et al. Citation2005; Hakooz et al. Citation2006; Smith et al. Citation2008).
Total hepatic clearance (CLh) was calculated using the well-stirred model in the following equation:
(7)
(7)
where Qh is the hepatic blood flow, fub is the fraction unbound in blood, and CLint,u is the scaled unbound in vivo CLint determined from liver microsomal or hepatocyte incubations. Fub was calculated by dividing the measured fraction unbound in plasma by the blood to plasma concentration ratio (assumed to be 1). Hepatic blood flow was 20.7, 120 and 90 mL/min/kg for human, mouse and rat respectively (Davies and Morris Citation1993; Ring et al. Citation2011; rat hepatic blood flow derived from literature-wide assessment, in-house experience and allometric calculations).
Mouse pharmacokinetic study
Animals
Male Swiss albino mice (30–35 g), 8–12 weeks of age were procured from ACTREC (Mumbai, India). Three mice were caged in each polypropylene cage and acclimatised for 1 week at Sai Life Sciences prior to initiation of animal studies. Mice were maintained under standard environmental conditions with 12 h light/dark cycle and free access to rodent chow and filtered water. All animal experiments were approved by the Institutional Animal Ethics Committee, Pune, India (IAEC/PRT/008-11) and were in accordance with the Committee for the Purpose of Control and Supervision of Experiments on Animals (CPCSEA), Ministry of Social Justice and Environment, Government of India.
Study design and sample collection
A total of 36 male Swiss albino mice were divided into four groups of 9 animals/group/route. Two groups were dosed IV and two PO, with 1 group in each dose route also administered the pan CYP inhibitor ABT. UNC10201652 was formulated as a solution in 7.5% N-methyl pyrrolidone in 40% PEG-400 in water for IV administration and as a suspension in 0.5% w/v sodium carboxyl methylcellulose and 0.1% v/v Tween 80 in water for the oral route. ABT was formulated in water. The dose of UNC10201652 for all groups and both routes was 3 mg/kg. The dose volumes were 10 mL/kg and 5 mL/kg for the PO and IV routes, respectively. In order to determine the effect of inhibiting CYP-based metabolism the inhibitor ABT was dosed at 50 mg/kg, 10 mL/kg, to two separate groups of mice 2 h prior to the PO and IV administration of UNC10201652.
A sparse sampling design was employed with each mouse sampled three times during the course of the study. Blood samples (60 µL) were collected from groups of 3 mice/time point via the retroorbital plexus into tubes containing the anticoagulant K2EDTA. Collections were performed at 0.0, 0.083 (IV only), 0.25, 0.5, 1, 2, 4, 6 (PO only), 8 and 24 h post-dose administration. Blood samples were centrifuged at 3200g for 10 min at 4 °C and the supernatant was stored frozen at −70 °C until analysis.
Sample preparation
Standard stock solutions (2 mg/mL) of UNC10201652 were prepared in DMSO. Separate weighings were performed for the preparation of calibration and quality control (QC) stock solutions. Working solutions for calibration and QCs were prepared by appropriate dilution in ACN-water (50:50, v/v; diluent). The stock solutions and the spiking solutions were stored at −20 °C. A working stock solution of glipizide, used as an internal standard (IS) was prepared by diluting a stock solution (in ACN) to final concentration of 1 μg/mL. Calibration curve and QC control standards were prepared by spiking 2.5 μL of working solution into 47.5 μL of interference free matrix.
Sample processing
A calibration curve from 2 ng/mL to 5000 ng/mL (0.004–10.45 μM) of UNC10201652 with at least seven nonzero concentrations and QCs together with the study samples were processed via solvent-based protein precipitation. Aliquots (50 μL) of each sample were mixed with 150 μL of ice cold ACN (containing IS). Centrifuge tubes were vortexed for 1 min on VX-2500 multitube vortexer (VWR Lab Product Pvt Ltd, Mumbai, India) and the centrifuged at 1000g, for 10 min at 4 °C (Centrifuge 5810 R –Eppendorf Germany). The clear supernatant (100 μL) was transferred to HPLC vials for analysis.
LC-MS/MS analysis of mouse plasma extracts
An unvalidated, ‘fit for purpose’, reversed-phase gradient HPLC-MS/MS method was used to quantify UNC10201652 in mouse plasma samples. HPLC was performed using an LC-20AD binary pump, a DGU20A degasser, and a SIL-HTC auto sampler (with a CTO-20A thermo-stated column oven) (Shimadzu Corporation, Kyoto, Japan). Chromatography was performed on a Chromolith Flash (4.6 × 25 mm) column (Merck KGaA, Darmstadt, Germany), maintained at maintained at 40 °C, with an injection volume of 10 µL. The solvent gradient was formed from ACN, containing 0.1% aqueous formic acid, (mobile phase A) and 0.1% aqueous formic acid as solvent B at a flow-rate of 0.8 mL/min with of UNC10201652 eluting with a retention time of 2.62 min.
Plasma extract analysis was undertaken using API-4000 triple quadrupole MS system (Sciex, Applied Biosystems, Foster City, CA) using positive electrospray ionisation (+ve ESI) mode with MRM. The optimised MS parameters were: interface temperature, 550 °C; ion spray voltage, 6.0 kV; ion source gas-1, 50 arb units; ion source gas-2, 70 arb units, collision gas, 6 arb units; declustering potential, 78 V; collision energy, 40 V for and 102 and 25 V for imipramine. The multiple reaction monitoring transitions were 412.2 → 109.1 for UNC10201652 and 446.3 → 347.0 for glipizide. Data acquisition and analysis were performed using the analyst software version 1.5.
The LLOQ of the method for UNC10201652 in mouse plasma was estimated to be 2.00 ng/mL based on the response obtained in the blank extracted sample.
Pharmacokinetic analysis
Pharmacokinetic parameters for UNC10201652 were calculated using the NCA module of WinNonlin Enterprise (Certara Inc., Princeton, NJ) for individual animals and are reported as the mean ± SD of the group. Maximum concentration (Cmax) and time of maximum concentration (Tmax) were observed values. The areas under the plasma concentration versus time curve (AUC0–t and AUC0-inf) were calculated using a combination of linear and log trapezoidal summations. Bioavailability (F) was calculated from AUC0–t after PO administration to that for the IV route and expressed as F%.
Results and discussion
The studies undertaken here were designed to shed light on the metabolic stability and fate of UNC10201652 (structure in ) in a variety of model systems using rat, mouse and human-derived hepatic microsomes and hepatocytes as well as obtaining preliminary pharmacokinetic data in the mouse.
Figure 1. The structure of the specific GUS inhibitor UNC10201652 (4-(8-(piperazin-1-yl)-1,2,3,4-tetrahydro-[1,2,3]triazino[4',5':4,5]thieno[2,3-c]isoquinolin-5-yl)morpholine (Inh 9).
![Figure 1. The structure of the specific GUS inhibitor UNC10201652 (4-(8-(piperazin-1-yl)-1,2,3,4-tetrahydro-[1,2,3]triazino[4',5':4,5]thieno[2,3-c]isoquinolin-5-yl)morpholine (Inh 9).](/cms/asset/81e47ed5-284d-4fcf-b4c4-2b6ca79fc69e/ixen_a_2128468_f0001_b.jpg)
In vitro metabolic studies on UNC10201652
Liver microsomal stability
The liver microsomal stability of UNC10201652 was investigated following incubation with human, mouse and rat liver microsomes and NADPH. Samples were taken at regular intervals over 45 min and UNC10201652 was quantified using LC-MS/MS. Control incubations undertaken in the absence of NADPH in order to determine the amount, if any, of non-CYP metabolism were also analysed but UNC10201652 was found to be stable under these conditions.
The intrinsic clearance of UNC10201652 when incubated with HLM was 48.1 µL/min/mg. The control compounds dextromethorphan and verapamil were determined to have intrinsic clearances of 44.8 and 316 µL/min/mg, respectively. The equivalent result for MuLM was 115 µL/min/mg (diazepam and diphenhydramine were 628 and 75.0 µL/min/mg, respectively) whilst in RLM, UNC10201652 had an intrinsic clearance of 194 µL/min/mg (the results for diazepam and diphenhydramine were 96.4 and 1020 µL/min/mg, respectively). These clearances were associated with a t1/2 of 28.8 min for HLM, 12 min for MuLM and 7.14 min for RLM. Full results for the intrinsic clearances obtained for UNC10201652 with these liver microsome preparations can be found in Table S3 of the Supplementary information and are illustrated in Figures S1, S2 and S3. In all cases the intrinsic clearances for the positive controls were consistent with historical data (see Table S4 for summary data).
Figure 2. Proposed structures of metabolites of UNC10201652 detected in hepatocyte stability and microsomal stability assay samples. As glucuronidation usually occurs on nucleophilic functional groups these have been shown with Markush structures on the metabolite as possible sites of conjugation. Structure elucidation was not performed on metabolites M7 and M17 as no suitable MSMS data were obtained.
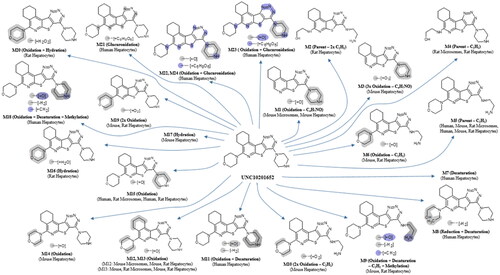
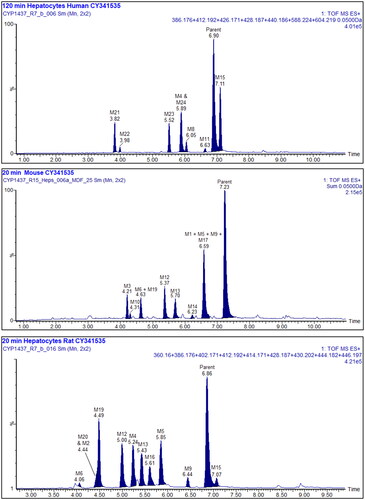
Figure 3. Summed XIC’s of all the metabolites of UNC10201652. Upper: 120 min human hepatocyte samples. Middle: 20 min mouse, and lower: 20 min rat. Metabolites M7 and 18 are not shown in these mass chromatograms. Other peaks are considered to arise from endogenous material.
These incubations were also used to provide samples for determining the metabolic fate of UNC10201652 as described below.
Hepatocyte stability
To obtain an indication of metabolic stability in cell-based systems, UNC10201652 was incubated with cryopreserved human, mouse and rat hepatocytes for up to 2 h with samples taken at selected time points. Following sample processing, LC MS/MS was used determine intrinsic clearance and metabolic fate (see below). The intrinsic clearances obtained for UNC10201652 were 20.9, 116 and 140 µL/min/106 cells for human, mouse and rat, respectively, and are summarised in Table S5 and illustrated in Figures S4, S5 and S6. The clearance of UNC10201652 in rat and mouse hepatocyte incubations resulted t1/2 values of 9.89 and, 11.9 min, respectively, whilst that obtained for the human hepatocyte preparation was 66.4 min.
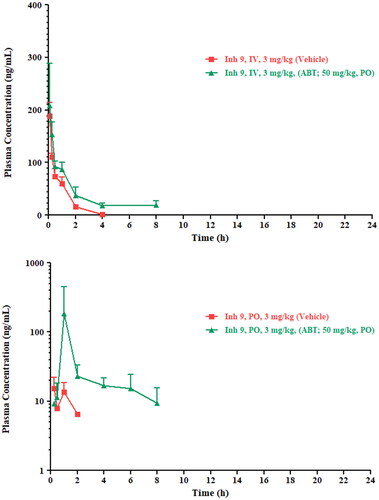
Figure 4. Upper: IV and lower: PO plasma profiles for UNC10201652 following administration at 3 mg/kg in dose vehicle (squares) or following ABT pre-treatment (triangles).
The CLint values obtained for the positive controls (verapamil, umbelliferone and raloxifene) were consistent with historical data and are provided in Table S6 for human, mouse and rat hepatocytes.
Binding of UNC10201652 to plasma and microsomal protein
Evaluation of UNC10201652 in human, mouse and rat plasma showed that the extent of plasma protein binding was greater than 90% in human and mouse, and was 89% in rat, with UNC10201652 found to have fu values of 0.0548, 0.0648 and 0.110 in human, mouse and rat plasma, respectively. The fu values obtained for the positive control warfarin was in line with historical data. Summary data for the protein binding of UNC10201652 and warfarin are provided in Tables S7 and S8, respectively.
Protein binding of UNC10201652 to human, mouse and rat liver microsomes was less extensive than that measured in plasma with UNC10201652 was found to have fu values of 0.642, 0.453 and 0.618 in HLM, MuLM and RLM respectively, as also detailed in Table S9. Amitriptyline, the positive control for all species, was determined to have a fu values in accordance with historical data (data shown in Table S10).
Prediction of CLH of UNC10201652 from microsomal and hepatocyte incubations
In vivo CLH values of UNC10201652 were predicted from in vitro CLint values determined in human, mouse and rat liver microsomal and hepatocyte incubations. The predicted in vivo CLH of UNC10201652 was 3.51, 42.1 and 43.5 ml/min/kg using in vitro CLint values measured in human, mouse and rat microsomal incubations, respectively. The predicted in vivo CLH of UNC10201652 was 4.65, 75.9 and 59.8 ml/min/kg using in vitro CLint values measured in human, mouse and rat hepatocyte incubations, respectively. Thus, the in vivo CLH of UNC10201652, whether derived from microsomal or hepatocyte incubations, was broadly similar (within 2-fold) within individual species.
Caco-2 permeability data of UNC10201652
The intestinal permeability of UNC10201652 was assessed in a bi-directional assay utilising polarised Caco-2 cells. The determined mean A-B Papp was 5.88 cm/s (×10−6) and mean B-A Papp was 15.9 cm/s (×10−6), with an efflux ratio of 2.70. In incubations containing the inhibitor mix (10 μM elacridar and 100 μM MK-571) the determined mean A-B Papp of UNC10201652 was 3.32 cm/s (×10−6) and mean B-A Papp was 7.02 cm/s (×10−6), with an efflux ratio of 2.11 (as shown in Table S11). These data suggest that UNC10201652 may undergo active efflux mediated by P-gp, BCRP, MRP2 or a combination of the three transporters. This may warrant further assessment as co-administration of an inhibitor of these transporters could potentially affect the disposition of UNC10201652.
The Papp values for the positive controls (atenolol, antipyrine, talinolol and oestrone 3-sulfate) were consistent with historical data and are summarised in Table S12. The efflux ratios of talinolol and oestrone 3-sulfate were reduced from 54.7 and 105, respectively, in incubations without the inhibitor mix to 1.73 and 0.475, respectively, in incubations performed in the presence of the inhibitor mix. This demonstrated the effective inhibition of P-gp and BCRP efflux in the presence of the inhibitor mix.
In vitro metabolism of UNC10201652
Liver microsome-derived metabolites of UNC10201652
To determine the metabolic fate of UNC10201652 in liver microsomes, samples taken from the 15 min human and 5 min mouse and rat incubations were analysed using high-resolution LC/MS/MS.
Two metabolites (M5 and M15) were detected after 15 min incubation with the HLM with ca. 82% of the total drug related material (assuming a similar molar response for both metabolites and UNC10201652) still present as unchanged UNC10201652 after 15 min of incubation. At this time point, M5 represented ca. 4% of the total with M15 accounting for another 14% (Table S13).
After incubation for 5 min with MuLM microsomes, unchanged UNC10201652 accounted ca. 86% of the remaining drug-related material (Table S14). The major LC/MS-detected metabolite of UNC10201652 in the sample after 5 min of incubation was M5, accounting for ca. 7% of the total ion current, which corresponds to partial degradation (loss of C2H2) of the piperazine ring (putative Markush structures are provided in ). None of the other metabolites detected (M1, M12 and M13) accounted for more than 2.5% of the total (see Table S14 for approximate % abundance of metabolites).
In the case of RLM, UNC10201652 was the major component present in the 5 min incubation, accounting for ca. 92% of the total, with 4 minor metabolites (M4, M5, M13 and M15) also detected, none of which accounted for more than 4% of the total (Table S15). As seen with the mouse M5 was the most abundant of the microsomal metabolites in the rat at ca. 3.8% of the total. The metabolites M4 and M5 corresponded to the degradation of the morpholine and piperazine moieties, respectively, with the loss of C2H2. The other two metabolites detected (M13 and M15) probably resulted from the hydroxylation of the same morpholine and piperazine rings (for putative metabolite structures see ).
Representative mass chromatograms showing UNC10201652 and its associated metabolite peaks for HLM, MuLM and RLM incubations are shown in Figures S7, S8 and S9.
Hepatocyte-derived metabolites of UNC10201652
The hepatocyte incubations produced metabolite profiles for UNC10201652 containing a greater variety of metabolite structures compared with the limited metabolism seen in microsomes.
Interestingly, although UNC10201652 dominated the profile of the 120 min human hepatocyte incubation, forming ca. 48% of the total, many more metabolites were detected (ten) than were seen in the microsomal incubations (M5, M7 (60 min time point only), M8, M11, M15, M18, M21, M22, M23 and M24). The major metabolites observed in the human hepatocyte profile were M5 and M15, accounting for 10% and 18.3% of the total, with the remainder all at less than 10% (Table S16). It is also possibly noteworthy that the human hepatocyte-derived metabolites profiles showed few similarities to rat profiles, and none to the mouse. So, whilst M5 and M15, previously detected in the liver microsomal incubations in common with the rat, were also seen in the hepatocyte incubations of both species none of the other hepatocyte-derived metabolites were shared. Instead, the human hepatocyte profile contained a number of unique metabolites including, M7, M8, M11, M18 and M21–M24. In addition, four metabolites were detected as unique human glucuronide conjugates (M21–M24) whilst neither rodent species produced conjugated metabolites. Putative structures for all of the metabolites seen in the human hepatocyte incubations are provided in and a composite mass chromatogram is illustrated in .
After 20 min incubation the mouse hepatocytes had produced 11 metabolites (M1, M3, M5, M6, M9, M10, M12, M13, M14, M17 and M19) (see and ). A mass chromatogram for the mouse hepatocyte metabolite profile for this time point is shown in (see also Table S17 for the relative proportions of these metabolites).
In the rat hepatocyte incubations UNC10201652, whilst still the major component at 20 min, accounted for only ca. 30% of the total with the remainder comprised of some 11 metabolites (M2, M4, M5, M6, M9, M12, M13, M15, M16, M19 and M20) present in amounts ranging from a little over 1% (e.g. M6, M15 and M20) to just over 10% (M4 and M5) of the total (see Table S18). The metabolites M4, M5, M13 and M15 were also detected in the rat microsomal incubations and resulted from metabolism of the morpholine and piperazine rings. Further examples of metabolism on these substituents obtained in the rat hepatocyte incubations included M2, M6, M9, M12, M16, M19 and M20, although metabolism on the aliphatic portion of the isoquinoline ring system is also a possibility for some of these metabolites (e.g. M12 and M13, and ). The mass chromatogram for the rat hepatocyte metabolite profile is shown in .
Mass spectra, and fragmentation data for all of the metabolites of UNC10201652 detected in this study are provided in Figures S10–S33.
In vivo pharmacokinetic studies in the mouse on UNC10201652
All animals tolerated UNC10201652 following IV and PO dosing (with and without prior ABT administration to inhibit CYP enzymes) and no clinical signs were observed up to 24 h post dose (the last sampling time point). Following IV administration, plasma concentrations of UNC10201652 declined bi-exponentially, and the drug was not detectable at the 24 h time point. Mean plasma profiles for both routes of administration are shown in . Following intravenous administration of UNC10201652 a plasma half-life of 0.66 h was observed with a plasma clearance of the drug of 324.8 mL/min/kg. After administration of the pan CYP450 inhibitor ABT, plasma clearance decreased ca. 2.5-fold to 127.4 mL/min/kg and plasma half-life increased ca. 6-fold to 3.66 h. These effects were accompanied by an apparent increase in the Vss of UNC10201652 of ca. 2-fold from 16.69 L/kg to 33.85 L/kg. Clearly these effects strongly support the involvement of CYP enzymes in the metabolism of UNC10201652, greatly increasing the exposure of the mice to the drug with AUClast increasing from 3.16 to 137.4 h.ng/mL as a result of ABT treatment. The IV plasma profiles for UNC10201652 with and without ABT pre-treatment are provided in .
Following PO administration of UNC10201652 relatively limited exposure was seen in these mice with a Cmax of only 15.2 ng/mL seen at 15 min post dose. Pre-exposure to ABT resulted in a greater than 10-fold increase in plasma Cmax of 184 ng/mL at 1 h post dose. Unsurprisingly therefore ABT treatment was also accompanied by a large increase in oral exposure with an AUClast of ca. 253 h.ng/mL of UNC10201652 in ABT treated mice, up from ca. 20 h ng/mL in the untreated animals, and oral bioavailability increased from 15 to 184% (see ). Pharmacokinetic parameters are provided in .
The in vitro metabolism data derived from the rat and mouse revealed, perhaps unsurprisingly, extensive metabolism of UNC10201652 on the metabolically labile pendant morpholine and piperazine rings. Metabolism in liver microsomes was less extensive than that in hepatocytes which, across the three species, produced a large number (24 in total, ) of metabolites. These hepatocyte-derived metabolites showed apparent differences in the structures produced by human and the two rodent species however, irrespective of these differences, all three showed extensive oxidative metabolism on the morpholine and piperazine groups. Interestingly, only the human incubations showed evidence of conjugation, with four glucuronides detected. With respect to the likely impact of these biotransformations on the pharmacological activity of UNC10201652, it has been shown that the morpholine group is dispensable for potency as a gut microbial GUS inhibitor (Pellock et al. Citation2018). As such, elimination or modification of this moiety may produce compounds that retain their ability to inhibit the enzyme targets. However, the secondary piperazine amine is established as a moiety essential for GUS inhibition (Pellock et al. Citation2018). Thus, disruption of the piperazine group is expected to eliminate activity as a GUS inhibitor. Interestingly though, the glucuronidation of the piperazine secondary amine, which appears to be generated by host metabolic factors as shown here, mimics the UNC10201652-glucuronide conjugate that was shown to form at the active site of gut microbial GUS enzymes via the interception of the catalytic cycle of the enzyme (Pellock et al. Citation2018). When UNC10201652 is provided with a glucuronidated substrate, the inhibitor attacks the covalent glucuronide-enzyme intermediate, producing the inhibitor-glucuronide that remains at the active site. One would expect, then, that the inhibitor-glucuronide would function as an exceptionally effective inhibitor compound. It does not, though, as it acts as only a moderately potent inhibitor (Pellock et al. Citation2018). It has been proposed that the conformational changes necessary to accommodate the inhibitor-glucuronide may be relatively inaccessible to the enzyme, while the free inhibitor can effectively disrupt the function of the protein while it performs its catalytic cycle (Pellock et al. Citation2018).
The dramatic increase in oral exposure (from 15% to 184%) observed in mice following their pre-treatment with the non-selective pan CYP inhibitor ABT also supports the notion that the main ‘routes’ of elimination of UNC10201652 were via oxidative metabolism by CYP enzymes.
The observed plasma clearance of UNC10201652 in the mouse PK study was 324.8 mL/min/kg, exceeding the mouse hepatic blood flow, and indicative of significant extra hepatic clearance and/or partitioning of the drug into the blood. Renal clearance is likely to be low, with minimal contribution from biliary elimination, based on the likely physicochemical properties of UNC10201652. Any extra-hepatic clearance may be metabolism-mediated, as demonstrated by the role of CYP enzyme activity in the in vivo mouse studies. The in vitro CLint of UNC10201652 in mouse and rat hepatocytes scaled reasonably closely to the respective hepatic blood flow (>60% of hepatic blood flow in both species). Despite high clearance, the detectable bioavailability in mouse (15%) is indicative of good absorption which is consistent with the permeability observed in the Caco-2 cell system. Whilst the CLH in human was predicted to be only 4 mL/min/kg (3.51 and 4.65 mL/min/kg scaled from in vitro microsomal and hepatocyte data, respectively; approximately 22% of hepatic blood flow), given the potential for extrahepatic metabolism (particularly e.g. in the gut wall during absorption), systemic exposure may still be limited. However, given that for this approach systemic exposure is not required, as the targeted enzyme is located in the gut bacteria, low plasma concentrations are, in fact, an advantage. If needed prolonged gut exposure of UNC10201652 may be attainable through formulation or pro-drug development.
The mice in the present study received 3 mg/kg by both dose routes. However, good efficacy was recently demonstrated in a mouse model (Bhatt et al. Citation2020) where mice received ca. 0.4 mg/kg. This corresponds to a local gut concentration of approximately 90 μM far in excess of reported potency. UNC10201652 has previously been shown to exhibit an IC50 of 0.117 μM against Escherichia coli GUS (Pellock et al. Citation2018). If the assumption is made that a dose of ca. 0.4 mg/kg would also be efficacious in patients, then systemic exposure to humans would be limited, and in order to attain a comparable concentration in the gut, a dose of approximately 0.15 mg/kg can be estimated for humans. UNC10201652 has been shown to be a highly specific inhibitor of microbial versus mammalian β-glucuronidases (Pellock et al. Citation2018) and this coupled with its low systemic circulation in patients should help to ensure minimal pharmacologically-related, or other, side effects in patients. However, before proceeding to humans further in vitro and in vivo studies to assess metabolism, disposition and safety are clearly required. Such investigations should include (but are not limited to) determining the identities of the CYPs involved in the oxidative metabolism of the compound as well as further studies on the efflux transporters interacting with the drug seen here in the studies on Caco-2 cells. Further, given that UNC10201652 would be administered to mitigate the toxicity of other drugs investigating the inhibition/induction of CYP enzymes and/or transporters would be prudent.
Also, the clinical benefit of UNC10201652 derives from its co-administration with therapeutic drugs thereby preventing the adverse reactions stemming from the liberation of toxins from their otherwise safe glucuronide metabolites. It is also therefore necessary to investigate the potential for drug–drug interactions.
Conclusions
UNC10201652, a gut commensal bacterial β-glucuronidase (GUS) inhibitor was converted to a relatively small number of metabolites when incubated with human, rat and mouse liver microsomes. However, when exposed to hepatocytes from these species, UNC10201652 underwent a wide range of oxidative biotransformations, particularly in the morpholine and piperazine substituents. Pharmacokinetic studies in mice showed high clearance (> blood flow) yet detectable bioavailability indicative of a high degree of first pass metabolism given its intrinsic permeability. The fact that bioavailability was significantly increased by pre-treatment with ABT, clearly implicates high first pass metabolism by CYP enzymes as the source of low plasma concentrations. This low bioavailability may prove advantageous for a drug targeted at the gut microbiota in limiting exposure of the host to UNC10201652.
Supplemental Material
Download PDF (1.5 MB)Disclosure statement
M. R. R. is a Founder and Board member of Symberix, Inc., and has received research funding from Merck and Lilly. The other authors report no declarations of interest. The remaining authors report no declarations of interest.
References
- Allison MC, Howatson AG, Torrance CJ, Lee FD, Russell RI. 1992. Gastrointestinal damage associated with the use of nonsteroidal anti-inflammatory drugs. N Engl J Med. 327(11):749–754.
- Bhatt AP, Pellock SJ, Biernat KA, Walton WG, Wallace BD, Creekmore BC, Letertre MM, Swann JR, Wilson ID, Roques JR, et al. 2020. Targeted inhibition of gut bacterial β-glucuronidase activity enhances anticancer drug efficacy. Proc Natl Acad Sci U S A. 117(13):7374–7381.
- Bjarnason I, Hayllar J, MacPherson AJ, Russell AS. 1993. Side effects of nonsteroidal anti-inflammatory drugs on the small and large intestine in humans. Gastroenterology. 104(6):1832–1847.
- Boelsterli UA, Ramirez-Alcantara V. 2011. NSAID acyl glucuronides and enteropathy. Curr Drug Metab. 12(3):245–252.
- Davies B, Morris T. 1993. Physiological parameters in laboratory animals and humans. Pharm Res. 10(7):1093–1095.
- Hakooz N, Ito K, Rawden H, Gill H, Lemmers L, Boobis AR, Edwards RJ, Carlile DJ, Lake BG, Houston JB. 2006. Determination of a human hepatic microsomal scaling factor for predicting in vivo drug clearance. Pharm Res. 23(3):533–539.
- Houston JB, Carlile DJ. 1997. Prediction of hepatic clearance from microsomes, hepatocytes, and liver slices. Drug Metab Rev. 29(4):891–922.
- Kilford PJ, Gertz M, Houston JB, Galetin A. 2008. Hepatocellular binding of drugs: correction for unbound fraction in hepatocyte incubations using microsomal binding or drug lipophilicity data. Drug Metab Dispos. 36(7):1194–1197.
- LoGuidice A, Wallace BD, Bendel L, Redinbo MR, Boelsterli UA. 2012. Pharmacologic targeting of bacterial β-glucuronidase alleviates nonsteroidal anti-inflammatory drug-induced enteropathy in mice. J Pharmacol Exp Ther. 341(2):447–454.
- Pellock SJ, Creekmore BC, Walton WG, Mehta N, Biernat KA, Cesmat AP, Ariyarathna Y, Dunn ZD, Li B, Jin J, et al. 2018. Gut microbial β-glucuronidase inhibition via catalytic cycle interception. ACS Cent Sci. 4(7):868–879.
- Riley RJ, McGinnity DF, Austin RP. 2005. A unified model for predicting human hepatic, metabolic clearance from in vitro intrinsic clearance data in hepatocytes and microsomes. Drug Metab Dispos. 33(9):1304–1311.
- Ring BJ, Chien JY, Adkison KK, Jones HM, Rowland M, Jones RD, Yates JW, Ku MS, Gibson CR, He H, et al. 2011. PhRMA CPCDC initiative on predictive models of human pharmacokinetics, part 3: comparative assessment of prediction methods of human clearance. J. Pharm. Sci. 100(10):4090–4110.
- Saitta KS, Zhang C, Lee KK, Fujimoto K, Redinbo MR, A Boelsterli UA. 2014. Bacterial β-glucuronidase inhibition protects mice against enteropathy induced by indomethacin, ketoprofen or diclofenac: mode of action and pharmacokinetics. Xenobiotica. 44(1):28–35.
- Smith R, Jones RDO, Ballard PG, Griffiths HH. 2008. Determination of microsome and hepatocyte scaling factors for in vitro/in vivo extrapolation in the rat and dog. Xenobiotica. 38(11):1386–1398.
- Takasuna K, Hagiwara T, Hirohashi M, Kato M, Nomura M, Nagai E, Yokoi T, Kamataki T. 1996. Involvement of beta-glucuronidase in intestinal microflora in the intestinal toxicity of the antitumor camptothecin derivative irinotecan hydrochloride (CPT-11) in rats. Cancer Res. 56(16):3752–3757.
- Wallace BD, Wang H, Lane KT, Scott JE, Orans J, Koo JS, Venkatesh M, Jobin C, Yeh L-A, Mani S, et al. 2010. Alleviating cancer drug toxicity by inhibiting a bacterial enzyme. Science. 330(6005):831–835.