
 ?Mathematical formulae have been encoded as MathML and are displayed in this HTML version using MathJax in order to improve their display. Uncheck the box to turn MathJax off. This feature requires Javascript. Click on a formula to zoom.
Abstract
Non-specific binding in in vitro metabolism systems leads to an underestimation of the true intrinsic metabolic clearance of compounds being studied. Therefore in vitro binding needs to be accounted for when extrapolating in vitro data to predict the in vivo metabolic clearance of a compound. While techniques exist for experimentally determining the fraction of a compound unbound in in vitro metabolism systems, early in drug discovery programmes computational approaches are often used to estimate the binding in the in vitro system.
Experimental fraction unbound data (n = 60) were generated in liver microsomes (fumic) from five commonly used pre-clinical species (rat, mouse, dog, minipig, monkey) and humans. Unbound fraction in incubations with mouse, rat or human hepatocytes was determined for the same 60 compounds. These data were analysed to determine the relationship between experimentally determined binding in the different matrices and across different species. In hepatocytes there was a good correlation between fraction unbound in human and rat (r2=0.86) or mouse (r2=0.82) hepatocytes. Similar correlations were observed between binding in human liver microsomes and microsomes from rat, mouse, dog, Göttingen minipig or monkey liver microsomes (r2 of >0.89, n = 51 − 52 measurements in different species). Physicochemical parameters (logP, pKa and logD) were predicted for all evaluated compounds. In addition, logP and/or logD were measured for a subset of compounds.
Binding to human hepatocytes predicted using 5 different methods was compared to the measured data for a set of 59 compounds. The best methods evaluated used measured microsomal binding in human liver microsomes to predict hepatocyte binding. The collated physicochemical data were used to predict the human fumic using four different in silico models for a set of 53–60 compounds. The correlation (r2) and root mean square error between predicted and observed microsomal binding was 0.69 & 0.20, 0.47 & 0.23, 0.56 & 0.21 and 0.54 & 0.26 for the Turner-Simcyp, Austin, Hallifax-Houston and Poulin models, respectively. These analyses were extended to include measured literature values for binding in human liver microsomes for a larger set of compounds (n=697). For the larger dataset of compounds, microsomal binding was well predicted for neutral compounds (r2=0.67 − 0.70) using the Poulin, Austin, or Turner-Simcyp methods but not for acidic or basic compounds (r2<0.5) using any of the models. While the lipophilicity-based models can be used, the in vitro binding should be measured for compounds where more certainty is needed, using appropriately calibrated assays and possibly established weak, moderate, and strong binders as reference compounds to allow comparison across databases.
Introduction
Accurate prediction of clearance remains a challenge in the development of new drugs before first time in human studies are conducted. Amongst the many methods available to predict human clearance (Ring et al. Citation2011; Tess et al. Citation2022), in vitro-in vivo extrapolation (IVIVE) has been extensively studied as it reduces the reliance on pre-clinical in vivo studies and allows clearance prediction from information on the rate of metabolism in human in vitro systems such as human liver microsomes (HLM) and hepatocytes (HHEP) (Houston Citation1994; Iwatsubo et al. Citation1996).
It is generally considered that to obtain the most accurate prediction of human clearance in vivo using IVIVE approaches it is necessary to correct the rate of metabolism by accounting for the unbound fraction in the incubation system (Obach Citation1999; Pelkonen and Turpeinen Citation2007; Deshmukh and Harsch Citation2011; Ring et al. Citation2011; Grime et al. Citation2013; Nordell et al. Citation2013). In the literature measurement of fraction unbound in in vitro systems is usually referred to as a binding measurement although in microsomal systems the compounds partition into the lipid membrane rather than bind to specific proteins (Nagar and Korzekwa Citation2012, Citation2017).
Chang et al. (Citation2010) showed that there is no clear relationship between microsomal binding and fraction unbound in plasma (fu) so the practise of ignoring binding terms in predictions of clearance with an assumption that fu plasma and microsomal binding (fumic) are the same is not supported by experimental data. Despite the importance of correcting metabolism rates for the unbound fraction in the in vitro system, a recent publication showed that in response to the question “Do you correct results for unbound concentration in the incubation either by experimental measurement or prediction from physicochemical properties?” 46% of the respondents answered no (Gouliarmou et al. Citation2018).
A number of different methods including equilibrium dialysis, ultrafiltration, ultracentrifugation, fluorescence-based assays (McLure et al. Citation2011) and binding to HLM beads (Wang et al. Citation2021) have been used to measure microsomal binding in vitro. These binding experiments are conducted in the absence of co-factors so that metabolism by P450 and UGT enzymes is minimal in the incubation. However, loss due to metabolism by other enzymes that do not require additional co-factors, e.g. esterases, can still occur. Of this plethora of techniques, equilibrium dialysis is the most widely used experimental approach.
Binding in hepatocyte incubations (fuhep) is more challenging to measure experimentally than microsomal binding as metabolism can occur during the time course of the experiment, particularly if long incubation times are needed to attain equilibrium. To prevent metabolism occurring different approaches including the use of dead cells or conducting incubations in the presence of metabolic inhibitors or at low temperature (4 °C) have been used. In addition, a study in rat hepatocytes showed that cellular uptake/binding for a set of 5 basic compounds was saturable over a range of substrate concentrations (Hallifax and Houston Citation2007), another caveat that is not generally considered when making measurements of in vitro incubational binding.
Although some of the methods for determining binding in metabolism incubations can be run in high throughput formats (96-well), computational methods have been described to predict the binding to save time particularly early in the drug discovery/development process (Gao et al. Citation2010). These include lipophilicity-based models from Austin ((Austin et al. Citation2002), called Austin Model in the current paper), Hallifax and Houston ((Hallifax and Houston Citation2006) called Hallifax-Houston Model) and Turner ((Turner et al. Citation2006), called Turner-Simcyp Model). The Austin and Hallifax-Houston models use a relationship between logP and fraction unbound for neutral and basic compounds but use logD for acidic compounds. Abraham and Austin (Abraham and Austin Citation2012) showed that carboxylate anions bind about 18-times less to microsomes than the corresponding protonated carboxylic acid but binding of protonated bases bind to almost the same extent as neutral compounds providing a mechanistic explanation for these empirical findings. The details of the Turner-Simcyp Model have been presented in abstract form but the model has not been published previously (Turner et al. Citation2006). The approach and datasets used to develop this model have been described in this paper.
Computational approaches have also been described for calculating binding in hepatocyte incubations from microsomal data or from physicochemical properties (Kilford et al. Citation2008) meaning that it is not always necessary to measure binding in both microsomes and hepatocytes. To make these conversions, however, some scaling factors to relate the volume of hepatocytes to the amount of protein in a microsomal assay at a given protein concentration are needed. Within the literature there are various values used for scaling; however, there is no consensus on the correct values to use. Various studies have shown that microsomal and hepatocyte binding is similar between species although differences have been reported for some compounds such as amiodarone (Zhang et al. Citation2010; Barr et al. Citation2019).
In this paper we have:
measured data for 60 compounds in up to 5 different pre-clinical species and human (referred to as the Pharmaron data set) and supplemented this with fumic and fuhep data in different species collated from the literature.
used the collated data to explore variability in measurements of fumic and fuhep between studies/laboratories.
collated data from the literature to evaluate species-dependent scalars linking hepatic microsomal protein and hepatocellularity of different species.
examined the accuracy of prediction of microsomal and hepatocyte binding by different in silico models.
evaluated the accuracy of predictions on in vitro binding for a series of zwitterionic compounds using the Turner-Simcyp model.
Materials and methods
Measurement of microsome and hepatocyte partitioning for the pharmaron set
Materials
Test compounds were purchased as solids from Sigma (St Louis, MO, USA), Cerilliant (Round Rock, TX, USA), Tokyo Chemical Industry (Tokyo, Japan), National Institutes for Food and Drug Control (Beijing, China), MCE Chemicals and Equipment Co. (Malta, NY, USA) or Alfa Aesar (Haverhill, MA). 1-Aminobenzotriazole (1-ABT) and salicylamide were obtained from MCE and Sigma, respectively. Leibovitz’s L-15 Medium was obtained from Gibco (Waltham, MA, USA). Mouse (male CD-1, 400 donor pool) and minipig (male Göttingen, 3 donor pool) liver microsomes were purchased from BioIVT (Westbury, NY, USA). Rat (male Sprague-Dawley, 711 donor pool) and Dog (male Beagle, 8 donor pool) liver microsomes were purchased from Xenotech (Kansas City, KS, USA). Monkey (Cynomolgus male, 2 donor pool) and minipig (male Bama, 3 donor pool) liver microsomes were purchased from RILD (Shanghai, China). Human (mixed gender, 150 donor pool) liver microsomes, were purchased from Corning (New York, NY, USA).
Mouse (male CD-1, 47 donor pool), rat (male Sprague-Dawley, 9 donor pool), dog (male Beagle, 3 donor pool), and human (mixed gender, 10-donor pool) cryopreserved hepatocytes were purchased from BioIVT (Westbury, NY, USA). Monkey (male Cynomolgus, 3 donor pool) cryopreserved hepatocytes were purchased from RILD (Shanghai, China).
96-well Equilibrium Dialysis Plates were obtained from HTDialysis LLC (Gales Ferry, CT, USA) using HTD 96a/b Dialysis Membrane Strips, MWCO 12–14kDa.
Dialysis procedure
The dialysis apparatus was assembled according to the manufacturer’s instructions. The dialysis membranes were prepared by soaking in ultrapure water (60 minutes) to separate the strips, then in 20% ethanol (20 minutes) followed by Leibovitz’s L-15 Medium (20 minutes). Working solutions of test compounds (200 uM), 1-ABT (400 mM) and salicylamide (300 mM) were prepared in DMSO.
Liver microsome binding
Liver microsomes, thawed at room temperature were diluted with PBS, pH 7.4 to a concentration of 0.5 mg protein/mL. Three µL of working test compound solutions were mixed with 597 µL of liver microsome suspension (final concentration 1 µM). After mixing, duplicate 50 μL aliquots were immediately removed to a 96-well collection plate to act as the control samples (T = 0 hour) and treated in an identical manner to the incubated samples. Duplicate 120 μL of spiked microsome suspension samples or an equal volume of buffer (PBS, pH 7.4) were placed in separate chambers of the dialysis plate which was sealed and incubated at 37 °C, using an air bath at 100 rpm, for 6 hours. Following incubation, 50 μL samples from both buffer and microsome suspension chambers were transferred to a 96-well collection plate.
Hepatocyte binding
Vials of cryopreserved hepatocytes were thawed (single freeze-thaw cycle) and diluted with serum-free L-15 medium to a working cell density of 0.5 × 10⁶ viable cells/mL. Cell viability (>75%) was confirmed by trypan blue exclusion. Following equilibration at 37 °C, 2.5 μL of 1-ABT working solution was added per mL hepatocyte suspension (final concentration 1 mM) and incubated for 1 hour. Five μL of salicylamide working solution was then added per mL hepatocytes suspension (final concentration 1.5 mM) followed by a further 5 minutes incubation.
Four μL of test compound working solution in DMSO were added to 796 μL of hepatocytes suspension (final concentration 1 μM). After mixing, duplicate 50 μL aliquots were immediately removed to a 96-well collection plate to act as the control samples (T = 0 hour) and treated in an identical manner to the incubated samples. Duplicate 120 μL of spiked hepatocytes suspension samples or an equal volume of buffer (Leibovitz’s L-15 Medium) were placed in separate chambers of the dialysis plate which was sealed and incubated at 37 °C, using an air bath at 100 rpm, for 4 hours. Following incubation, 50 μL samples from both buffer and hepatocytes suspension chambers were transferred to a 96-well collection plate.
Sample analysis
The sampled 50 μL aliquots of microsome, hepatocyte suspension or equivalent buffer in the 96-well collection plate were matrix matched with an equivalent volume of control microsome, hepatocyte suspension or buffer. Samples were then immediately quenched with 400 μL acetonitrile containing analytical internal standards (100 nM alprazolam, 500 nM labetalol and 2 μM ketoprofen). The plate was then mixed and centrifuged using an Eppendorf 5810 R centrifuge (Hamburg, Germany) at 3,220 g for 30 minutes at room temperature. One hundred μL of the supernatant was diluted with an equal volume of water prior to analysis by UPLC-MS/MS.
Samples (2 or 10 uL) were injected onto either a XSelect Hss T3 2.5 µ (2.1 × 50 mm) column (Waters, MA, USA) or a YMC-Triart HPLC® 1.9 µm C18 (2.0 × 30 mm) column (YMC Co. LTD, Kyoto, Japan) using a Shimadzu ultrafast-liquid chromatography system (Kyoto, Japan) coupled to an AB Sciex Triple Quad 5500 mass spectrometer (Framingham, MA, USA). The mobile phase consisted of either 0.1% formic acid or 0.1% ammonium hydroxide in water (mobile phase A) and either 0.1% formic acid or 0.1% ammonium hydroxide in acetonitrile (mobile phase B) for positive or negative MRM mode, respectively, operating over a 2-minute gradient using a flow rate of 0.6 mL/min. Test compound peak areas were integrated using Analyst® software (version 1.6, Sciex, Framingham, MA, USA) and a peak area ratio was derived via normalising to an analytical internal standard.
Calculation of results
The unbound fraction was calculated using the following equation:
(1)
(1)
LogD7.4 determination
The partition coefficient between 1-octanol and aqueous buffer at pH 7.4 (logD7.4) was measured using a shake flask technique. Briefly, test compounds (15 μL of 10 mM DMSO stock solution), 500 μL of 1-octanol saturated PBS (pH 7.4), and 500 μL of PBS saturated 1-octanol were added to glass vials and shaken at 25 °C, 1,100 rpm for 1 hour. Subsequently, the samples were centrifuged at 25 °C at 20,000 g for 20 minutes to separate the phases. Following separation of the phases, aliquots of 5 μL were taken from the upper octanol phase and added to 495 μL of acetonitrile. Following mixing a 50 μL aliquot was further diluted with 450 μL of acetonitrile. For the lower buffer phase, 50 μL aliquots were taken and diluted with 450 μL of acetonitrile. Aliquots of each final dilution (100 μL) were transferred to a fresh 96-well plate, mixed with an equal volume of water prior to analysis by UPLC-MS/MS as previously described. Test compound peak areas were integrated using Analyst® software version 1.6.
LogD was calculated using the following equation:
(2)
(2)
LogP determination
LogP was determined by chromatographic procedures. Briefly, thiourea (1 mM) in acetonitrile and ultrapure water mixture (1:1 v/v) was prepared as the unretained organic substance sample. A mixture of acetanilide, methyl benzoate, benzophenone, benzyl benzoate, fluoranthene and DDT (all 1 mM) were prepared in acetonitrile and ultrapure water mixture (1:1 v/v) as the reference substances mixture. Stock solutions of test compounds (2 mM) were prepared in DMSO and diluted with one volume of ultrapure water. Any insoluble compounds were filtered using a 0.45 uM nylon membrane. The retention time of all the samples was evaluated by LC-UV. Ten uL of each sample was injected on to a YMC-Triart HPLC® 1.9 µm C18 (2.0 × 30 mm) column (YMC Co. LTD, Kyoto, Japan) using a Shimadzu ultrafast-liquid chromatography system (Kyoto, Japan) coupled to a Shimadzu SPD-20A PDA detector (Kyoto, Japan). An acidic or basic mobile phase appropriate to the nature of the test compound was used operating over a 16-minute gradient using a flow rate of either 0.3 or 0.6 mL/min.
The logP values of test compounds and control compound were calculated using the following equations:
(3)
(3)
(4)
(4)
where k is the capacity factor and tR and t0 are the retention times of the test substance and non-retained thiourea respectively. The linear regression coefficients a and b are calculated from linear regression of the log partition coefficient versus the logk of the reference substances.
Collation of microsomal and hepatocyte binding data from the literature
Data were collated for mouse (CD-1, ICR, C57B1), rat (Wistar Sprague–Dawley), Beagle dog, monkey (Cynomolgus), Göttingen minipig, male Bama-minipig, and human. Data were normalised to 1 mg/mL for microsomes and 1 × 10⁶ cells/mL for hepatocytes using the following equation (Austin et al. Citation2002; Gao et al. Citation2010):
(5)
(5)
where C is the concentration and fuinc is the fraction unbound in the incubation. Subscripts 1 and 2 represent the two different concentrations of microsomal protein/hepatocytes. The concordance between this equation and the collated literature data is shown for 12 compounds where more than 10 measurements of fumic were reported at different microsomal protein concentrations (Supplementary Figure 1).
The complete datasets are included in Supplementary Tables 1 and 2. Values from individual studies were recorded. Technical replicates are described as a mean value, but if multiple determinations in different batches of microsomes/hepatocytes or at different concentrations of microsomes/hepatocytes were reported these are included as separate values in the dataset after normalisation to 1 mg/mL or 1 × 10⁶ cells/mL. Values >1 were set to be 1. For compounds where saturable uptake/binding in hepatocytes was observed (Hallifax and Houston Citation2007) the cell to medium concentration ratio value at high concentrations (where binding was saturated) was used. Data that were predicted computationally were excluded from the collated dataset. Data from the lowest concentration measured in the Wang et al. study (0.025 mg/mL) (Wang et al. Citation2021) were excluded as the dilution factor is so big that low binding values (high fuinc) were frequently predicted at 1 mg/mL using this approach highlighting that caution is needed if extrapolating from very low protein concentrations to much higher ones.
Data collation for development of the Turner-Simcyp model
A dataset of measured microsomal fraction unbound was assembled for 163 compounds. The microsomal binding data and physicochemical data (molecular weight, logP and logD (with pH of determination) was supplied from Simcyp Consortium members (seven companies contributed data), from academia and from the published literature. The experimental values for the compounds not identified by an internal code designation i.e. where the structure is published are shown in Supplementary Table 3.
The following three steps were taken to consolidate the data collected.
Data points were discarded where experimental fumic were exactly unity, greater than unity or zero – neither the calculation of a partition coefficient (Kmic) value nor the rescaling to fumic at alternative microsomal protein concentrations (Cmic) is appropriate in these cases.
Data points were excluded where experimental fumic values are quoted to be less or greater than a threshold value.
For a compound with multiple experimental measurements of fumic the values were then combined by taking the median of the fumic values once scaled to a protein concentration of 1 mg/mL (EquationEquation (5)
(5)
The physicochemical properties required for model building (logP, compound type and pKa) were consolidated where possible and experimentally determined values were used over computed properties where available. This was because even for the best performing physicochemical prediction methods a significant proportion of molecules are predicted with an error of >1 log unit (Avdeef et al. Citation2007; Mannhold et al. Citation2009).
Prediction of microsomal binding
Microsomal binding was predicted using the equations derived by Austin et al. (Citation2002; EquationEquation (6)(6)
(6) ) and Hallifax and Houston (Citation2006; EquationEquation (7)
(7)
(7) ).
Austin Model:
(6)
(6)
where Kmic = (1-fumic)/fumic, logP is used for bases and logD is used for acidic compounds. For neutrals logP was set equal to logD so either value can be used.
Hallifax–Houston Model:
(7)
(7)
where C is the microsomal protein concentration and logP/D is the logD value for acidic drugs and logP for basic and neutral drugs.
The Turner–Simcyp model
For the Turner-Simcyp Model equations using standard physicochemical inputs were developed separately for predominantly ionised basic and acidic compounds as well as neutral compounds. Compounds of intermediate ionisation are handled via a novel treatment which explicitly considers the proportions of neutral and ionised substrate at incubation pH.
Theoretical background
Experimental evidence suggests that NSMB (non-specific microsomal binding) of drugs is dominated by partitioning into the microsomal phospholipid component (Nagar and Korzekwa Citation2012) and can be characterised by a partition coefficient (Kmic). Separate relationships were derived to describe the relationship between logP and each of
and
Once these relations are established, the following equation can be used to predict Kmic for a compound of given logP, pKa and at the required pH.
(8)
(8)
where MI refers to either the monocation or monoanion, and fN and fMI are, respectively, the neutral fraction and the fraction ionised at a given pH. The fraction ionised depends on the pKa of the compound and the pH of the measurement. For monoprotic bases and acids the classical Henderson–Hasselbalch equations were used and for diprotic compounds the equations proposed by Pagliara et al. were used (Pagliara et al. Citation1997).
Model building
The compounds used for model building were divided into three classes: I. predominantly (≥90%) ionised acids; II. predominantly (≥90%) ionised bases; III. predominantly (<10% ionised) neutral compounds. Separate models, relating logKmic to logP via conventional unweighted least squares fit, were developed for each of compound classes I, II and III (see EquationEquations (14)–(16) in the result section). A set of compounds with intermediate ionisation (>10 and <90% ionised) was used as an independent test set and not used in the model building exercise.
Tissue composition method
Microsomal binding was also predicted using the tissue composition equations proposed by Poulin (Poulin and Haddad Citation2011). For basic drugs this requires the collation of blood-to-plasma ratio (B:P) and protein binding data (fu = fu plasma) to allow the calculation of the partition coefficient into acidic phospholipids. The data used and the sources of values used are listed in Supplementary Table 2.
Prediction of hepatocyte binding
Hepatocyte binding was predicted using different methods as follows.
First, the equations proposed by Kilford et al. (Citation2008) were evaluated to predict hepatocyte binding from microsomal binding (EquationEquation (9)(9)
(9) ) or physicochemistry (EquationEquation (10)
(10)
(10) ):
(9)
(9)
where Kp is the hepatocyte/medium concentration ratio, Ka is the microsomal binding affinity, VR is the volume ratio of hepatocytes to medium (0.005 for 1 × 10⁶ cells/mL), P is the protein concentration, and fumic the microsomal unbound fraction:
(10)
(10)
where VR is the volume ratio of hepatocytes to medium (0.005 for 1 × 10⁶ cells/mL), logP is used for neutral and basic compounds and logD for acidic compounds.
Secondly, the equation proposed by Austin et al. (Citation2005) based on 17 compounds measured in rat hepatocytes was used:
(11)
(11)
The third method used to calculate hepatocyte binding was the tissue composition method proposed by Poulin and Haddad (Citation2013). Lastly, the relationship proposed by Tess et al. (Citation2022) was evaluated.
Statistical data analysis
The prediction accuracy was assessed by calculating the correlation coefficient between observed and predicted data and by calculating the root mean square error.
Results
Species-dependent free fraction in microsomes and hepatocytes
Hepatocyte data
For the animal fuhep database, data were collated from 9 references (n = 197) and extended by newly measured fuinc data generated as part of this work (n = 120). The final database contained 317 entries (i.e. mean data for 79 mouse, 188 rat, 28 dog, and 22 monkey measurements) for 106 compounds. For the human hepatocytes, the database consisted of fuhep data for 136 compounds (206 measurements from 6 references, 61 measurements made as part of this work). The data for 25 compounds have not been previously reported in the literature.
Microsomal data
The database contained 388 fumic entries for 6 species (37 mouse, 189 rat, 85 dog, 75 monkey, 1 Guinea pig, and 1 rabbit) from 14 references for 108 compounds. The newly measured data extended the database to a total of 710 entries for 8 species (i.e. mean data from 95 mouse, 248 rat, 142 dog, 128 monkey, 53 Göttingen minipig, 42 male Bama minipig, 1 Guinea pig, and 1 rabbit measurement) for 137 compounds (Supplementary Table 4). The database for the human fumic data, was the largest dataset with 1384 measurements for 842 compounds. Reported mean data were collated from 34 references. Of the 60 compounds that were measured as part of this work, data for 12 compounds have not been previously described in the literature.
shows the binding of different compounds (n = 58) in microsomes from different species (normalised to 1 mg/mL) generated as part of this work. shows the corresponding data for hepatocytes (n = 55 compounds).
Figure 1. Animal versus human fumic ratios (A) and fuhep ratios (B) for 58 and 55 compounds, respectively, measured by Pharmaron.
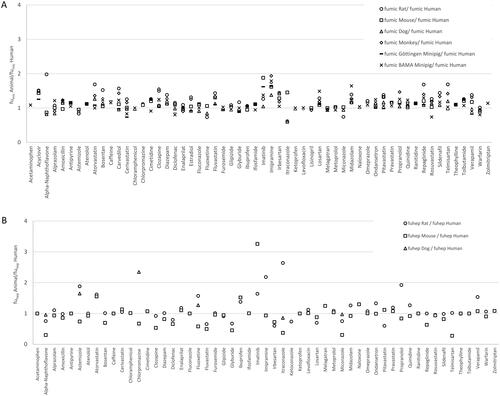
The dataset for some species was extended to include data reported in the literature for a wider set of compounds (Supplementary Figures 2 and 3). The rat/human fumic ratios ranged from 0.61 (itraconazole) to 1.98 (alpha-naphthoflavone) in the current data set (n = 58) and from 0.13 (amiodarone) to 2.62 (isradipine) in the data set (n = 36) published by Barr et al. (Citation2019). On average the measured fumic values in rat in this study were 20% higher than the human fumic. In the smaller data set reported by Barr et al. three of the 36 compounds had significantly higher fumic in the rat (antipyrine (2.44), imatinib (2.51) and isradipine (2.62)).
The mouse/human fumic ratios ranged from 0.87 (alpha-naphthoflavone) to 1.88 (imatinib) in the data set generated as part of this work (n = 58) and from 0.11 (amiodarone) to 2.44 (isradipine) in the data set (n = 36) reported by Barr et al. (Citation2019). The dog/human fumic ratios ranged from 0.60 (alpha-naphthoflavone) to 1.49 (acyclovir) in the current data set (n = 56) and from 0.045 (amiodarone) to 3.2 (isradipine) in the data set reported by Barr et al. (Citation2019). The monkey/human fumic ratios ranged from 0.90 (enalaprilat) to 1.94 (imipramine) in the current data set (n = 52) and from 0.08 (amiodarone) to 2.37 (isradipine) in the data set (n = 36) reported by Amgen (Barr et al. Citation2019).
Looking at the data where hepatocyte binding was measured the rat/human fuhep ratios ranged from 0.60 (pitavastatin) to 2.64 (itraconazole) in the current data set (n = 54), from 0.06 (amiodarone) to 1.38 (glyburide) in the Amgen data set (n = 36), and from 0.46 (lopinavir) to 1.13 (ritonavir) in the data set published by Tess et al. (n = 22) (Tess et al. Citation2022). The mouse/human fuhep ratios ranged from 0.28 (telmisartan) to 3.26 (imatinib) in the current data set (n = 54), from 0.02 (amiodarone) to 1.4 (topotecan) in the Amgen data set (n = 36), and from 0.39 (nelfinavir) to 1.13 (pitavastatin) in the Pfizer data set (n = 22). The dog/human fuhep ratios ranged from 0.86 (itraconazole) to 2.35 (chlorpromazine) in the Pharmaron data set (n = 6), from 0.05 (amiodarone) to 1.24 (topotecan) in the Amgen data set (n = 36), and from 0.92 (fluvastatin) to 1.72 (saquinavir) in the Tess data set (n = 22). Finally, the monkey/human fuhep ratios ranged from 0.05 (amiodarone) to 1.49 (topotecan) in the Amgen data set (n = 34), and from 0.96 (verapamil) to 1.61 (levothroxine) in the Tess data set (n = 22).
In , the measured fuhep data in human and rat are compared for 78 compounds from two sources, where 11 compounds were measured in both data sets. The correlations are as follows:
(12)
(12)
Figure 2. Measured fuhep in rat plotted versus fuhep in humans (A), measured fuhep in mouse versus fuhep in humans (B). The ‘Pharmaron’ data set represents measurements from this study and the ‘Amgen’ data set refers to data reported by Barr et al. (Citation2019). The black line is the line of unity and the dashed lines indicate a 2-fold change.
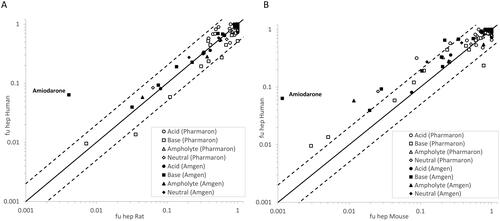
In , the measured fuhep data in human and mouse are compared for 78 compounds from two sources, where 12 compounds were measured in both data sets. The correlations are as follows:
(13)
(13)
Variability in measurements of fumic and fuhep between studies
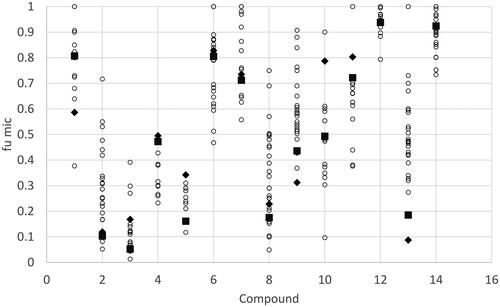
Data was collated from multiple publications for a series of 14 compounds where more than 10 independent measurements were reported in the literature. The data after normalisation to a microsomal protein concentration of 1 mg/mL is shown in and the original uncorrected data is shown in Supplementary Figure 1. For many of the compounds the measured data shows significant variability with reported values covering a range of more than fivefold for 4 of the compounds with a maximum range of 29.7-fold being observed for chlorpromazine.
Figure 3. Range of reported values for human microsomal binding for compounds with more than 10 independent measurements reported in the literature. Values were normalised to 1 mg microsomal protein/mL. Compounds 1= Alprazolam, 2= Amitriptyline, 3 = Chlorpromazine, 4 = Clozapine, 5 = Desipramine, 6 = Diclofenac, 7 = Diltiazem, 8 = Imipramine, 9 = Midazolam, 10 = Propranolol, 11 = Quinidine, 12 = Tolbutamide, 13 = Verapamil, 14 = Warfarin. The black diamonds and squares represent the predict fumic value using the Turner-Simcyp model and predicted (diamond) or measured physicochemical data (square), the other coloured circles represent the measured data collated from the literature publications.
Species-dependent scalars to link hepatocellularity to microsomal protein
To allow comparison of binding in microsomal binding and hepatocyte incubations it is necessary to have an understanding of how many mg of microsomal protein have an equivalent protein content to 1 × 10⁶ hepatocytes. In V21 of the Simcyp simulator the number of hepatocytes (×106) per mg of microsomal protein is 2.95, 2.35, 4.21, 2.81 and 3.97 for human, rat, dog, mouse, and monkey liver, respectively (Simcyp internal database). Hallifax and Houston (Hallifax and Houston Citation2007) report a value of 3.5 × 10⁶ cells as equivalent to 1 mg microsomal protein in rat liver giving a mean estimate of 2.93 × 10⁶ cells being equivalent to 1 mg microsomal protein in rat liver. In human liver using the value from the Simcyp simulator and reported literature estimates gives a value of 2.61 ± 0.4 106 cells per mg microsomal protein in human liver (mean ± SD; n = 4) (Hallifax and Houston Citation2007; Mateus et al. Citation2013; Riede et al. Citation2017; Riccardi et al. Citation2018; Treyer et al. Citation2019; Riccardi et al. Citation2020; Tess et al. Citation2022).
Prediction accuracy of tested in silico models to predict fumic and fuhep
Data for the Turner–Simcyp model building
A summary of the NSMB binding and physicochemical data used to build the Turner–Simcyp model are shown in . The fumic data for non-proprietary compounds in the dataset is listed in Supplementary Table 3.
Table 1. Summary of data by compound class after the cleaning and consolidation steps described in the main text and excluding model outliers identified in the main text.
The drug concentrations used in determining NSMB were in the range 0.5–1 µM for the majority of the compounds, with measurements for ∼17% of the dataset being made at multiple compound concentrations. Experimental Cmic range from 0.02 mg/mL to 4.0 mg/mL. The basic and neutral compound sets cover a wide and similar range of both logP and fumic, approximately 0–7 and approximately 0.01–0.99 (Cmic = 1 mg/mL), respectively. Two compounds emodin (pKa 5.7; fi ∼98%; fumic = 0.13) and troglitazone (pKa 6.61; fi ∼86%; fumic = 0.08) had significantly higher binding than other acidic compounds and were excluded from the model building process. The remaining acidic compounds had a minimum fumic of 0.50 and a maximum of 0.97 whilst covering a logP range of 0.7 to 6.5. This suggests that even for highly lipophilic, but near fully ionised, acidic drugs the bound fraction typically does not exceed 50% and therefore the maximum fold difference between in vitro intrinsic clearance (CLint) and unbound intrinsic clearance (CLint,u) is two. There were insufficient numbers of predominantly ionised diprotic and zwitterionic compounds in the dataset to establish separate models for these classes. Consequently, predominantly ionised diprotic acids or bases were grouped with the corresponding monoprotic acids or bases. Predominantly ionised zwitterionic compounds are by definition globally charge neutral and were placed in the predominantly neutral class. These few compounds were not outliers to the models developed herein although it is acknowledged that certain zwitterionic compounds may interact with charged membrane surfaces quite differently to completely uncharged compounds (Pagliara et al. Citation1997; Rodgers and Rowland Citation2006). For compounds in the Turner–Simcyp model where NSMB data were available in both rat and human liver microsomal preparations the values obtained were compared (Supplementary Figure 4). After the exclusion of two outlier compounds there was no significant difference between binding in the two matrices so the data from both species were used in the model building process (n = 13; r2 =0.97; p 0.005 using a two-tailed matched pairs t-test for the null hypothesis that there is no significant difference between logKmic in rat or human liver microsomes). The same relationship was not observed for compounds where NSMB binding was measured in HLM and insect Sf9 microsomes (Supplementary Figure 5). For the 16 compounds in this dataset the binding in Sf9 microsomes was higher than in HLM at an equivalent microsomal protein content. For this reason, data from recombinant systems were not included in the model building exercise.
The final equations for the Turner-Simcyp model were:
For predominantly ionised basic compounds
(14)
(14)
For neutral compounds
(15)
(15)
For predominantly ionised acidic compounds
(16)
(16)
Evaluation of different prediction models against the newly generated NSMB data in human liver microsomes
The developed in silico model was assessed against a set of compounds where microsomal binding data were generated as described in the methods section (). The ability of the Turner–Simcyp, Poulin, Hallifax–Houston, and Austin methods to predict the measured fumic (normalised to 1 mg/mL) are shown in . Similar prediction accuracy was obtained using measured and predicted physicochemical data (data not shown). The Turner–Simcyp model was applied against 4 additional zwitterionic compounds, hence the higher n number. The performance of the Turner-Simcyp model was compared separately for acidic, basic, and neutral compounds. The model performed well for neutral and basic compounds but there was a poor correlation between the predicted and observed microsomal binding of acidic compounds maybe because the dataset contained no acidic compounds with high microsomal binding (all compounds had fumic >0.5).
Table 2. Human liver microsomal binding (0.5 mg/ml) and human hepatocyte incubation binding (0.5 × 10⁶ cells/ml) logP and logD data generated using the methods described in the methods section of this paper.
Table 3. Prediction accuracy for the 4 in silico methods to predict the measured fumic values for the Pharmaron compound set.
The in silico models were then evaluated using an expanded independent dataset collated from the literature (Supplementary Tables 1 and 2). Physicochemical data was taken either from the ChEMBL database if available or from the published paper if absent in ChEMBL. Results are shown in . Compounds used in developing any of the in silico models were excluded from this set of compounds. To calculate the predicted fumic for basic compounds using the method described by Poulin et al. it was necessary to have additional data describing the plasma fu and blood to plasma ratio (BP). These data were only available for a subset of compounds. For this small subset of compounds, the Poulin method performed notably better than the other methods.
Table 4. Prediction accuracy for the 4 in silico methods to predict the fumic values for the literature collated dataset.
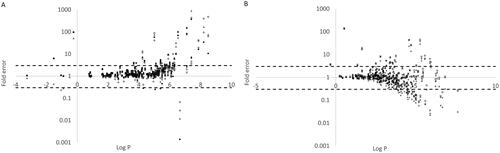
shows the predicted-fold error for (A) acidic and (B) basic compounds plotted against logP. With one or two notable exceptions the majority of prediction values with more than a threefold error are observed at higher logP values (>4).
Figure 4. The relationship between logP and prediction error of microsomal binding for (A) acidic and (B) basic compounds. The four methods are represented by Turner-Simcyp (square), Austin (diamond), Hallifax-Houston (triangle), and Poulin (circle; only calculated for acidic compounds as information on plasma fu and BP was missing to make predictions for the basic compounds (see methods section)).
Five methods were compared to predict the hepatocyte binding as described by Tess et al. (Citation2022, Kilford et al. Citation2008, Poulin, and Austin) and the results compared to the human hepatocyte binding dataset generated as part of this work. The number of compounds tested for each method, the r2 and RMSE was 59, 0.74 and 0.16 for the method described by Tess et al., Kilford (fumic) 56, 0.73, 0.16, Kilford (physicochemical) 59, 0.64, 0.17, Poulin 56, 0.38, 0.295 and Austin 58, 0.59, 0.202, respectively.
Prediction of binding of zwitterionic compounds using the Turner–Simcyp model
The Turner–Simcyp model was tested on a series of zwitterion compounds (n = 46) under three different assumptions; that the compound is neutral or accounting for the basic or acidic pKa. For the three different assumptions the r2 was 0.32, 0.34 and 0.51 and the RMSE 0.34, 0.34 and 0.24 for the neutral, basic and acidic assumption, respectively (Tess et al. Citation2022).
Discussion
The fraction unbound in microsomal (rat, mouse, dog, minipig, monkey and human) or hepatocyte incubations (rat, mouse and human) were determined for a set of 60 compounds. For several of these compounds binding in microsomal or hepatocyte incubations has not been previously reported in the literature. In addition, data was collated from the literature for a much larger set of compounds (Supplementary Table 1).
Despite significant differences noted for some compounds the binding for the compounds in microsomes or hepatocytes from different species generally showed good concordance in line with the findings of other investigators (Obach Citation1997; Zhou et al. Citation2002; Zhang et al. Citation2010). In this study the observations of previous studies was extended to include microsomes from minipigs. This is valuable information as minipigs are often used as a non-rodent toxicology species and also have been used to evaluate dermally applied drugs (Suenderhauf and Parrott Citation2013; Poulin et al. Citation2019).
For many of the compounds where more than 10 measurements of microsomal binding were made () there was a lot of variability between the reported values after correction of the data to a protein concentration of 1 mg/mL. The equation used to correct the data to a consistent protein concentration performed reasonably well when compared to the experimental data measured at different protein concentrations (particularly when the variability in the experimental data is considered) (Supplementary Figure 1). The range of values reported for some of the compounds suggests that the development of industry standardised protocols for microsomal binding may drive improved consistency across laboratories improving in turn dataset comparisons.
To compare the binding in human liver microsomal assays to those in human hepatocytes it was necessary to have an estimate of the number of hepatocytes that are equivalent to the amount of microsomal protein used in the in vitro microsomal binding assay. Estimates of this value in the collated literature data varied across species and with experimental methodology. The average values in humans 2.6 × 10⁶ hepatocytes = 1 mg microsomal protein was lower than in the pre-clinical species for which data were available.
Consideration of binding in in vitro hepatic metabolism systems is necessary if the data are to be extrapolated to predict in vivo hepatic metabolic clearance or to correct in vitro measurements of enzyme inhibitory potency (Ki) of compounds. Particularly early in the discovery process, in silico approaches to predict microsomal or hepatocyte binding are often used to obviate the need to measure the binding in the in vitro system.
In silico models based on lipophilicity have frequently been used to make predictions of microsomal binding for compounds where measured data is unavailable. The ability of three lipophilicity-based models (Hallifax, Austin and Turner–Simcyp) and a microsomal composition partitioning model proposed by Poulin et al. were evaluated against binding data generated for a set of 60 compounds in human liver microsomes. The models had similar performance in predicting the measured data.
When the in silico methods were compared against a larger dataset of microsomal binding data collated from the literature the in silico models performed well for neutral compounds but poorly for acidic and basic compounds. Although the correlation (r2) between predicted and observed microsomal binding values was <0.5 for acidic and basic compounds the predicted values were within twofold of the observed values for 77, 91 and 71% of the acidic, neutral and basic compounds, respectively. For the dataset collated from the literature predicted physicochemical properties were used and so the prediction accuracy of the in silico models depends both on the accuracy of the model and the accuracy of the predicted logP/D and pKa used for each particular compound.
For the small subset of basic compounds (n = 44) where protein binding and blood-to-plasma ratio data were available the approach to predict microsomal binding described by Poulin and Haddad (Citation2011), performed better than the other prediction methods. shows the prediction error for acidic and basic compounds plotted against the lipophilicity of the compounds. The majority of poor predictions are observed at higher logP values. This is in line with the observations from Gertz et al. (Citation2008) who noted that the Austin and Hallifax-Houston models performed similarly at low lipophilicity, with superior performance of the Hallifax-Houston model at intermediate lipophilicity (logP/D 2.5 − 5) and poor performance for both models at higher lipophilicity. Similar results with poorer performance at higher logP were also noted in the study by Winiwarter et al. (Citation2019). Unfortunately, the microsomal binding tends to be higher and therefore has more impact at higher values of lipophilicity highlighting the area where the in silico models need to give reliable results.
There are several possible reasons for the poor performance of the lipophilicity-based prediction models of fumic against the larger dataset of compounds. For some compounds such as amlodipine, methadone, dabrafenib, bupivacaine, ropivacaine and tacrolimus the predictions were improved using measured physicochemical data rather than the predicted values from the ChEMBL database.
There is experimental evidence that some of the compounds have specific binding to model phospholipid membranes e.g. emodin (Alves et al. Citation2004) or can disrupt the phospholipid membrane altering its properties e.g. emodin, troglitazone, sorafenib and regorafenib (Alves et al. Citation2004; Rusinova et al. Citation2011; Beaumont et al. Citation2011). It is likely that these properties lead to higher membrane partitioning and a lower fraction unbound in vitro that is not adequately described purely by the lipophilicity of the compound but instead is dependent on specific structural features of the compound. The ability to recognise structural features that correlate with this type of membrane insertion/disrupting properties may explain why machine learning models for microsomal binding tend to have better predictive performance than simple physicochemical-based prediction models (Gao et al. Citation2008; Winiwarter et al. Citation2019; Kosugi and Hosea Citation2020). These models allow the behaviour of specific chemical groups in relation to microsomal binding/partitioning beyond that due to lipophilicity to be accounted for. In the prediction model developed by Nagar and Korzekwa specific descriptors were used to account for the behaviour of compounds containing NO2 or SO that were otherwise poorly predicted (Alves et al. Citation2004; Rusinova et al. Citation2011). Improvements in predicting microsomal binding have also been reported using a chemical fragment based approach (Nair et al. Citation2016). For many compounds in the dataset there was only a single reported value for microsomal binding and so there may also be some contribution of experimental error to the misprediction for these compounds. This may be exemplified by methotrexate where only a single value of microsomal binding was found in the literature (Barr et al. Citation2019). Measured values of methotrexate binding in microsomes for other species have much higher value of fraction unbound than the reported value in humans and are in line with the values predicted from the in silico methods.
Different methods were also evaluated to predict the binding in human hepatocyte incubations. For the dataset of 60 compounds generated in human hepatocytes in this study () the best predictions of binding in hepatocyte incubations were observed using a measured microsomal binding value.
The lipophilicity-based methods to predict microsomal binding published by Austin, Hallifax and Houston, and Poulin did not explicitly describe an approach to predict microsomal binding for zwitterionic compounds. Using the Turner–Simcyp approach the human liver microsomal binding was predicted for a set of 46 zwitterionic compounds with the assumption that the zwitterionic compounds would behave as basic, neutral, or acidic compounds. The results from this analysis showed that treating the zwitterionic compounds as acids gave the best correlation with observed data and the lowest RMSE.
In conclusion, the lipophilicity-based prediction models of microsomal or hepatocyte binding make predictions within twofold of the observed values for the majority of compounds tested. Against an independent dataset (not used in model building) the physicochemical models performed with reasonable accuracy for neutral compounds but were not as good for acidic or basic compounds suggesting that further improvements are needed in the in silico methods and physicochemical properties that account for insertion into/disruption of the lipid bilayer may need to be incorporated into the prediction models. Similar conclusions were made by Chen et al. (Citation2017). Further investigation of how much variability in experimental settings in different laboratories contributes to the reported variability of measured fuinc data is warranted in the future. In line with in vitro practices in other areas (e.g. passive permeability scaling) it may be worth including weak (e.g. tolbutamide, warfarin), moderate (e.g. midazolam, propranolol) and strong (e.g. amitriptyline, chlorpromazine, desipramine or imipramine) binders as reference compounds in future measurements to allow comparison across datasets in the literature. Based on these findings, at present the lipophilicity-based models for predicting microsomal or hepatocyte binding can be used to give an early indication of microsomal or hepatocyte binding but for compounds where more certainty is needed (e.g. for incorporation into PBPK models) the in vitro binding should be measured using an appropriately calibrated assay where the performance of the assay for compounds with a range of physicochemistry and binding properties is known.
Supplemental Material
Download Zip (1.4 MB)Acknowledgments
The authors would like to thank all Simcyp consortium members who contributed their data for this research work. They also would like to thank Eleanor Savill and Anna Kenworthy for their assistance with the technical preparation of the manuscript and submission.
Disclosure statement
IG, DBT, HK, RS, SN, HM and MJ are employees of Certara UK Limited (Simcyp Division) and may hold shares in Certara. ST and BJ are employees of Pharmaron UK and may hold shares in Pharmaron. The other authors report no declarations of interest.
References
- Abraham MH, Austin RP. 2012. The effect of ionized species on microsomal binding. Eur J Med Chem. 47(1):202–205.
- Alves DS, Perez-Fons L, Estepa A, Micol V. 2004. Membrane-related effects underlying the biological activity of the anthraquinones emodin and barbaloin. Biochem Pharmacol. 68(3):549–561.
- Austin RP, Barton P, Cockroft SL, Wenlock MC, Riley RJ. 2002. The influence of nonspecific microsomal binding on apparent intrinsic clearance, and its prediction from physicochemical properties. Drug Metab Dispos. 30(12):1497–1503.
- Austin RP, Barton P, Mohmed S, Riley RJ. 2005. The binding of drugs to hepatocytes and its relationship to physicochemical properties. Drug Metab Dispos. 33(3):419–425.
- Avdeef A, Bendels S, Di L, Faller B, Kansy M, Sugano K, Yamauchi Y. 2007. PAMPA–critical factors for better predictions of absorption. J Pharm Sci. 96(11):2893–2909.
- Barr JT, Lade JM, Tran TB, Dahal UP. 2019. Fraction unbound for liver microsome and hepatocyte incubations for all major species can be approximated using a single-species surrogate. Drug Metab Dispos. 47(4):419–423.
- Beaumont K, Gardner I, Chapman K, Hall M, Rowland M. 2011. Toward an integrated human clearance prediction strategy that minimizes animal use. J Pharm Sci. 100(10):4518–4535.
- Chang G, Steyn SJ, Umland JP, Scott DO. 2010. Strategic use of plasma and microsome binding to exploit in vitro clearance in early drug discovery. ACS Med Chem Lett. 1(2):50–53.
- Chen S, Prieto Garcia L, Bergstrom F, Nordell P, Grime K. 2017. Intrinsic clearance assay incubational binding: a method comparison. Drug Metab Dispos. 45(4):342–345.
- Deshmukh SV, Harsch A. 2011. Direct determination of the ratio of unbound fraction in plasma to unbound fraction in microsomal system (fu p/fu mic) for refined prediction of phase I mediated metabolic hepatic clearance. J Pharmacol Toxicol Methods. 63(1):35–39.
- Gao H, Steyn SJ, Chang G, Lin J. 2010. Assessment of in silico models for fraction of unbound drug in human liver microsomes. Expert Opin Drug Metab Toxicol. 6(5):533–542.
- Gao H, Yao L, Mathieu HW, Zhang Y, Maurer TS, Troutman MD, Scott DO, Ruggeri RB, Lin J. 2008. In silico modeling of nonspecific binding to human liver microsomes. Drug Metab Dispos. 36(10):2130–2135.
- Gertz M, Kilford PJ, Houston JB, Galetin A. 2008. Drug lipophilicity and microsomal protein concentration as determinants in the prediction of the fraction unbound in microsomal incubations. Drug Metab Dispos. 36(3):535–542.
- Gouliarmou V, Lostia AM, Coecke S, Bernasconi C, Bessems J, Dorne JL, Ferguson S, Testai E, Remy UG, Brian Houston J, et al. 2018. Establishing a systematic framework to characterise in vitro methods for human hepatic metabolic clearance. Toxicol in Vitro. 53:233–244.
- Grime KH, Barton P, McGinnity DF. 2013. Application of in silico, in vitro and preclinical pharmacokinetic data for the effective and efficient prediction of human pharmacokinetics. Mol Pharm. 10(4):1191–1206.
- Hallifax D, Houston JB. 2006. Binding of drugs to hepatic microsomes: comment and assessment of current prediction methodology with recommendation for improvement. Drug Metab Dispos. 34(4):724–726; author reply 727.
- Hallifax D, Houston JB. 2007. Saturable uptake of lipophilic amine drugs into isolated hepatocytes: mechanisms and consequences for quantitative clearance prediction. Drug Metab Dispos. 35(8):1325–1332.
- Houston JB. 1994. Utility of in vitro drug metabolism data in predicting in vivo metabolic clearance. Biochem Pharmacol. 47(9):1469–1479.
- Iwatsubo T, Hirota N, Ooie T, Suzuki H, Sugiyama Y. 1996. Prediction of in vivo drug disposition from in vitro data based on physiological pharmacokinetics. Biopharm Drug Dispos. 17(4):273–310.
- Kilford PJ, Gertz M, Houston JB, Galetin A. 2008. Hepatocellular binding of drugs: correction for unbound fraction in hepatocyte incubations using microsomal binding or drug lipophilicity data. Drug Metab Dispos. 36(7):1194–1197.
- Kosugi Y, Hosea N. 2020. Direct comparison of total clearance prediction: computational machine learning model versus bottom-up approach using in vitro assay. Mol Pharm. 17(7):2299–2309.
- Mannhold R, Poda GI, Ostermann C, Tetko IV. 2009. Calculation of molecular lipophilicity: state-of-the-art and comparison of log P methods on more than 96,000 compounds. J Pharm Sci. 98(3):861–893.
- Mateus A, Matsson P, Artursson P. 2013. Rapid measurement of intracellular unbound drug concentrations. Mol Pharm. 10(6):2467–2478.
- McLure JA, Birkett DJ, Elliot DJ, Williams JA, Rowland A, Miners JO. 2011. Application of the fluorescent probe 1-anilinonaphthalene-8-sulfonate to the measurement of the nonspecific binding of drugs to human liver microsomes. Drug Metab Dispos. 39(9):1711–1717.
- Nagar S, Korzekwa K. 2012. Commentary: nonspecific protein binding versus membrane partitioning: it is not just semantics. Drug Metab Dispos. 40(9):1649–1652.
- Nagar S, Korzekwa K. 2017. Drug distribution. Part 1. Models to predict membrane partitioning. Pharm Res. 34(3):535–543.
- Nair PC, McKinnon RA, Miners JO. 2016. A fragment-based approach for the computational prediction of the nonspecific binding of drugs to hepatic microsomes. Drug Metab Dispos. 44(11):1794–1798.
- Nordell P, Svanberg P, Bird J, Grime K. 2013. Predicting metabolic clearance for drugs that are actively transported into hepatocytes: incubational binding as a consequence of in vitro hepatocyte concentration is a key factor. Drug Metab Dispos. 41(4):836–843.
- Obach RS. 1997. Nonspecific binding to microsomes: impact on scale-up of in vitro intrinsic clearance to hepatic clearance as assessed through examination of warfarin, imipramine, and propranolol. Drug Metab Dispos. 25(12):1359–1369.
- Obach RS. 1999. Prediction of human clearance of twenty-nine drugs from hepatic microsomal intrinsic clearance data: an examination of in vitro half-life approach and nonspecific binding to microsomes. Drug Metab Dispos. 27(11):1350–1359.
- Pagliara A, Carrupt PA, Caron G, Gaillard P, Testa B. 1997. Lipophilicity profiles of ampholytes. Chem Rev. 97(8):3385–3400.
- Pelkonen O, Turpeinen M. 2007. In vitro-in vivo extrapolation of hepatic clearance: biological tools, scaling factors, model assumptions and correct concentrations. Xenobiotica. 37(10–11):1066–1089.
- Poulin P, Collet SH, Atrux-Tallau N, Linget JM, Hennequin L, Wilson CE. 2019. Application of the tissue composition-based model to minipig for predicting the volume of distribution at steady state and dermis-to-plasma partition coefficients of drugs used in the physiologically based pharmacokinetics model in dermatology. J Pharm Sci. 108(1):603–619.
- Poulin P, Haddad S. 2011. Microsome composition-based model as a mechanistic tool to predict nonspecific binding of drugs in liver microsomes. J Pharm Sci. 100(10):4501–4517.
- Poulin P, Haddad S. 2013. Hepatocyte composition-based model as a mechanistic tool for predicting the cell suspension: aqueous phase partition coefficient of drugs in in vitro metabolic studies. J Pharm Sci. 102(8):2806–2818.
- Riccardi K, Ryu S, Lin J, Yates P, Tess D, Li R, Singh D, Holder BR, Kapinos B, Chang G, et al. 2018. Comparison of species and cell-type differences in fraction unbound of liver tissues, hepatocytes, and cell lines. Drug Metab Dispos. 46(4):415–421.
- Riccardi K, Ryu S, Tess D, Li R, Luo L, Johnson N, Jordan S, Patel R, Di L. 2020. Comparison of fraction unbound between liver homogenate and hepatocytes at 4 degrees C. AAPS J. 22(4):91.
- Riede J, Camenisch G, Huwyler J, Poller B. 2017. Current in vitro methods to determine hepatic Kpuu: a comparison of their usefulness and limitations. J Pharm Sci. 106(9):2805–2814.
- Ring BJ, Chien JY, Adkison KK, Jones HM, Rowland M, Jones RD, Yates JW, Ku MS, Gibson CR, He H, et al. 2011. PhRMA CPCDC initiative on predictive models of human pharmacokinetics, part 3: comparative assessement of prediction methods of human clearance. J Pharm Sci. 100(10):4090–4110.
- Rodgers T, Rowland M. 2006. Physiologically based pharmacokinetic modelling 2: predicting the tissue distribution of acids, very weak bases, neutrals and zwitterions. J Pharm Sci. 95(6):1238–1257.
- Rusinova R, Herold KF, Sanford RL, Greathouse DV, Hemmings HC, Jr., Andersen OS. 2011. Thiazolidinedione insulin sensitizers alter lipid bilayer properties and voltage-dependent sodium channel function: implications for drug discovery. J Gen Physiol. 138(2):249–270.
- Suenderhauf C, Parrott N. 2013. A physiologically based pharmacokinetic model of the minipig: data compilation and model implementation. Pharm Res. 30(1):1–15.
- Tess DA, Ryu S, Di L. 2022. In vitro – in vivo extrapolation of hepatic clearance in preclinical species. Pharm Res. 39(7):1615–1632.
- Treyer A, Ullah M, Parrott N, Molitor B, Fowler S, Artursson P. 2019. Impact of intracellular concentrations on metabolic drug-drug interaction studies. AAPS J. 21(5):77.
- Turner DB, Rostami-Hodjegan A, Tucker GT, Rowland-Yeo KR. 2006. Prediction of Non-specific hepatic microsomal binding from readily available physicochemical properties. Drug Met Rev. 38(S1):162.
- Wang T, Whitcher-Johnstone A, Keith-Luzzi M, Chan TS. 2021. HLM-beads: rapid assessment of nonspecific binding to human liver microsomes using magnetizable beads. Drug Metab Dispos. 49(12):1056–1062.
- Winiwarter S, Chang G, Desai P, Menzel K, Faller B, Arimoto R, Keefer C, Broccatell F. 2019. Prediction of fraction unbound in microsomal and hepatocyte incubations: a comparison of methods across industry datasets. Mol Pharm. 16(9):4077–4085.
- Zhang Y, Yao L, Lin J, Gao H, Wilson TC, Giragossian C. 2010. Lack of appreciable species differences in nonspecific microsomal binding. J Pharm Sci. 99(8):3620–3627.
- Zhou S, Kestell P, Paxton JW. 2002. Non-specific binding of the experimental anti-cancer drug 5,6-dimethylxanthenone-4-acetic acid (DMXAA) in liver microsomes from various species. J Pharm Pharmacol. 54(7):997–1003.