
Abstract
The metabolism and pharmacokinetics of fasiglifam (TAK-875, 2-[(3S)-6-[[3-[2,6-dimethyl-4-(3-methylsulfonylpropoxy)phenyl]phenyl]methoxy]-2,3-dihydro-1-benzofuran-3-yl]acetic acid), a selective free fatty acid receptor 1 (FFAR1)/GPR40 agonist, were studied following intravenous (5 mg/kg) and oral administration (10 and 50 mg/kg) to male and female Sprague Dawley rats.
Following intravenous dosing at 5 mg/kg, peak observed plasma concentrations of 8.8/9.2 µg/ml were seen in male and female rats respectively.
Following oral dosing, peak plasma concentrations at 1 h of ca. 12.4/12.9 µg/ml for 10 mg/kg and 76.2/83.7 µg/ml for 50 mg/kg doses were obtained for male and female rats respectively. Drug concentrations then declined in the plasma of both sexes with t1/2’s of 12.4 (male) and 11.2 h (female). Oral bioavailability was estimated to be 85-120% in males and females at both dose levels.
Urinary excretion was low, but in a significant sex-related difference, female rats eliminated ca. 10-fold more drug-related material by this route.
Fasiglifam was the principal drug-related compound in plasma, with 15 metabolites, including the acyl glucuronide, also detected. In addition to previously identified metabolites, a novel biotransformation, that produced a side-chain shortened metabolite via elimination of CH2 from the acetyl side chain was noted with implications for drug toxicity.
Introduction
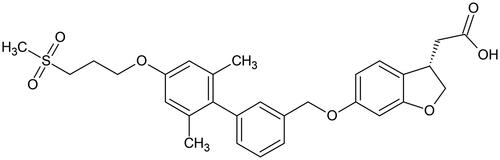
Fasiglifam (TAK-875, 2-[(3S)-6-[[3-[2,6-dimethyl-4-(3-methylsulfonylpropoxy)phenyl]phenyl] -methoxy]-2,3-dihydro-1-benzofuran-3-yl]acetic acid, ) was designed as a selective free fatty acid receptor 1 (FFAR1)/GPR40 agonist for use in the treatment of diabetes (Kaku Citation2013). However, it was withdrawn from late stage development due to hepatotoxicity (Kaku et al. Citation2015, Citation2016). Previous studies in the rat have shown that fasiglifam was well absorbed after PO dosing, with good bioavailability following which drug and metabolites were then excreted mainly via the faeces following biliary elimination (Kogame et al. Citation2019a, Citation2019b). In the rat the observed biotransformations involved formation of the acyl glucuronide (fasiglifam-G) as the major metabolite of fasiglifam, together with smaller quantities of the taurine conjugate. Fasiglifam and these 2 conjugates formed the majority of the drug-related material in rat bile (accounting for 46.3, 27.0 and 6.7% of the dose respectively) (Kogame et al. Citation2019a). Indeed, acyl glucuronidation was found to be the predominant elimination pathway for fasiglifam, not only in the rat but in all species tested, including humans (Kogame et al. Citation2019a).
Figure 1. Fasiglifam (TAK-875), a GPR40 agonist withdrawn from phase III trials after the observation of elevated liver enzymes.
With respect to the circulation of drug-related material, fasiglifam itself formed the major component in the plasma of all species. A minor oxidative cleavage metabolite (M-I) was observed in both rat and human plasma (<10% of plasma radioactivity). In human plasma, hydroxylated fasiglifam (T-1676427), fasiglifam-G, and the glucuronide of M-I were also detected as additional minor metabolites (<2% of plasma radioactivity) (Kogame et al. Citation2019a). Fasiglifam and its acyl glucuronide were shown to be substrates of BCRP and Mrp2/MRP2 in the same study, respectively (Kogame et al. Citation2019a).
Here, we describe studies on fasiglifam following administration to male and female rats at doses of 5 mg/kg IV and 10 or 50 mg/kg PO. The study was designed in part to investigate the use of microsampling and rapid UHPLC analysis, coupled with advanced MS and ion mobility (IM), to provide comprehensive pharmacokinetic and metabolic profiles on target compounds. However, we also hope that the use of both these and, subsequently, ‘omic’ tools might cast further light on the biochemical effects of fasiglifam.
Materials and methods
Solvents and chemicals
Solvents (LC/MS grade water, acetonitrile (ACN) 0.1% formic acid (FA) in water and 0.1% formic acid in ACN) and ammonium acetate were obtained from Sigma Aldrich (Dorset, UK). Instrument calibration used the ‘Waters Major Mix IMS/ToF Calibration Kit for IMS’ (Waters Corp., Milford, USA). Leucine-enkephalin (Sigma Aldrich) was used to provide a lockmass for mass spectrometry (MS). Fasiglifam was purchased from Cambridge Isotopes (Cambridge, UK).
Study conduct
The study was performed using 15 male and 9 female Sprague Dawley rats, 7 weeks of age and weighing between 170.3 and 260.5 g (Janvier Laboratories, Toulouse, France) with animals housed at the Evotec France SAS animal facility. The rats were housed, by group, for an acclimatisation period (3 days, n = 2 per cage) and then individually in metabowls for the 96 h of the study. The Evotec facility is accredited by both the French Ministry of Agriculture (D 31 555 09) and the Association for Assessment and Accreditation of Laboratory Animal Care International (AAALAC# 001433). This study complied with the corresponding project APAFIS#04.932.02 and was reviewed by the Evotec France Ethical Committee (identified below as CEPAL: CE 029) and authorised by the French Ministry of Education, Advanced Studies and Research prior to commenncement. In addition, the study was reviewed by the SBEA (internal Animal Welfare Body) (Evotec, Tolouse, France). The doses and formulations used for both oral (PO) and intravenous (IV) administration were based on those previously used by Kogame et al. (Citation2019a).
Intravenous administration of fasiglifam (5 mg/kg)
For IV administration fasiglifam was formulated as a clear and colourless solution in N-methyl-2-pyrrolidone (NMP)/50 mM phosphate buffer (pH 7.4), 10:90 v/v at 1.0 mg/mL and administered (5 mL/kg), via the tail vein, to 3 male and 3 female Sprague Dawley rats as a single 5 mg/kg (1 mg/mL, 10 mL/kg) dose. A further 3 male rats were administered the drug-free vehicle as a control group.
Rats were housed individually in metabowls for the collection of urine and faeces. Blood samples were obtained at pre-dose, 1, 3, 6, 12, 24, 48 and 96 h post-dose. At each time point 100 µL of blood was collected (2 × 50 µL) from the saphenous vein into Minivette POCT K2-EDTA coated capillaries. At the terminal point (96 h post-dose) an additional 0.5 mL of blood was collected by exsanguination via the vena cava. Plasma was then prepared from the blood, which was transferred into 1.5 ml microcentrifuge tubes for centrifugation at 8,000 g (3 min, 4 °C). Aliquots of the resulting plasma (up to 40 µL/sample) were transferred to a 96-well plate and an equivalent volume of 0.5 M ammonium formate buffer, pH 3.0 (30%, v/v) was added to each well to stabilise acyl glucuronides. The 96 well plates were stored at −80 °C until shipment and analysis.
In addition to blood, urine was collected predose (overnight before dosing) and over the periods 0–24, 24–48 and 48–96 h post-administration. Samples (both IV and PO routes) were transferred from the study site to Waters Corp., (Wilmslow, UK) on solid carbon dioxide. All samples were stored on receipt at −80°C until analysis as described below.
Oral (PO) administration of Fasiglifam
For PO administration 15 rats were randomly allocated into two treatment groups and dosed orally by gavage at either 10 or 50 mg/kg (n = 3 males and 3 females per dose level) with fasiglifam as a suspension in methylcellulose/water (0.5/99.5 w/v) or with drug-free vehicle in the control group (3 males). Fasiglifam was formulated as 5 or 10 mg/mL suspensions (depending upon the dose) and administered at 10 mL/kg. Blood, urine and faeces sampling and storage were as for the IV route.
Sample preparation for the bioanalysis of Fasiglifam in rat plasma
Rat plasma samples (10 µL) were prepared for analysis by precipitating protein with 40 µL of ACN, vortex mixing and centrifugation 25,000 g for 5 min. The supernatant was diluted 1:100 v/v with 25% ACN. An external calibration curve, prepared in drug-free control rat plasma, over the range 0 to 10,000 ng/mL and comprising a solvent blank (1:3 v/v ACN:H2O) a blank (extracted matrix blank) and 7 concentrations of fasiglifam (0, 10, 50, 100, 500, 2000, 5000 and 10,000 ng/mL). Quality control (QC) samples containing fasiglifam were prepared with concentrations of 25, 2000 and 8000 ng/mL. Samples were analysed in the following order; solvent blank; blank; QCs (25, 2000, 8000 ng/mL); blank; calibration curve (0, 10, 50, 100, 500, 2000, 5000 and 10,000 ng/mL) samples; blank; extracted plasma samples; blank; calibration curve (0, 10, 50, 100, 500, 2000, 5000 and 10,000 ng/mL); matrix blank; QCs (25, 2000, 8000 ng/ml); blank. To be accepted, the batch QC samples had to be within ±15% of the nominal value with a minimum of 2/3 achieving this, and with no more than one failure at each concentration.
Urine analysis
Urine samples were analysed for fasiglifam using the same sample preparation approach as that employed for the analysis of plasma. Urine calibration curves and QCs were prepared in control rat urine produced by the pooling of urine from the vehicle-only samples. A standard calibration line was prepared at concentrations of 0, 0.1, 0.5, 1, 5, 10, 50 and 100 ng/mL with QCs made at 2, 40 and 80 ng/mL.
In some cases where the measured concentrations in the samples were found to be above the ULOQ (the top standard in the calibration curve) re-analysis was performed following a 1:10 dilution with control urine and using a new calibration line and QC’s.
U(H)PLC/MS/MS Sample analysis for fasiglifam determination
Plasma extracts (10 µL) and urine were analysed using an ACQUITY™ UPLC™ I-Class System connected to a Xevo™ TQ-S Micro tandem quadrupole mass spectrometer (Waters Corp., Wilmslow, UK). UPLC used a 2.1 × 50 mm BEH™ C18 1.7 µm column (Waters Corp, Milford, USA) maintained at 60 °C at a flow rate of 500 µL/min. A linear reversed-phase (RP) solvent gradient, formed from 0.1% FA (v/v) in 10 mM aqueous ammonium formate (solvent A) and 0.1% FA (v/v) in ACN (solvent B) was used for analysis. The gradient composition ranged from from 50 to 60% solvent B over 0.9 min and was followed by a column flush using 95% solvent B for 1 min, and then re-equilibration for 0.6 min prior to the next injection. MS analysis was performed at unit mass resolution using positive electrospray ionisation (+ve ESI) at a capillary voltage of 2.2 kV, and a source temperature of 150 °C. The cone gas flow was 50 L/h and the gas used was nitrogen. The desolvation gas temperature was 650 °C, the desolvation gas flow was 1000 L/h. The data were collected using MassLynx™ V 4.1 (Waters Corp., Milford, USA). MRM (Multiple Reaction Monitoring) transitions were monitored for the MS quantification and confirmation of fasiglifam using various collision energies (CE) and cone voltages (CV) as indicated in brackets after the monitored transition. For the quantification of fasiglifam m/z 525.14 > 121.0 (CV = 60 V, CE = 33 eV) was used whilst the ions m/z 525.14 > 331.1 (CV = 60 V, CE = 18 eV) and 525.14 > 465.1 (CV = 60 V, CE = 8 eV) were used for the confirmation of peak identity.
Metabolite profiling and identification of fasiglifam metabolites in plasma
Samples for metabolite detection and identification were prepared by pooling equal amounts (2 µL/sample) for both the PO and IV routes from all of the samples from 1–96 h post dose for each route of administration. These samples were then mixed with 4 volumes of ACN to precipitate plasma proteins. After vortex mixing and centrifugation at 25000 g for 5 mins, 10 µL of the resulting supernatants were diluted to 500 µL with 490 µL of 1:1 v/v ACN:H2O to provide a sample suitable for analysis. The extracted rat plasma samples were analysed using reversed-phase (RP) liquid chromatography using an ACQUITY UPLC I-Class System connected to a SELECT SERIESTM CyclicTM IMS/MS (Waters Corp., Wilmslow, UK) (Giles et al. Citation2019) operating in single pass, resolution (V optics) mode. Briefly, a 2 µL aliquot of the sample was loaded onto a 2.1 × 100 mm ACQUITYTM HSS T3 1.7 µm C18 column (Waters Corp., Milford, USA). The column was maintained at 40 °C and eluted with a linear solvent gradient of 40–70% 0.1% aqueous formic acid: acetonitrile over 10 min at a flow rate of 600 µL/min.
IM and MS data were collected in both positive and negative electrospray ionisation (ESI) modes. The capillary voltage was 3.0 kV (ESI+) or 2.0 kV (ESI-), cone voltage was 25 V, source temperature was set at 120 °C with a cone gas (nitrogen) flow rate of 50 L/h, desolvation gas (nitrogen) temperature of 600 °C and nebulisation gas (nitrogen) flow of 800 L/h. Ion mobility settings for a single pass consisted of cIM pressure at 2.3 mbar (nitrogen), IM travelling wave height at 35 V and constant velocity of 375 m/s. Following ionisation the ions were passed into the ion mobility cell. The helium cell (situated at the front of the drift cell) gas flow was fixed at 180 mL/min, and the IMS gas was nitrogen with a flow fixed at 90 mL/min. A wave velocity of 650 m/s, with a wave height of 40 V, an EDC delay coefficient of 1.54 V, a bias of 3, a mobility RF offset of 250, an RF offset of 300 V, an IMS wave delay of 1000 µs and a DC entrance of 20 V were applied. The IMS device was calibrated using the Waters Major Mix IMS/ToF Calibration Kit for IMS over the CCS range = 130–306 Å2 to allow for CCS values to be determined in nitrogen. Following IM separation, the ions were subjected to MSE data acquisition over the m/z range 50–1200. Continuum mode was used for the experiment with a low collision energy of 20 eV and a collision energy ramp from 20–40 eV. Leucine encephalin (MW = 55.62771 (ESI+): 554.2615 (ESI-) was used as a lock mass with a scan collected every 30 s and a cone voltage fixed at 40 V. cIM-MS data were collected using a web-based user interface which is based on existing MassLynx Software (Waters Corp., Wilmslow, UK).
Metabolite profiling and identification for fasiglifam metabolites in urine
Reversed-phase profiling of urine for fasiglifam and its metabolites was performed using 20 µL of individual urine samples to which 20 µL of LCMS grade water was added (in 1.5 mL centrifuge tubes). A further 350 µL of LCMS grade ACN was then added to each sample, with vortex mixing. After 10 min (at 2–8 °C) the mixture was centrifuged (13,000 rcf, 10 min.) and 100 µL of the supernatant was further diluted 1:1 with LCMS grade water to increase the aqueous composition of the sample prior to RP-U(H)PLC/MS analysis.
Pharmacokinetic analysis
Basic, non-compartmental pharmacokinetic analysis was performed using the freeware program PKSolver (Zhang et al. Citation2010) to calculate T1/2, AUC, oral bioavailability, volume of distribution, etc. (All of the individual plasma concentration data used for calculating these properties are provided in Supplementary Tables S3–S8).
Data analysis for drug metabolite identification
UHPLC-MS data were imported into waters_connectTM (Waters, Wilmslow UK) and processed using UNIFITM 1.9.13 (Waters, Wilmslow UK). Fasiglifam and its metabolites were identified using an IMS-enabled pathway profiling method. Previously reported metabolite structures were included for targeted analysis, and a virtual library of putative metabolite structures was generated by combining likely cleavages with standard phase functionalisation and conjugation biotransformations (Mortishire-Smith et al. Citation2009). Potential matches were evaluated for drug-related likelihood on the basis of a variety of mass spectral features including whether or not they had product ions or neutral losses in common with the parent drug. This could be explained by a combination of likely biotransformations, which were inside plausible mass defect space (Mortishire-Smith et al. Citation2009), and had substantially higher intensity in analyte samples compared with control samples. Assignment of metabolite identities and tracking of each metabolite across samples was achieved on the basis of retention time, m/z and CCS values.
Results and discussion
Clinical observations
No adverse reactions were observed following IV (5 mg/kg) or PO (10 & 50 mg/kg) administration of fasiglifam (TAK-875) in this study.
Drug and metabolite bioanalysis
Several methods for the determination of fasiglifam concentrations in plasma have been described (e.g. Kogame et al. 2019 a, 2019b; Naik et al. Citation2012). Here the bioanalysis of fasiglifam in the plasma of male and female rats administered with the drug by either IV or PO routes was undertaken using a rapid UHPLC-MS/MS method. Plasma concentrations of fasiglifam were obtained using a ‘fit for purpose’ assay using 10 µL samples. In the absence of a suitable stable isotopically labelled internal standard being available fasiglifam was quantified via an external calibration curve using the drug itself in control rat plasma. The method, involving simple protein precipitation and dilution with water, produced a linear response in rat plasma (r2 = 0.9994) over the concentration range of 10–10,000 ng/mL (using 1/x weighting). Whilst fasiglifam was undetectable in plasma samples from the vehicle-dosed controls, or predose samples, it was quantifiable over the entire 96 h of the study in both male and female rats following either IV or PO administration. All of the QC samples used to monitor the assay were within the acceptance criteria of ±15% of their nominal values.
Pharmacokinetic analysis
Following IV administration of fasiglifam at 5 mg/kg plasma concentrations, as determined by UHPLC/MS/MS, peaked at 8.8 ± 0.9 µg/mL (male) and 9.2 ± 1.2 µg/mL (female) then declined bi-exponentially in both male and female animals with an estimated clearance of 1.7−1.4 L/h. The volume of distribution at steady-state was calculated as 542 and 528 mL/kg and the terminal half-life was 12.4 h for male and 11.2 h for female rats respectively. There was also evidence of a transient increase in plasma concentrations at 24 h However, all animals were very similar in profile, and both sexes gave similar PK data. By 96 h most of the fasiglifam had been eliminated from the plasma with concentrations of less than 20 ng/mL.
The maximum observed plasma concentrations of fasiglifam after PO dosing at 10 mg/kg were 12.4 ± 2.6 and 12.9 ± 3.5 µg/ml for male and female animals respectively and were reached 1 h after administration. Following PO administration at the higher dose of 50 mg/kg the maximum observed mean plasma concentrations were 76.2 ± 3.7 and 83.7 ± 13.2 µg/ml for the male and female rats respectively and, as seen for the 10 mg/kg dose, these were achieved at 1 h postdose (Tables S3−S8). Bioavailability was estimated at between 85–120% for male animals and 91–108% for female animals (using AUC-t). Estimations of the oral half-life of fasiglifam in the rat were 11.1 h for males and 11.6 h for females at the 10 mg/kg dose and 10.3 and 9.8 h for male and female rats respectively for the 50 mg/kg dose. A slight increase in the fasiglifam plasma concentrations was noted at the 24 h post-dose time point in male and female animals at the 10 mg/kg dose and this phenomenon was also observed at 24 h and 48 h after administration of the 50 mg/kg dose to male and females animals respectively. While several phenomena may be responsible for this, the most likely of which is entero-hepatic circulation, perhaps following hydrolysis of the acyl glucuronide, which is known to be excreted as the major fasiglifam metabolite in rat bile (Kogame et al. Citation2019a), further studies would be required to determine the cause of this effect, and care should be exercised not to over-interpret this observation.
The results for the plasma pharmacokinetics are summarised in , and illustrated in for the 50 mg/kg dose for both male and female rats (profiles for the 5.0 mg/kg IV and 10 mg/kg PO doses are provided in Figures S1 and S2, respectively).
Figure 2. Plasma concentration vs time profiles (0–96 h) for fasiglifam dosed orally at 50 mg/kg to A) male and B) female rats respectively.
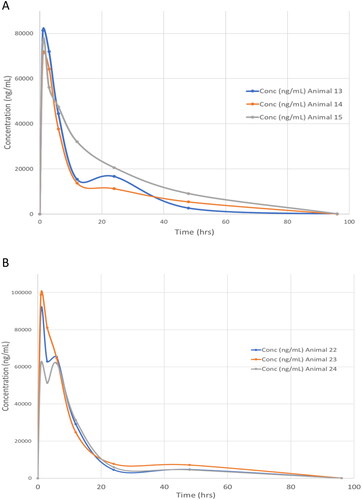
Table 1. Mean Summary Plasma Pharmacokinetic Data for Male and Female Rats following the administration of Fasiglifam at 5 (IV) 10 and 50 (PO) mg/kg.
Urine analysis
As described in the experimental section, urine samples, were collected predose, 0–24, 24–48, and 48–96 h after administration of fasiglifam and were subsequently analysed using the same method employed for plasma analysis. The resulting data are summarised in . For both male and female-derived samples the highest quantities of fasiglifam excreted in the urine were observed in the 0–24 h samples, irrespective of dose or route of administration. By 24–48 h post dose the amounts present in urine had fallen markedly. In the final 48–96 h collections, whilst fasiglifam was still present in the urine of orally dosed rats (with female 50 mg/kg PO samples having the highest concentrations) it was barely detectable in the urine of the IV dosed male rats. From the mean urinary drug excretion data provided in (see Tables S9 − 12 for individual animal data) a clear sex difference can be seen between the male and female-derived samples. Thus, female animals consistently excreted greater amounts of fasiglifam, irrespective of dose or route, with e.g. the 0–24 h urine samples from females containing ca. 10 fold more of the drug. For example, mean totals of fasiglifam of 0.3, 0.73 and 2.44 µg were detected for the female-derived 0–24h urines following dosing at 5 mg/kg IV and 10 mg/kg PO and 50 mg/kg, whilst the equivalent male urine samples contained only 0.03, 0.06 and 0.3 µg respectively. A visual comparison of the changes in fasiglifam concentration with time is given in .
Figure 3. Urinary excretion of fasiglifam by male and female rats following IV (5 mg/kg) and PO (10 and 50 mg/kg) administration. Key in inset to Figure.
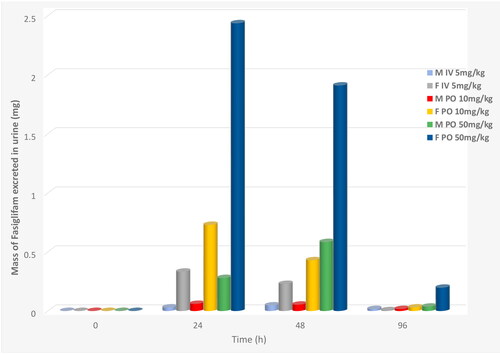
Table 2. Mean Fasiglifam Urinary Excretion Following IV and PO dosing at 5 mg/kg, 10 mg/kg, 50 mg/kg at Predose, 0–24, 24–48 and 48–96hr Post-Administration.
The urine was also examined for evidence of the excretion of the metabolites of the drug detected in plasma and for any additional biotransformation products such as (sulfate and glucuronide conjugates. etc.). After careful examination of the urinary data only metabolite M-I, a product of the oxidative cleavage of the ether linkage of fasiglifam (Kogame et al. Citation2019a), was detected. This metabolite was found in urine, with signal intensities similar to those of the parent compound. However, in the absence of an authentic standard, no attempt to quantify M-I was made.
Whilst interesting, the significance of the sex differences in the urinary excretion of fasiglifam, which represents only a minor route for the elimination of the drug and it’s metabolites, (Kogame et al. Citation2019a) by male and female rats is not clear.
Fasiglifam metabolite profiling and identification in plasma
As indicated in the introduction, the metabolic fate of fasiglifam in rat, and other species, has previously been described (Kogame et al. Citation2019a, Citation2019b). The major reported biotransformation of fasiglifam is the formation of the acyl glucuronide (designated fasiglifam-G). Other, minor, routes of metabolism were noted, including taurine conjugation (fasiglifam-Tau), oxidative cleavage of the ether linkage to form the acid M-I and its subsequent glucuronidation to form M-I-G. In addition, oxidation of one of the aryl methyl groups was observed to form the alcohol T-1676427.
Here, in the absence of a radiolabelled form of the drug to act as a specific tracer, the metabolites of fasiglifam present in both plasma and urine were characterised using a combination of both targeted and untargeted screening. The targeted approach was based on including the previously identified biotransformation products of fasiglifam as ‘expected metabolites’, with defined structures and known m/z values, and during data processing their presence was explicitly sought. Untargeted screening was undertaken in order to find and characterise other drug-related components in the samples. These were identified on the following basis
At least one of the following criteria had to be met: -
The component could be rationalised on the basis of a combination of plausible biotransformations.
The component had at least one product ion in common with the parent compound.
The component had at least one neutral loss in common with the parent.
Each candidate metabolite passing these filtration steps was then further evaluated for compliance with all of the following criteria:-
The component must not have been present in the control sample
The component must have had a response of greater than 400 response units (corresponding to ca 0.05% of the response of the parent compound in the 1 hour plasma sample).
The component must have had a retention time between 2 min and 8 min (to eliminate false positives in the injection front and high organic wash)
The component had a m/z value which was inside the allowed mass defect region for likely metabolites
These filtration steps were applied automatically by the software after creation of the filter. Additional curation of likely drug-related material was done by reviewing the response/timepoint summary plot, since drug metabolites are expected to have a sensible relationship between response and timepoint (i.e. metabolites are unlikely to be present at 1 h, absent at 3 h, but present again at 6 h).
Although both positive and negative ESI data were obtained on these samples, metabolite identification was primarily undertaken using the negative ion data obtained on the 50 mg/kg plasma samples. The product ion spectra were isolated from the sample in which a given metabolite was most intense. On this basis, a total of 15 metabolites were determined as being present in the plasma samples of the 50 mg/kg dose group in samples from at least one timepoint (Figures S3–S18) and these were numbered from M1 to M15 on the basis of their retention time (see ). The product ion spectrum of fasiglifam is shown in , together with the assignments of the 6 most intense product ions (corrected for the theoretical m/z values of the assigned elemental composition). All product ion assignments were within 0.5 mDa of the theoretical m/z values. Single bond cleavage between C10-and C11 (decarboxylation) lead to m/z 479.1892, between O29 and C30 to m/z 403.1552 and between O13 and C14 to m/z 192.0428. The two remaining major product ions involved two concomitant bond cleavages (O29/C30 with C10/C11 to form m/z 359.1653 and O13/C14 with C10/C11 to form m/z 148.0524).
Figure 4. Product ion spectrum and structural assignment of observed major fragment ions for fasiglifam.
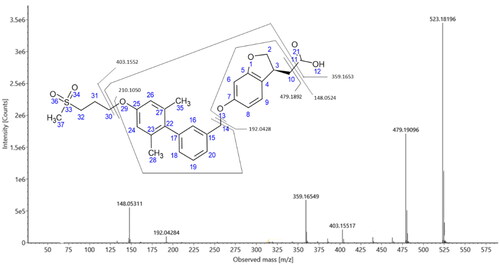
Table 3. Mass spectral, tR, CCS and intensity values for fasiglifam and its metabolites in rat plasma.
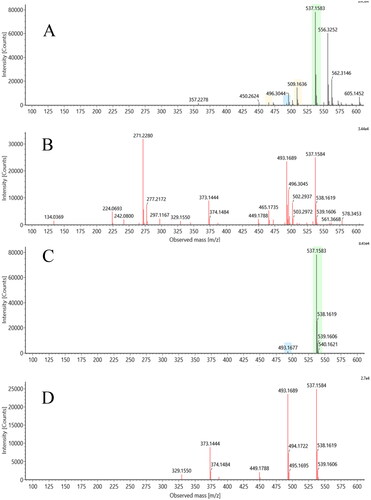
In addition to mass spectrometry, we also employed an ion mobility (IM) step in this investigation. IM performed following UHPLC provides another, orthogonal, separation step that can result in the resolution of the ions of interest from coeluting components. The ability to discriminate ions belonging to the target compound from these coeluting components can result in significant improvements in the resulting mass spectra obtained as shown in . This figure shows a direct comparison of the results obtained for metabolite M12 (M-2H + O) (discussed in more detail below) both with, and without, IM enabled. As can easily be seen, in the absence of IM there are a number of interferences, some of which are similar in intensity to M12 (m/z 537.1583). With the extra resolution provided when IM is applied, interfering ions were filtered out of the data and the product ion spectrum for M12 was no longer subject to their interference, greatly simplifying interpretation and metabolite characterisation.
Figure 5. Effect of ion mobility on mass spectral quality: The upper two panels (A: low energy spectrum, B: high energy spectrum) show precursor and product ion spectra for metabolite M12 of fasiglifam generated without drift time correlation. The lower two panels (C: low energy spectrum, D: high energy spectrum) show the same data after drift time correlation has been applied.
In addition to improving the quality of the mass spectra, the IM data can be used to determine the collision cross section (CCS) of metabolites, which like retention time (tR) is characteristic of the compound under these conditions and can be used to help ‘track’ metabolites across different analyses where perhaps there have been small changes in tR. The mass spectral, tR and CCS values for fasiglifam and its metabolites in rat plasma are summarised in .
As can be seen from , the CCS values for those metabolites subject to biotransformations such as hydroxylation all fall within a relatively narrow range from 219–222.9 Å2 (fasiglifam itself had a CCS value of 219.0 Å2) However, as might be expected, where biotransformations gave rise to major structural differences being introduced into the metabolite compared to fasiglifam itself large changes in CCS were seen, as noted below. All of these properties, but notably the improvement in spectra clarity have been used here (see for an example).
The acyl glucuronide (M + Gluc, M3), taurine conjugate (M + Tau, M7) and cleavage metabolite (M-I, M1) previously reported by Kogame et al. (Citation2019a) were all determined to be present on the basis of unique m/z values and fragment ions. In addition, these three metabolites showed large differences in CCS value compared to fasiglifam itself, with the glucuronide and taurine conjugates increasing to 246.3 and 238.4 Å2 respectively whilst the cleavage product M1 fell to 199.7 Å2 (see ). The glucuronide of TAK-875 MI was not observed. A number of other oxidative metabolites, some of which have not, to our knowledge, been previously reported were also present. Of the detected metaboliotes, two (M2, M8) corresponded to simple oxidations (M + O) and presumably included the major M + O metabolite reported by Kogame et al. (Citation2019a) in which oxidation was localised to the dimethylphenyl ring system.
Analysis of product ions for these species allowed some degree of localisation, with the oxidation on M2 localised to the central biphenyl moiety. Two double oxidations (M + 2O, M4 and M9) were also identified. In the case of M4, both oxidations were localised to the left-hand half of the molecule, while in M9, both oxidations were localised to the dihydrobenzofuranylacetic acid. Three M-2H + O metabolites were identified (M5, M11 and M13). The site of metabolism in both M5 and M11 excluded the alkylsulphone.
Localisation of the biotransformation in M13 to the dihydrobenzofuranylacetic acid moiety can be made on the basis of the following product ion assignments. The ion at m/z 373.144 corresponds to the addition of 14 Da to m/z 359.165 which excludes the alkylsulfone. A new product ion at m/z 329.1550 is consistent with an elemental composition of C23H21O2, and is most easily explained by cleavages of C25–O29 and C3-C10, meaning that the biotransformation is not present in this fragment, and making C10 the most plausible site of the biotransformation.
The biotransformation in M14 (loss of 2H) can also be localised to the 2-position of the dihydrobenzopyran, or the adjacent methylene (C2–C3 or C3–C10), on the following basis. m/z 359.165 and 479.189 are shifted down by 2 Da, eliminating the alkylsulfone as the site of biotransformation. A minor ion in the product ion spectrum of fasiglifam, m/z 210.015, is a more pronounced product ion in the spectrum of M14 and can be assigned to the central biaryl moiety whose structure is conserved in M14. m/z 148.053 is shifted by 1 Da to m/z 147.044, indicating a change in the ion form and consistent with biotransformation of the dihydrobenzopyranomethyl group.
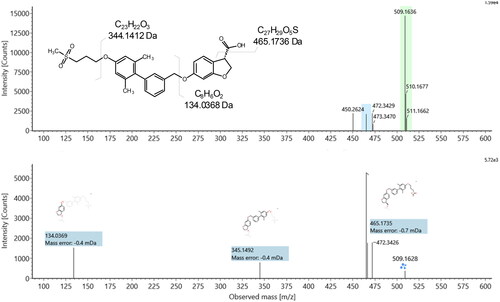
Rationalisation of a structure for M12 was made easier by the assignments of the previously unreported metabolites (M13, M-2H + O and M14 (M-H2). On first inspection, there appears to be no obvious simple way for fasiglifam to undergo demethylation, which is the most common mechanism for formation of a M-CH2 metabolite. On closer examination of the product ion spectrum for M13 however, it is apparent that the most likely explanation is chain shortening of the terminal acetic acid (mass spectra shown in ) (all 3 observed product ions are shifted by 14 Da from the parent product ion spectrum (148.053 > 134.037, 359.165 > 345.149, 479.191 > 465.174), together localising the loss of CH2 to the dihydrobenzofuranyl region of the molecule. Loss of CH2 internally from the dihydrobenzofuran is intrinsically less likely (metabolically) than oxidative chain shortening.
Figure 6. Precursor and product ion spectra for the side chain-shortened fasiglifam metabolite M13.
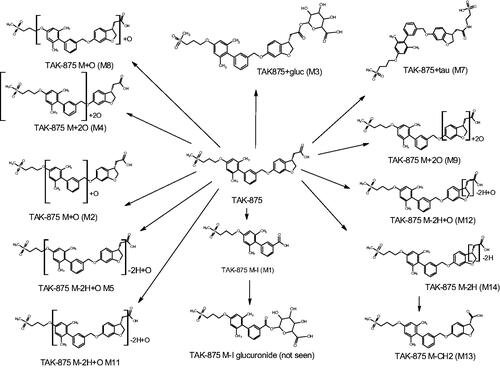
Based on the MS data, and supported by the CCS values obtained during the course of this investigation, the metabolic fate of fasiglifam in the rat, as determined in this study is summarised and illustrated in whilst the mass, tR and CCS values for fasiglifam and its metabolites are given in .
Figure 7. The circulating metabolites of fasiglifam (TAK875), shown as semi-localised structures indicating the likely sites of metabolism where these could not be determined with confidence based on MSMS data alone.
The loss of CH2 and the subsequent appearance of side chain-shortened carboxylic acid metabolites is however, not unprecedented and indeed this type of biotransformation was originally observed in in vitro studies on diclofenac (2-[2-(2,6-dichlorophenyl)aminophenyl] ethanoic acid) by Grillo et al. (Citation2008) and subsequently confirmed in vivo (Sarda et al. Citation2012). Grillo et al. (Citation2008) concluded that this reaction was the result of a CYP450 3A4-mediated oxidative decarboxylation leading to a further, novel, bioactivation pathway. From their experiments they posited that the decarboxylation of diclofenac was through an intermediate benzylic carbon-centred free radical that underwent either elimination through an O-imine methide that then reacted with GSH, or recombination to form a benzyl alcohol that could be dehydrated to a reactive O-imine methide that could also react with GSH. Whilst we did not see evidence of a glutathione conjugate of the type observed by Grillo et al. (Citation2008) the evidence for metabolism of the carboxylic acid-containing side chain of fasiglifam was clear, and suggestive of the formation of a hydroxylated intermediate (which we did not observe) leading to the production of M12 (via decarboxylation and formation of a carboxylic acid), M13 (oxidation of the putative hydroxylated metabolite to a ketone) and dehydration to M14 (see Figure S18).
Such modifications to ethanoic acid side chains, leading to side chain shortening and a variety of other outcomes, do not appear to be confined to diclofenac, and similar biotransformations have also been detected for the NSAIDS lumirocoxib (Dickie et al. Citation2017) and fenclozic acid (Ekdahl et al. Citation2018). As Grillo et al. (Citation2008) noted in their conclusions, such reactions may have ‘implications with respect to the CYP450-mediated metabolism of structurally related carboxylic acid-containing drugs that may be able to undergo decarboxylation and subsequent elimination- or dehydration-type reactions leading to (for example) imine-, quinone-, or thioquinone-methide chemically reactive, and potentially toxic, intermediates.’
Since the withdrawal of fasiglifam there have been a number of efforts to uncover the mechanism(s) responsible for its toxicity with transporter interactions, reactive metabolites and mitochondrial dysfunction all suggested as being involved (e.g. see. Li et al. Citation2015; Wolenski et al. Citation2017; Otieno et al. Citation2018; Kogame et al. Citation2019b). In repeat dose toxicology studies in rat and dog (Kogame et al. Citation2019b), observed drug-related liver toxicity (granulomatous inflammation and crystal formation in liver tissue and bile ducts) only in dogs. MALDI/MS on dog liver sections identified both fasiglifam and fasiglifam-G in these crystals. They also found that, after 14 days of PO administration to dogs (200 mg/kg/day), concentrations of both drug and glucuronide had greatly exceeded the solubility limit of these compounds (ca. 3000 µg/ml) in the bile and were much higher than those seen in rat. The authors conjectured that this ‘when taken together with lower bile flow rate could cause crystal formation in dog bile’ suggesting that the liver toxicity seen in rat and dog was due to different mechanisms, and its relevance to humans is not clear.
In the case of transporter interactions, Li et al. (Citation2015) demonstrated that fasiglifam inhibited a range of rat transporters (including the efflux transporter MRP/Mrp 2 and the uptake transporters OATP/Oatp and Ntcp) providing a possibly mechanism affecting bile acid and bilirubin homeostasis. Similarly, others have shown effects on transporters in rats and dogs (Wolenski et al. Citation2017) which the authors pointed out had potential consequences for bile acid transport (elevated serum total bile concentrations were one result) and bilirubin homeostasis, etc. Fasiglifam also showed extensive inhibition of transporters in in vitro and in vivo studies in rat, dog and cynomolgus monkeys as well as in vitro experiments using human transporters (Otieno et al. Citation2018). It also appeared that, in addition to the parent drug, the acyl glucuronide was also a transporter inhibitor and exceptionally potent against MRP3. Studies in rat and dog hepatocytes by Kogame et al. (Citation2019b) also showed transport of both fasiglifam and fasiglifam G by MRP 2 and BSEP but suggested, on the basis of inhibitor studies, that passive diffusion was more important for hepatic uptake than transporters.
In addition to its effects on transporters fasiglifam was also shown to inhibit mitochondrial respiration in HepG2 cells and also affected the activities of mitochondrial Complexes 1 and 2 present in mitochondria isolated from rats (Otieno et al. Citation2018).
Apart from the established transporter interactions and effects on mitochondrial function, described above, another potential cause of toxicity is the formation of reactive metabolites and fasiglifam-G, in addition to its transported effects, is a clear candidate for this role. Thus, the well-established reactivity of acyl glucuronides (AG) via transacylation means that these conjugates have long been associated with hepatic toxicity (although establishing a direct relationship has proved elusive). However, even if it should emerge that the acyl glucuronides themselves are not especially toxic but only represent a ‘canary in the coal mine’, the relationship that has been established between the degradaton rate of AG’s and the observation of toxicity is clear (e.g. Sawamura et al. Citation2010; Iwamura et al. Citation2017; Bradshaw et al. Citation2020). By incubating 14C-fasiglifam with hepatocytes it has been possible to demonstrate that covalent binding was reduced by 40% via the use of borneol, but not aminobenzotriazole (ABT), suggesting that glucuronidation rather than P450-related oxidation was responsible (Otieno et al. Citation2018). In addition, they were also able to determine a covalent body burden of 2.0 mg/day. Another type of reactive metabolite formation that is commonly observed for carboxylic acid-containing drugs involves the biosynthesis of acyl-CoA conjugates. These acyl-CoA conjugates are known to be very reactive (Darnell and Weidolf Citation2013), and whilst these can be difficult to detect, due to their relative instability, their downstream products, amino acid conjugates with glycine and taurine, for example, are stable. Fasiglifam-Tau is a known metabolite of fasiglifam and therefore the production of CoA conjugates can be inferred and indeed these were also detected by Otieno et al. (Citation2018) (although the data were not shown). The authors postulated that the incomplete suppression of the covalent binding of fasiglifam-G (despite a 90% fall in its production) might be due in fact to covalent binding via the CoA conjugate. To these two possible mechanisms for covalent binding we can now add a third, given the MS evidence, for the production of reactive metabolites via the oxidative decarboxylation of fasiglifam (empirically resulting in the loss of CH2) shown by the presence of the proposed side chain shortened M13 metabolite.
It therefore seems, from the studies described above, that it would not be unreasonable to ask the question ‘could the ADRs that led to the discontinuation of fasiglifam in the clinic have been predicted from preclinical data?’.
It is widely accepted that metabolic activation to reactive metabolites is a reasonable explanation for the the toxicity of many compounds, but it is increasingly accepted that, particularly for idiosyncratic adverse drug reactions (IADRs), more complex mechanisms exist that depend on several different types of toxicity and which are a function of combinations of these and the individual susceptibilities of the patients themselves. In an attempt to better quantify and predict this, risk factors such as the daily or covalent body burden (CVB) have been suggested for reactive species. When added to a further panel of in vitro tests covering transporter inhibition (Bsep, Mrp 2), mitochondrial toxicity (in HepG2 cells) and cytotoxicity, Thompson et al. (Citation2012), provided a scoring system, based on aggregating the results (as Yes/No outcomes) to provide a risk assessment for compounds. Based on their in vitro hepatocyte study, Otieno et al. (Citation2018) were able to calculate a CVB of 2.0 mg/day, which is well within the zone of concern defined by Thompson et al. (Citation2012). If the results for transporter inhibition (seen in several studies), and effects on mitochondria are combined with the CVB data then it seems clear, as also noted by Otieno et al. (Citation2018), that fasiglifam could be seen to be a moderately high-risk compound. With this information could the risk have been mitigated? Whilst it is difficult to suggest any structural changes that would change the properties of transporter inhibition and mitochondrial effects it does seems possible that 2 of the 3 potential routes for reactive metabolite formation could be either eliminated altogether or reduced. Factors that reduce the transacylation rates of acyl glucuronides are associated with reduced toxicity. So, ibufenac (4-isobutylphenyl)acetic acid), which like fasiglifam has an acetic acid side chain, and was withdrawn because of liver toxicity, forms an acyl glucuronide that has a fast tranacylation rate (Johnson et al. Citation2010). It was replaced by ibuprofen (2-(4-isobutylphenyl)propanoic acid), where the side chain has been modified by methylation of the alpha carbon, adjacent to the carboylic acid moiety. Ibuprofen is relatively non toxic and, although it also forms an acyl glucuronide, has a much slower transacylation rate (particularly the S enantiomer) than ibufenac (e.g. see Johnson et al. 2013). This ability to change transacylation rates by using steric hindrance is a general observation, and modification of fasiglifam in this way would almost certainly have considerably slowed this. In addition, the introduction of a methyl group at this position would also block the oxidative decarboxylation seen for fasiglifam. Whilst representing what would appear, at first sight, to be a minor change to the structure of fasiglifam, with clear benefits to reducing chemical reactivity, the effect of such a change on potency towards GPR40 would clearly require evaluation. reaction
Conclusions
This study has established that the pharmacokinetics of fasiglifam in male and female rats was similar but that there was a clear sex difference in the urinary excretion of fasiglifam. However, in line with previously published data (Kogame et al. Citation2019a) urine was a minor route of excretion. Thus up to10-fold higher drug concentrations were detected in urine samples obtained from females compared to males administered the same dose. The investigation of the plasma for biotransformation products of fasiglifam using UHPLC/cIM/MS identified a number of novel metabolites of the drug. Several of these previously undescribed metabolites, indicative of a novel route of oxidative decarboxylation for the drug, provide evidence for a third pathway for the production of reactive metabolites (in addition to the production of acylCoA- and acylglucuronide conjugates) with potential implications for toxicity. However, in the absence of a more in-depth quantitative of the exposure of the rat to this additional reactive metabolite-producing pathway it is difficult to estimate its importance, if any, to the well-established DILI resulting from the administration of fasiglifam.
Supplemental Material
Download PDF (1.4 MB)Disclosure statement
ID Wilson provides consultancy to a number of organisations including Waters Corp. The other authors report no competing interests.
Additional information
Funding
References
- Bradshaw PR, Athersuch TJ, Stachulski AV, Wilson ID. 2020. Acyl glucuronide reactivity in perspective. Drug Discov Today. 25(9):1639–1650.
- Darnell M, Weidolf L. 2013. Metabolism of xenobiotic carboxylic acids: focus on coenzyme A conjugation, reactivity, and interference with lipid metabolism. Chem Res Toxicol. 26(8):1139–1155.
- Dickie AP, Wilson CE, Schreiter K, Wehr R, Wilson EM, Bial J, Scheer N, Wilson ID, Riley RJ. 2017. The pharmacokinetics and metabolism of lumiracoxib in chimeric humanized and murinized FRG mice. Biochem Pharmacol. 135:139–150.
- Ekdahl A, Weidolf L, Baginski M, Morikawa Y, Thompson RA, Wilson ID. 2018. The metabolic fate of fenclozic acid in chimeric mice with a humanized liver. Arch Toxicol. 92(9):2819–2828. 2018,
- Giles K, Ujma J, Wildgoose J, Pringle S, Richardson K, Langridge D, Green M. 2019. A cyclic ion mobility-mass spectrometry system. Anal. Chem. 91(13):8564–8573.
- Grillo MP, Ma J, Teffera Y, Waldon DJ. 2008. A novel bioactivation pathway for 2-[2-(2,6-dichlorophenyl)aminophenyl]ethanoic acid (diclofenac) initiated by cytochrome P450-mediated oxidative decarboxylation. Drug Metab Dispos. 36(9):1740–1744.
- Iwamura A, Nakajima M, Oda S, Yokoi T. 2017. Toxicological potential of acyl glucuronides and its assessment. Drug Metab Pharmacokinetics. 32(1):2–11.
- Johnson CH, Karlsson E, Sarda S, Iddon L, Iqbal M, Meng X, Harding JR, Stachulski AV, Nicholson JK, Wilson ID, et al. 2010. Integrated HPLC-MS and 1 H-NMR spectroscopic studies on acyl migration reaction kinetics of model drug ester glucuronides. Xenobiotica. 40(1):9–23.
- Kaku K. 2013. Fasiglifam as a new potential treatment option for patients with type 2 diabetes. Expert Opin Pharmacother. 14(18):2591–2600.
- Kaku K, Enya K, Nakaya R, Ohira T, Matsuno R. 2015. Efficacy and safety of fasiglifam (TAK-875), a G protein-coupled receptor 40 agonist, in Japanese patients with type 2 diabetes inadequately controlled by diet and exercise: a randomized, double-blind, placebo-controlled, phase III trial. Diabetes Obes Metab. 17(7):675–681.
- Kaku K, Enya K, Nakaya R, Ohira T, Matsuno R. 2016. Long-term safety and efficacy of fasiglifam (TAK-875), a G-protein-coupled receptor 40 agonist, as monotherapy and combination therapy in Japanese patients with type 2 diabetes: a 52-week open-label phase III study. Diabetes Obes Metab. 18(9):925–929.
- Kogame A, Lee R, Pan L, Sudo M, Nonaka M, Moriya Y, Higuchi T, Tagawa Y. 2019a. Disposition and metabolism of the G protein coupled receptor 40 agonist TAK-875 (Fasiglifam) in rats, dogs, and humans. Xenobiotica. 49(4):433–445.
- Kogame A, Moriya Y, Mori I, Pan L, Morohashi A, Ebihara T, Fukui H, Tagawa Y, Benet LZ. 2019b. Characterization of fasiglifam-related liver toxicity in dogs. Drug Metab Dispos. 47(5):525–534.
- Li X, Zhong K, Guo Z, Zhong D, Chen X. 2015. Fasiglifam (TAK-875) inhibits hepatobiliary transporters: a possible factor contributing to fasiglifam-induced liver injury. Drug Metab Dispos. 43(11):1751–1759.
- Mortishire-Smith RJ, Castro-Perez JM, Yu K, Shockcor JP, Goshawk J, Hartshorn MJ, Hill A. 2009. Generic dealkylation: a tool for increasing the hit-rate ofmetabolite rationalization, and automatic customizationof mass defect filters. Rapid Commun Mass Spectrom. 23(7):939–948.
- Naik H, Vakilynejad M, Wu J, Viswanathan P, Dote N, Higuchi T, Leifke E. 2012. Safety, tolerability, pharmacokinetics, and pharmacodynamic properties of the GPR40 agonist TAK-875: results from a double-blind, placebo-controlled single oral dose rising study in healthy volunteers. J Clin Pharmacol. 52(7):1007–1016.
- Otieno MA, Snoeys J, Lam W, Ghosh A, Player MR, Pocai A, Salter R, Simic D, Skaggs H, Singh B, et al. 2018. Fasiglifam (TAK-875): mechanistic investigation and retrospective identification of hazards for drug induced liver injury. Toxicological Sciences. 163(2):374–384.
- Sarda S, Page C, Pickup K, Schulz-Utermoehl T, Wilson I. 2012. Diclofenac metabolism in the mouse: novel in vivo metabolites identified by high performance liquid chromatography coupled to linear ion trap mass spectrometry. Xenobiotica. 42(2):179–194.
- Sawamura R, Okudaira N, Watanabe K, Murai T, Kobayashi Y, Tachibana M, Ohnuki T, Masuda K, Honma H, Kurihara A, et al. 2010. Predictability of idiosyncratic drug toxicity risk for carboxylic acid-containing drugs based on the chemical stability of acyl glucuronide. Drug Metab Dispos. 38(10):1857–1864.
- Thompson RA, Isin EM, Li Y, Weidolf L, Page K, Wilson I, Swallow S, Middleton B, Stahl S, Foster AJ, et al. 2012. In vitro approach to assess the potential for risk of idiosyncratic adverse reactions caused by candidate drugs. Chem Res Toxicol. 25(8):1616–1632.
- Wolenski FS, Zhu AZX, Johnson M, Yu S, Moriya Y, Ebihara T, Csizmadia V, Grieves J, Paton M, Liao M, et al. 2017. Fasiglifam (TAK-875) alters bile acid homeostasis in rats and dogs: a potential cause of drug induced liver injury. Toxicol Sci. 157:50–61.
- Zhang Y, Huo M, Zhou J, Xie S. 2010. PKSolver: An add-in program for pharmacokinetic and pharmacodynamic data analysis in Microsoft Excel. Comput Methods Programs Biomed. 99(3):306–314.