
 ?Mathematical formulae have been encoded as MathML and are displayed in this HTML version using MathJax in order to improve their display. Uncheck the box to turn MathJax off. This feature requires Javascript. Click on a formula to zoom.
Abstract
In vitro studies using rat, mouse, and human microsomes and hepatocytes on the bacterial β-glucuronidase inhibitor 1-((6,8-dimethyl-2-oxo-1,2-dihydroquinolin-3-yl)methyl)-3-(4-ethoxyphenyl)-1-(2-hydroxyethyl)thiourea) (Inh 1) revealed extensive metabolism in all species.
The intrinsic clearances of Inh 1 in human, mouse, and rat hepatic microsomes were 30.9, 67.8, and 201 µL/min/mg, respectively. For intact hepatocytes intrinsic clearances of 21.6, 96.0, and 129 µL/min/106 cells were seen for human, mouse and rat, respectively.
The metabolism of Inh 1 involved an uncommon desulphurisation reaction in addition to oxidation, deethylation, and conjugation reactions at multiple sites. Six metabolites were detected in microsomal incubations in human and rat, and seven for the mouse. With hepatocytes, 18 metabolites were characterised, 9 for human, and 11 for mouse and rat.
Following IV administration to mice (3 mg/kg), plasma concentrations of Inh 1 exhibited a monophasic decline with a terminal elimination half-life of 0.91 h and low systemic clearance (11.8% of liver blood flow). After PO dosing to mice (3 mg/kg), peak observed Inh 1 concentrations of 495 ng/mL were measured 0.5 h post dose, declining to under 10 ng/mL at 8 h post dose. The absolute oral bioavailability of Inh 1 in the mouse was ca. 26%.
Introduction
As is well recognised, many treatment regimens are limited by the occurrence of adverse drug reactions (ADRs). These can be related to both dose and duration of treatment but, whatever the reason, they can be a major cause of therapeutic failure. Indeed, in some instances (particularly for idiosyncratic ADRs), the result is drug withdrawal. In the case of adverse lower GI tract problems, the hydrolysis of glucuronide conjugates of the drug, or a pharmacologically active metabolite, by gut microbial-derived β-glucuronidase enzymes can be one source of toxicity (e.g. Bhatt et al. Citation2020; LoGuidice et al. Citation2012; Saitta et al. Citation2014; Takasuna et al. Citation1996; Wallace et al. Citation2010; Yauw et al. Citation2018). So, whilst the glucuronide conjugates themselves are, with a few exceptions, pharmacologically inactive, their excretion into the GI tract via the bile may lead to their unwanted reactivation following hydrolysis to the pharmacologically active aglycone.
An example of this is the lower GI toxicity resulting from the treatment of long-term inflammatory conditions (e.g. rheumatoid arthritis) using non-steroidal anti-inflammatory drugs (NSAIDs) such as naproxen, ibuprofen, celecoxib, diclofenac, etc. (Bhatt et al. Citation2018; Allison et al. Citation1992; Bjarnason et al. Citation1993). These drugs can damage both the stomach and intestine, and some of these gastric problems can be reduced by co-administration (either separately or as fixed ratio combinations) using proton pump inhibitors (PPIs) or H2 receptor antagonists (Wallace et al. Citation2011). However, whilst alleviating adverse effects on the stomach, PPIs/H2 receptor antagonists do little for the intestinal toxicity, having indeed been shown to exacerbate the effects of NSAIDs on the small intestine, in part as a result of effects on the gut microbiota (Wallace et al. Citation2011). Intestinal damage by NSAID drugs was, for many years, thought to be caused by the chemically reactive acyl glucuronides, which are often excreted in the bile as major metabolites and were thought to be damaging to the gut mucosa (Boelsterli and Ramirez-Alcantara Citation2011). However, this toxicity can be blocked (at least in rodents) using novel, highly potent, gut bacterial β-glucuronidase (GUS) inhibitors (Bhatt et al. Citation2020; LoGuidice et al. Citation2012; Saitta et al. Citation2014; Takasuna et al. Citation1996; Wallace et al. Citation2010; Yauw et al. Citation2018). Similarly, the dose-limiting lower GI tract toxicity seen with the anticancer drug irinotecan can also be prevented in rodents via the inhibition of the hydrolysis of the glucuronide of its active metabolite SN38 by bacterial β-glucuronidases (Bhatt et al. Citation2020; Roberts et al. Citation2013; Takasuna et al. Citation1996; Wallace et al. Citation2010; Wallace et al. Citation2015). We have previously investigated the in vitro metabolic fate (hepatic microsomes and hepatocytes) and in vivo pharmacokinetics in mouse of the potent GUS inhibitor UNC 10201652 ((4-(8-(piperazin-1-yl)-1,2,3,4-tetrahydro-[1,2,3]triazino [4′,5′:4,5]thieno[2,3-c]isoquinolin-5-yl)morpholine) (Kerins et al. Citation2022).
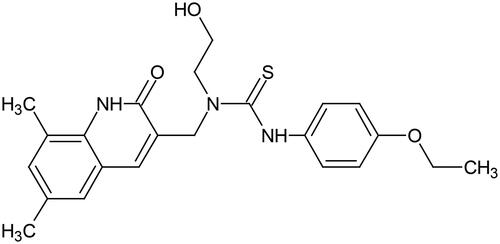
Here we have investigated the metabolic fate of a second, chemically distinct, bacterial β-glucuronidase inhibitor, Inh 1 ([1-((6,8-dimethyl-2-oxo-1,2-dihydroquinolin-3-yl)methyl)-3-(4-ethoxyphenyl)-1-(2-hydroxy-ethyl)thiourea]) (Wallace et al. Citation2010) (). This compound has been used to alleviate GI toxicity caused by SN-38 and NSAIDs in rodents (LoGuidice et al. Citation2012; Roberts et al. Citation2013; Wallace et al. Citation2010, Citation2015; Yauw et al. Citation2018). Clearly however, prior to undertaking studies in patients, DMPK studies need to be performed to assess metabolic risks and design appropriate preclinical toxicology studies. Here we describe enabling in vitro investigations undertaken to obtain protein binding, permeability, metabolic stability and metabolic fate in microsomes and hepatocytes (for rat, mouse, and humans). In addition, a preliminary in vivo study of the intravenous (IV) and oral (PO) pharmacokinetics of Inh 1 was performed in the Swiss Albino mouse in order to estimate its bioavailability and systemic exposure to aid the design of future in vivo preclinical work.
Figure 1. The structure of Inh 1 (1-((6,8-dimethyl-2-oxo-1,2-dihydroquinolin-3-yl)methyl)-3-(4-ethoxy-phenyl)-1-(2-hydroxy-ethyl)thiourea).
Experimental methods
Chemicals and reagents
Inh 1, (1-((6,8-dimethyl-2-oxo-1,2-dihydroquinolin-3-yl)methyl)-3-(4-ethoxyphenyl)-1-(2-hydroxyethyl)thiourea), was synthesised by the authors as described elsewhere (Wallace et al. Citation2010; Wallace et al. Citation2015). Methanol (MeOH) used in the in vitro metabolite profiling studies, and the dimethyl sulfoxide (DMSO) for drug dissolution, were from Fisher Scientific (Loughborough, UK). Aqueous 10 mM ammonium formate with 0.1% formic acid and the acetonitrile (ACN) with 0.1% formic acid were from Alderley Park Glassware (Alderley Park, UK). The ACN used for the analysis of plasma was purchased from RCI Labscan (Bangkok, Thailand) and the 0.1% aqueous formic acid was obtained from Fluka (Fair Lawn, NJ). N-methyl pyrrolidone, polyethylene glycol (PEG-400), sodium carboxymethyl cellulose (NaCMC), and Tween-80 were from Sigma-Aldrich (St. Louis, MO).
Nicotinamide adenine dinucleotide phosphate (NADPH) was obtained from Roche Diagnostics (Mannheim, Germany). The probe compounds used in the in vitro assays (amitriptyline, antipyrine, atenolol, benzydamine, dextromethorphan, diazepam, diphenhydramine, elacridar, oestrone 3-sulphate, metoprolol, MK-571, raloxifene, umbelliferone, verapamil, and warfarin) were from Sigma-Aldrich, whilst talinolol was obtained from Toronto Research Chemicals (Toronto, ON, Canada). For the in vitro incubations Williams E media, HEPES, L-glutamine, non-essential amino acids and lucifer yellow were all purchased from Sigma-Aldrich.
Dulbecco’s modified eagle medium (Gibco™ DMEM; high glucose with GlutaMax and pyruvate), foetal bovine serum (Gibco™; heat inactivated) and Hanks balanced salt solution (HBSS; Gibco™ containing CaCl2 and MgCl2) were from Fisher Scientific.
For in vitro cell permeability incubations, Millicell-96 multiwell cell culture insert plates (polycarbonate membranes with 0.4 μm pore size and of 0.12 cm2 surface area), together with Millicell 96-well transport companion plates, were obtained from Millipore (Watford, UK).
Pooled mixed male and female human liver microsomes and male Sprague Dawley rat liver liver microsomes (HLM and RLM, respectively) were sourced from Corning (Woburn, MA). Male mouse ICR/CD-1 liver microsomes (MuLM) were purchased from BioIVT (Brussels, Belgium). These microsomes were stored at −80 °C until use.
Similarly pooled mixed male and female human hepatocytes, pooled male ICR/CD-1 mouse hepatocytes, and pooled male Sprague Dawley rat hepatocytes were obtained from BioIVT.
Pooled male Sprague Dawley rat and pooled male ICR/CD-1 mouse plasma were also obtained from BioIVT whilst pooled male and female human plasma was purchased from Research Donors Ltd (London, UK).
In vitro cell permeability experiments were performed using Caco-2 cells (HTB37, American Type Culture Collection, supplied as passage number 17).
Determination of plasma protein binding and fraction unbound in plasma and liver microsomal incubations
Protein binding was evaluated using a Rapid Equilibrium Dialysis (RED) system (Thermo Scientific, Waltham, MA) with 0.1 M phosphate buffer (pH 7.4) and biological matrix separated by a semi permeable membrane. The plasma and microsomal protein binding of Inh 1 was determined, in triplicate, by adding the drug to plasma or liver microsomes at 2 µM (final DMSO concentration 0.5% v/v). For plasma, pooled mixed gender human, male CD-1 mouse and male rat Sprague Dawley plasma were used undiluted (final volume 300 μL) whilst for microsomal studies mixed gender human, male CD-1 mouse and male Sprague Dawley rat liver microsomes were used at a concentration of 0.5 mg/mL (final volume 300 μL). The buffer compartment (final volume 500 μL) was supplemented with 0.5% DMSO (v/v) to maintain the DMSO concentration across both compartments. The RED apparatus and the initial solutions of the appropriate biological matrix were incubated at 37 °C at 5% CO2, for 4 h (with agitation at 250 rpm) for system equilibration at which point samples were taken from both sides of the membrane, as well as from the initial solutions. Calibration curves were prepared in blank plasma or microsomes and blank buffer (all containing 0.5% DMSO v/v). The samples and standards were precipitated with 3 volumes of ACN containing internal standard (0.55 μM metoprolol), and centrifuged (1280 g, 30 min, 4 °C), with 50 μL of the supernatant then diluted with 100 μL H2O for LC-MS/MS analysis. A control compound was included for each matrix in each experiment (2 μM amitriptyline for microsomes; 2 μM warfarin for plasma).
Caco-2 permeability of Inh 1
Caco-2 cells were seeded at 1 × 10⁵ cells/cm2 onto Millicell-96 multiwell insert plates. Cells were used between passages 50–60 and were cultured in DMEM cell culture medium (supplemented with foetal bovine serum (10% w/v), L-glutamine (2 mmol/L), nonessential amino acids (1% v/v), and antibiotics penicillin (50 U/mL) and streptomycin (50 μg/mL) at 37 °C with 5% CO2 and a relative humidity of 95%. Media was removed and replenished every 48 or 72 h. The permeability study on Inh 1 was performed on day 20 of culture with cell monolayers rinsed on both apical and basolateral surfaces twice using Hanks Balanced Salt Solution (HBSS) (containing 25 mmol/L HEPES and 4.45 mmol/L glucose, pH 7.4; prewarmed to 37 °C) as assay buffer to prepare the cells for the assay incubations. In order to stabilise physiological parameters, cell monolayers were preincubated with HBSS assay buffer in both apical and basolateral compartments at 37 °C for 40 min.
Following preincubation, donor solutions of HBSS containing 10 µM Inh 1 with, or without, 10 μM elacridar and 100 μM MK-571 which are inhibitors of P-gp and BCRP, and BCRP and MRP-2, respectively, were added to the relevant apical or basolateral donor compartments. Lucifer yellow, a fluorescent integrity marker was also present in the donor solutions (100 μmol/L). In addition, the HBSS assay buffer, containing DMSO or inhibitor mix, was added to the corresponding receiver compartments. This resulted in a final DMSO concentration of ≤1% v/v, for both donor and receiver solutions.
The bidirectional [apical-to-basolateral (A-B) and basolateral-to-apical (B-A)] apparent permeability (Papp) of Inh 1 was determined in duplicate. As positive controls, the permeability of atenolol and antipyrine, the P-gp substrate, talinolol, and the BCRP substrate, oestrone 3-sulphate were also determined. Talinolol and oestrone 3-sulphate were incubated with and without the inhibitor mixture to demonstrate transporter activity in the Caco-2 cells.
After 120 min at 37 °C, apical and basolateral samples were taken and diluted for analysis and Inh 1, together with the positive control compounds, were quantified using LC-MS/MS analysis. The starting concentrations (C0) were obtained using the dosing solution with the experimental recovery calculated from C0 and the concentrations in the apical and basolateral compartments.
The quantification of lucifer yellow in the receiver compartments was performed with a fluorescence plate reader (Tecan Infinite® 200 PRO, Tecan, Männedorf, Switzerland) and these values used to determine its permeation across the Caco-2 cell monolayer. The integrity of the Caco-2 cell monolayer was considered to be acceptable for a well if the calculated Papp for the lucifer yellow was ≤1.0 cm/sec (× 10−6).
In vitro metabolic stability and metabolism studies on Inh 1
Metabolic stability determination in liver microsomes
HLM, MuLM, and RLM, suspended in 0.1 M phosphate buffer (pH 7.4; final protein conc. 0.5 mg/mL) and Inh 1 (final substrate concentration 1 µM; final DMSO concentration 0.25%) were pre-incubated (37 °C) prior to the addition of NADPH (final concentration 1 mM) to initiate the reaction. A control incubation where phosphate buffer pH 7.4 was added instead of NADPH (minus NADPH) was also undertaken. In addition to Inh 1, two positive controls for each species were also independently assayed (diazepam and diphenhydramine in mouse and rat; dextromethorphan and verapamil in human).
Inh 1, plus NADPH, was incubated for 0, 5, 15, 30, and 45 min whilst the minus NADPH control was only incubated for 45 min. These reactions were terminated using ACN (1:3 v/v), to precipitate the protein, at the requisite time points. Termination plates were then centrifuged (1530 g, 30 min, 4 °C) and the supernatants used to determine both the amount of Inh 1 remaining at each timepoint and for metabolite profiling. To determine the intrinsic clearance (CLint) of Inh 1, 50 μL aliquots of each supernatant were diluted with an equivalent volume of deionised water containing metoprolol (0.55 μM) as an internal standard. Metabolite identification (see below) was undertaken using 80 μL of supernatant diluted with the same volume of deionised water.
Hepatocyte metabolic stability
Cryopreserved human, mouse, and rat hepatocytes were incubated with Inh 1, pre-incubated (37 °C) in Williams E media (supplemented with 2 mM L-glutamine and 25 mM HEPES), at a final substrate concentration of 1 µM (final DMSO concentration 0.25%), prior to the introduction of cells (final cell density 0.5 × 10⁶ viable cells/mL) in medium to initiate the reaction. This resulted in a final incubation volume of 500 µL. Incubations with verapamil and umbelliferone (human), verapamil and raloxifene (mouse) or verapamil and umbelliferone (rat) were performed as control substrates, as well as a vehicle control. Incubations were terminated by transferring 40 µL of incubate to 120 µL ACN at the time points 0, 10, 20, 40, 60, and 120 min post initiation. The termination plates were centrifuged at 1530 g at 4 °C for 30 min to precipitate the protein. To determine the CLint of Inh 1, 25 μL of supernatant was diluted with an equal volume of deionised water containing internal standard (0.55 μM metoprolol). For metabolite profiling studies an 80 μL aliquot of the supernatant was diluted with the same volume of deionised water.
Incubations with heat-treated HLM, MuLM, and RLM liver microsomes
In order to determine the potential contribution of flavin monooxygenase (FMO) to the metabolism of Inh 1 an incubation utilising heat inactivation of HLM, MuLM, and RLM was performed. Microsomes were heated in a water bath at 45 °C for 2 min and then cooled on ice prior to performing the assay. Inh 1 (final substrate concentration 1 µM; final DMSO concentration 0.25%) was pre-incubated at 37 °C with control (non-heat inactivated) microsomes (0.5 mg/mL) and heat inactivated microsomes (0.5 mg/mL) and then NADPH was added (final concentration 1 mM) to initiate the reaction. Benzydamine was assayed as a positive control for FMO activity, and diphenhydramine, diazepam, dextromethorphan and verapamil were included as positive controls across the different species of microsomes as described above. For each compound, a control incubation was performed where phosphate buffer pH 7.4 was added instead of NADPH (minus NADPH).
Incubations were performed for 0, 5, 15, 30, and 45 min whilst the minus NADPH control was only incubated for 45 min. Reactions were terminated using ACN (1:3 v/v), to precipitate the protein with samples processed for LC-MS/MS and metabolite identification (see below).
Analysis of in vitro samples by UHPLC-MS/MS
In vitro samples for the assessment of protein binding, Caco-2 cell permeation and the metabolic stability of Inh 1 were analysed using reversed-phase (RP) UHPLC/MS. The system comprised an Acquity™ Binary Solvent Manager (BSM), an Acquity™ 4-position heated column manager, a 2777 Ultra High Pressure Autosampler and a Xevo-TQ MS Triple Quadrupole mass spectrometer (Waters Ltd, Herts, UK). For analysis 4 µL of sample were injected onto an ACQUITY™ HSS T3 (1.8 µm) 2.1 × 30 mm column (Waters Ltd) fitted with a SecurityGuard™ ULTRA Fully Porous Polar C18 cartridge (Phenomenex, Cheshire, UK) guard column. The columns were maintained at 40 °C during the analysis which used mobile phase A consisting of 10 mM ammonium formate with 0.1% v/v formic acid in water and ACN as mobile phase B for the stability assays; for the Caco-2 assay, MeOH was used as mobile phase B. The rapid gradient elution conditions used are shown in Table S1.
Positive ion electrospray ionisation (+ve ESI) MS employing multiple reaction monitoring (MRM) (parent to daughter ion transition 425.80 > 185.65 amu) was used for detection and quantification. A cone voltage of 21 V, collision energy set at 30 eV and a capillary voltage of 0.5 kV were applied using source and desolvation temperatures of 150 °C and 650 °C, respectively. Cone gas (N2) and desolvation gas (N2) flow rates were 50 L/h and 1200 L/h, respectively.
UHPLC/MS-based characterisation of in vitro metabolites of Inh 1
Metabolite profiling of Inh 1 following incubations with either microsomes or hepatocytes was undertaken by RP-UHPLC-MS/MS using a Waters Xevo QTof G2-S MS, an Acquity BSM with an Acquity Column Manager and a 2777 Auto sampler (equipped with a 10 µL loop (Waters Ltd, Herts, UK)). Analysis was performed on 10 µL of sample on a 2.1 × 100 mm C18 ACQUITY UPLC HSS T3 1.8 µM column (Waters Ltd, Herts, UK) at 60 °C. RP gradient elution using 10 mM ammonium formate with 0.1% v/v formic acid in water (mobile phase A) and ACN with 0.1% v/v formic acid (mobile phase B) was used for the separation (Table S2). The injection loop was subjected to both weak (MeOH:H2O (1:9 v/v)) and strong washes (MeOH:acetone:IPA (4:3:3 v/v) with 0.1% formic acid) to eliminate carry over.
MSE was undertaken in electrospray positive ionisation over a scan Range m/z 130–1000, a capillary voltage of 0.3 kV and source and desolvation temperatures of 120 °C and 650 °C respectively. The cone gas (N2) flow was 50 L/h with a desolvation gas flow of 1050 L/h. A cone voltage of 40 V was used with MS data obtained with MSE using a collision energy ramp over the range 20–50 V. Leucine enkephalin (0.4 µg/mL, 10 µL/min) was used to provide a lockmass. Follow on product ion scans were conducted on Inh 1 and its associated metabolites on a scan range of m/z 45–800 using a product ion collision energy ramp of 20–50 V.
For microsomes the 15 min sample for human and 5 min sample for mouse and rat and with hepatocytes, the 60 and 120 min samples in human and the 10 and 20 min samples in mouse and rat were compared against their associated 0 min control sample to establish which and how many metabolites were formed. An additional experiment comparing microsomes with and without heat inactivation utilised the 45 min sample for human and 5 min sample in mouse and rat and compared them against their associated 0 min control samples.
Metabolynx XS (Waters Ltd) with mass defect filtering and a generic dealkylation approach was used to process the data, and the interpretation, structural elucidation and validity of detected metabolites was performed manually.
In vitro data analysis
For protein binding studies in plasma and microsomes, the fraction unbound (fu) of Inh 1 was obtained using EquationEquation (1)(1)
(1) .
(1)
(1)
PC = the Inh 1 concentration on the protein-containing side and PF = Inh 1 concentration on the buffer side.
Hepatocyte protein binding for Inh 1 was estimated from the fu obtained for microsomes as reported in Kilford et al. (Citation2008).
Caco-2 Papp and efflux ratios were determined using EquationEquations (2)(2)
(2) and Equation(3)
(3)
(3)
(2)
(2)
dQ/dt = the rate of permeation of Inh 1across the cells, C0 = was the donor compartment concentration of Inh 1 at t0 and A = the area of the cell monolayer
(3)
(3)
The CLint of Inh 1, determined as μL/min/mg protein for liver-microsomes and μL/min/106 cells for hepatocytes, was obtained from the rate of depletion of Inh 1 over the incubation time. Based on the elimination rate constants (k; -slope) and half-lives (t1/2) obtained, the CLint of the drug in the various in vitro systems was derived using EquationEquations (4)(4)
(4) and Equation(5)
(5)
(5) .
(4)
(4)
(5)
(5)
V = incubation volume (µL) divided by either the microsomal protein content (mg) or the number of hepatocytes (106 cells) used in the incubation.
In vitro hepatic CLint values from the microsomal and hepatocyte incubations, corrected for incubational binding effects with the fu values obtained as detailed above were then scaled to the whole liver in vivo equivalent values using EquationEquation (6)(6)
(6) .
(6)
(6)
In EquationEquation (6)(6)
(6) , SF equals the physiological scaling factors: number of cells per gram of liver (hepatocellularity) or mgs of microsomal protein/g of liver, and the liver/body weight ratio. Microsomal recovery factors of 40, 45, and 61 mg microsomal protein/g liver, hepatocellularity of 120, 125, and 163 (×106) hepatocytes/g liver and liver weights of 25.7, 87.5, and 40 g/kg body weight were used for human, mouse and rat, respectively. Scaling factors were derived from literature, in-house experience, and allometric calculations (Davies and Morris Citation1993, Houston and Carlile Citation1997, Riley et al. Citation2005, Hakooz et al. Citation2006, Smith et al. Citation2008).
The total hepatic clearance (CLh) was estimated with the well-stirred model represented by EquationEquation (7)(7)
(7) .
(7)
(7)
Qh = hepatic blood flow; fub = the fraction unbound in blood; CLint,u = the scaled unbound in vivo CLint determined from liver microsomal or hepatocyte incubations.
Fub was determined by dividing the measured fraction unbound in plasma by the blood to plasma concentration ratio (which was set at 1). Hepatic blood flow was 20.7, 120, and 90 mL/min/kg for human, mouse, and rat, respectively (Davies and Morris Citation1993, Ring et al. Citation2011). Rat hepatic blood flow was derived from literature-wide assessment, in-house experience and allometric calculations.
Inh 1 pharmacokinetic (PK) study in mice
The Pharmacokinetics of Inh 1 were studied using 18 Male Swiss albino mice, 8–12 weeks old, and weighing between 30 and 35 g obtained from In Vivo Biosciences, India. The study was undertaken at Sai Life Sciences (Hyderabad, India) with the mice acclimatised in polypropylene cages (3 mice/cage) for 1 week before drug administration. The animals were housed using standard environmental conditions including a 12 h light/dark cycle with food and filtered water available ad lib. The study was approved by the Institutional Animal Ethics Committee, Pune, India (IAEC/PRT/008-11) and was undertaken in accordance with the Committee for the Purpose of Control and Supervision of Experiments on Animals (CPCSEA), Ministry of Social Justice and Environment, Government of India.
Formulation
Oral (PO) dosing of Inh 1 used a suspension of the drug (0.3 mg/mL) prepared in 0.5% (w/v) NaCMC and 0.1% Tween-80®. IV administration of Inh 1 was as a solution (0.6 mg/mL) formulated in 7.5% (v/v) N-methyl pyrrolidinone (NMP) and 40% polyethyleneglycol400 (PEG400) in water. For PO administration the dose volume was 10 mL/kg and 5 mL/kg for the IV route.
Study design and sample collection
Two groups of Swiss albino mice (9 animals/group/route) were administered Inh 1 (3 mg/kg) by IV or PO routes. Each mouse was sampled three times with blood samples (60 µL) collected from the retroorbital plexus and placed in tubes containing the anticoagulant. Samples were obtained at 0.0, 0.083 (IV only), 0.25, 0.5, 1, 2, 4, 6 (PO only), 8 and 24 h post dose. For the preparation of blood plasma samples were centrifuged at 3200 g (10 min, 4 °C) and the supernatant stored at −70 °C until analysis.
Mouse plasma analysis
Stock solutions of Inh 1 (2 mg/mL) were prepared in DMSO with separate weighing’s used for the calibration and quality control (QC) standards. From these stock solutions working solutions for the calibration and QC samples were obtained after dilution in ACN-H2O (1:1, v/v). Both stock and spiking solutions were then kept at −20 °C until used. Imipramine in ACN (1 μg/mL) was used as an IS. A calibration curve (2–5000 ng/mL; 0.004 μM to 10.45 μM) containing at least 7 nonzero concentrations together with QC’s were prepared in control mouse plasma. For analysis 150 μL of ice cold ACN (containing IS) and 50 μL of each study plasma sample were mixed and then vortexed (1 min) using a VX-2500 multitube vortexer (VWR Lab product pvt Ltd, Mumbai). Following precipitation samples were centrifuged at 1000 g (10 min, 4 °C) (Centrifuge 5810 R, Eppendorf Germany). From the clear supernatant 100 μL was transferred into HPLC vials and taken for LC-MS/MS analysis.
LC-MS/MS analysis of mouse plasma samples
A ‘fit for purpose’ LC-MS/MS method, with an estimated LOQ of 1.7 ng/mL, was used for the quantification of Inh 1 in mouse plasma. The analytical system used a LC-20AD binary pump, a DGU20A degasser, and a SIL-HTC autosampler, equipped with a CTO-20A column oven set to 40 °C (Shimadzu Corp., Kyoto, Japan). The injection volume was 5 µL. HPLC was on a Chromolith Flash (4.6 × 25 mm) column (Merck KGaA, Darmstadt, Germany) using RP gradient elution based on ACN: 0.1% aqueous formic acid (solvent A) and 0.1% aqueous formic acid (solvent B) using a flow-rate of 0.8 mL/min. The retention time (tR) of Inh 1 was 2.44 min. The detection of Inh 1 by MS was via an API-4000 triple quadrupole mass spectrometer (Applied Biosystems, Foster City, CA) in + ve ESI using MRM with the following MS parameters: interface temperature, 550 °C; ion spray voltage, 6.0 kV; ion source gas-1, 50 arbitrary units; ion source gas-2, 70 arbitrary units; collision gas, 6 arbitrary units; declustering potential, 78 V; collision energy, 40 V for Inh 1 and 102 and 25 V for imipramine. The MRM transitions were 426.3 → 186.1 amu for Inh 1 and 281.3 → 86.0 amu for imipramine. The data acquisition and analysis were via Analyst software version 1.5.
Pharmacokinetic analysis
Pharmacokinetic parameters (mean ± SD) for Inh 1 were determined using by non-compartmental analysis (Phoenix® WinNonlin® 6.3 version, Certara Inc, Radnor, PA). Maximum concentration (Cmax) and time of maximum concentration (Tmax) were observed values. The areas under the plasma concentration versus time curve (AUC0–t and AUC0–inf) were calculated using a combination of linear and log trapezoidal summations. Bioavailability (F) was calculated from AUC0-t after PO administration compared to that for IV dosing and is expressed as F%.
Results and discussion
As indicated below, the studies described here were aimed at obtaining a better understanding of the metabolic stability and fate of Inh 1 () in in vitro systems utilising human, mouse and rat hepatic microsomes and hepatocytes. In addition, the in vivo study was used to gain information on oral bioavailability, pharmacokinetics and systemic exposure in the mouse.
Plasma and microsomal protein binding of Inh 1
Studies in human, mouse, and rat plasma showed that the plasma protein binding of Inh 1 was greater than 90% in all three species, with Inh 1 having measured fu values of 0.0878, 0.0188, and 0.0367, respectively. The data for the plasma protein binding of both Inh 1 and the positive control warfarin can be found in Tables S3 and S4, respectively. The values obtained for warfarin were consistent with in-house historical data.
Binding of Inh 1 to microsomal protein was also assessed in human, rat and mouse liver microsomes. In all three species, the measured fu was determined to be >0.800 meaning that the extent of binding (<20%) was much less than that observed in plasma (data shown in Table S5). The values for amitriptyline, used as a positive control, were in line with in-house historical data (data shown in Table S6).
Caco-2 permeability data of Inh 1
A bi-directional assay with polarised Caco-2 cells was used to assess the intestinal permeability of Inh 1. The measured bidirectional Papp of Inh 1 in the absence of any inhibitor was 11.2 cm/s (×10−6) in the A-B direction and 21.4 cm/s (×10−6) in the B-A direction, with an efflux ratio of 1.91 (as shown in Table S7). In the presence of inhibitors (elacridar and MK-571) Inh 1 was determined to have a Papp of 7.83 cm/s (×10−6) in the A-B direction and a Papp of 9.96 cm/s (×10−6) in the B-A direction, with an efflux ratio of 1.27. The A-B Papp values in both the absence and presence of any inhibitor were therefore comparable but the B-A Papp value in the presence of inhibitor were >2-fold less than that observed in the absence of inhibitor, indicating that Inh 1 may be subject to active efflux by P-gp, BCRP or MRP2. The positive controls, atenolol, antipyrine, talinolol, and oestrone 3-sulphate, all performed in accordance with in-house historical data (see Table S8). Talinolol and oestrone 3-sulphate were both shown to have reduced efflux ratios in the presence of the inhibitors compared to the results obtained in the absence of the inhibitors.
In vitro liver microsomal stability of Inh 1
To determine microsomal stability, Inh 1 was incubated with human, mouse, and rat liver microsomes (HLM, MuLM, and RLM, respectively) and the co-factor NAPDH. Control incubations were also performed in the absence of NADPH to confirm any non-cytochrome P450 (CYP) enzyme metabolism. Samples were obtained over 45 min and the remaining Inh 1 was quantified by LC-MS/MS. No metabolism of Inh 1, or the positive controls dextromethorphan, verapamil, diazepam, and diphenhydramine, was observed in the human or mouse minus-NADPH incubations (Tables S15 and 16, Figures S1 and 2) whilst small (<2%) amounts of M3 (O-deethylation) and M14 (oxidation) were detected in the T0 rat microsome incubation (Table S17, Figure S3). On incubation with HLM plus NADPH, Inh 1 was found to have an intrinsic clearance of 30.9 µL/min/mg. When incubated with MuLM and RLM in the presence of NADPH the intrinsic clearance of Inh 1 was 67.8 and 201 µL/min/mg, respectively. The control compounds dextromethorphan, verapamil (HLM), diazepam, and diphenhydramine (MuLM, RLM) had intrinsic clearances consistent with the historical results obtained using these assays (see Table S9). Results for the intrinsic clearance of Inh 1 with these microsomal systems can be found in Table S10 together with graphical summaries showing the decline in Inh 1 concentrations over time illustrated in Figures S1–S3.
In vitro hepatocyte stability of Inh 1
The metabolic stability of Inh 1 in cryopreserved human, mouse or rat hepatocytes was evaluated over the course of 2 h with incubations sampled at various time points after addition of either Inh 1 or the positive controls, verapamil and umbelliferone (human and rat hepatocytes) or verapamil and raloxifene (mouse hepatocytes). Following centrifugation the supernatants from the incubation samples were analysed by LC-MS/MS to determine the intrinsic clearances of Inh 1 and the positive controls. In human hepatocytes Inh 1 was found to have an intrinsic clearance of 21.6 µL/min/106 cells. In comparison, the intrinsic clearances observed for Inh 1 were 96.0 and 129 µL/min/106 cells for mouse and rat hepatocytes, respectively. The data for the positive controls for all species were consistent with in-house historical results (see Table S11). A summary of the data for Inh 1 is given in Table S12 and also illustrated in Figures S4–S6.
Heat inactivation of microsomes for assessment of FMO contribution to Inh 1 metabolism
To determine the potential role of FMO in Inh 1 metabolism both it and the positive control benzydamine were incubated with both heat-inactivated microsomes and control (non-heat inactivated) microsomes with NADPH present. In addition, the P450 positive controls diphenhydramine, diazepam, dextromethorphan, and verapamil were also incubated under the same conditions. For the P450 control compounds heat-inactivation generally had minimal impact on their intrinsic clearance compared to incubations performed using control microsomes (Table S13) and gave results which were again consistent with historical in-house data. The one exception to this was for diphenhydramine in MuLM which gave a the CLint that was approximately half of that obtained for heat-inactivated MuLM compared with the result for microsomes that had not been heat treated. However, whilst widely used as a control for P450-based metabolism diphenhydramine has also been identified as a substrate for porcine FMO (Zeigler Citation1988) and the result obtained here suggests that the same may also be true for mouse.
The positive control for FMO activity, benzydamine, was shown to have an intrinsic clearance of 17.8, 484, and 1420 µL/min/mg in control HLM, MuLM and RLM, respectively, and an intrinsic clearance of 9.06, 159, and 626 µL/min/mg in heat-inactivated HLM, MuLM, and RLM respectively. The fraction metabolised (fm) by FMO for benzydamine was therefore calculated to be 0.49, 0.67, and 0.56 in HLM, MuLM, and RLM, respectively, in accordance with literature demonstrating FMO contributed to 53% (fm of 0.53) of the intrinsic clearance of benzydamine in HLM (Jones et al. Citation2017).
In control microsomes, Inh 1 was found to have an intrinsic clearance of 24.9 µL/min/mg in HLM, 67.2 in MuLM µL/min/mg and 134 µL/min/mg in RLM (all within 1.5-fold of the original measurements described above). In the heat-inactivated microsomes, Inh 1 had intrinsic clearances of 19.9, 63.9, and 115 µL/min/mg for human, mouse and rat, respectively indicating a limited contribution of heat labile FMO’s to the overall intrinsic clearance of Inh 1 (Table S14) which was, presumably, mainly P450-based. The stability profiles of Inh 1 in control microsomes and heat-inactivated microsomes are shown in Figures S7–S12.
Prediction of CLH of Inh 1 from microsomal and hepatocyte incubations
The in vivo CLH of Inh 1 was predicted from in vitro CLint values measured in HLM, MuLM, and RLM and hepatocyte incubations. The predicted in vivo CLH of Inh 1 using measured in vitro CLint values from microsomal incubations was determined to be 2.99, 5.96, and 18.0 mL/min/kg for human, mouse, and rat, respectively. Based on the measured in vitro CLint values from hepatocyte incubations, the predicted in vivo CLH of Inh 1 was determined to be 5.60, 21.3, and 27.9 mL/min/kg for human, mouse, and rat, respectively. The predicted in vivo CLH of Inh 1 obtained in hepatocytes was within 2-fold of that determined in microsomes for human and rat. However, in mouse hepatocytes, the predicted in vivo CLH of Inh 1 was approximately 3.5-fold higher than the predicted in vivo CLH of Inh 1 observed in mouse microsomes.
In vitro microsomal metabolites of Inh 1
Metabolite formation from Inh 1 was evaluated using high-resolution LC-MS/MS on samples derived from the 5 min RLM and MuLM and 15 min HLM incubations described above. After a 5 min incubation with MuLM and RLM ca. 74% and 65%, respectively, of the total drug-related material detected was Inh 1 (assuming that the metabolites all had a similar molar MS response to Inh 1). In RLM, at this time point the major metabolites were M3 (ca. 12%), corresponding to deethylation of the phenolic ethyl group, and M14 (ca. 14%) which was due to hydroxylation of a methyl group on the dimethyl-phenyl-substituent. With mouse microsomes the major metabolite was M14 (ca. 9%). In the case of the human microsomes nearly 80% of the total was still composed of unchanged Inh 1 after 15 min of incubation. A total of eight metabolites were observed in the microsomal incubations for all three species. Overall, the metabolites that were produced were generally concordant between the three species, with five metabolites common to both (M3, 4, 10, 14, and 17). One human microsomal metabolite (M9) and one mouse metabolite (M15) were unique to these species when reporting those above 1% of drug-related material. Metabolite M5 was absent in the HLM but present in both MuLM and RLM. Assuming similar mass spectral properties to Inh 1, these metabolites (M3-5, 9, 10, and 17) individually provided ca. 5% or less of the total. Interestingly, in addition to O-deethylation and oxidative metabolism, desulphurisation (M4,5,9 and 10) was also noted together with apparent reductive metabolism (desaturation) in both human, mouse and rat derived preparations. Approximate % abundance, assuming similar MS properties, of the metabolites is reported in Tables S15–S17. Putative Markush structures are displayed in Table S29. Representative mass chromatograms showing Inh 1 and its associated metabolite peaks for the human, mouse and rat microsomal incubations are shown in Figures S13–S15.
In vitro hepatocyte-derived metabolites of Inh 1
With the hepatocyte incubations, the metabolite profiles for Inh 1 after 10 and 20 min were obtained for mouse and rat-derived samples, and for the 60 and 120 min time points for human. In total, these hepatocytes incubations resulted in the production of eighteen metabolites. Nine (M3, 9, 14, 15, 17–20, and 25) were found in human hepatocyte-derived samples whilst eleven (M3-5, 10, 14, 17, 20, 21, 23, 25, and 26) were seen for mouse and a further eleven (M1, 4, 5, 8, 14, 15, 17, 20, 24, and 27) were observed in the rat hepatocyte-derived samples, respectively. The larger number of metabolites observed in hepatocytes made for a somewhat more complex metabolite profile than that seen for microsomes, due in part to the formation of glucuronides. So, in addition to many of the metabolites noted from the microsomal incubations, hepatocytes also resulted in the detection of a unique human metabolite (M19) showing both oxidation and desaturation, M20 (found in all species but only in hepatocytes), three glucuronides M24, unique to rat hepatocytes, and M25 found in human and mouse hepatocytes and M26, unique to mouse hepatocytes as well as a rat-derived glutathione conjugate (M27) (see Table S29). The relative amounts of these metabolites, again assuming similar mass spectral properties to Inh 1, are provided in Tables S18–20.
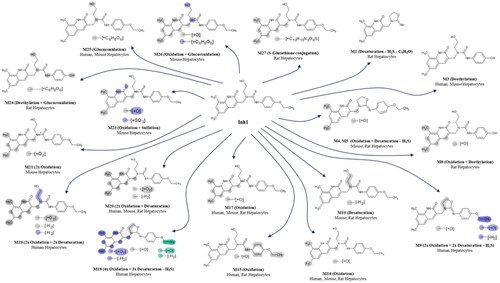
Based on mass spectral fragmentation and molecular composition data the likely/approximate sites of metabolism are shown on the Markush structures in Table S29. Representative mass chromatograms are shown in for human, mouse, and rat hepatocyte incubations respectively, and the corresponding mass spectra and fragmentation data are provided in Figures S16–18. The structures of Inh 1 and its hepatocyte-derived metabolites are illustrated in .
Figure 2. Upper: Summed XIC of all the metabolites of Inh 1 found in 120 min human hepatocyte samples, Middle: Summed XIC of all the metabolites found in 20 min mouse hepatocyte samples Lower: Summed XIC of all the metabolites found in 20 min rat hepatocyte samples Unfilled peaks are considered to arise from endogenous material.
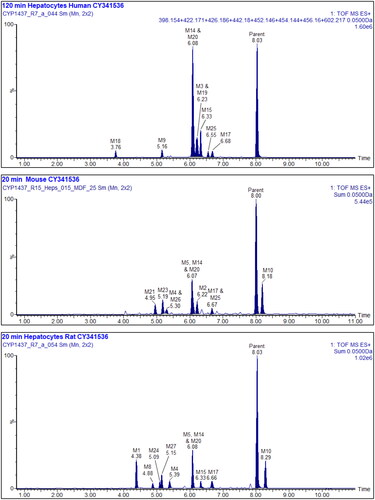
Figure 3. Proposed structures for hepatocyte-derived metabolites of Inh 1
Overall, the metabolic picture revealed by these in vitro investigations is both interesting and complex, demonstrating extensive metabolism at a variety of sites on Inh 1. The majority of these biotransformations involved fairly predictable oxidations on the aromatic ring (e.g. M4, 5, 13, 14, and 23), and O-deethylation (e.g. M3, 8, and 24) with, in some cases subsequent conjugation to form a sulphate (M23) or various glucuronides (M24, 25, 26). Evidence was also seen for the involvement of a reactive metabolite based on the formation of a glutathione conjugate, M27, by rat hepatocytes (Table S29). A limited number of the putative metabolites (M9, 18,19) were observed only in human hepatocyte incubations (down to 1% of drug-related material) (Table S29).
However, perhaps most interesting from a metabolic point of view, was the observation of desulphurisation seen to occur in 9 metabolites (M1, 4–7, 9, 11, 12, and 18 (the latter seen only in rat hepatocytes)) detected in species-specific metabolite profiles obtained for microsomes and hepatocytes. This desulphurisation occurred with a variety of concomitant oxidations, desaturations, and, in one case (M1), also included the loss of the 4-ethoxyphenyl-ring. This type of desulphurisation was first described for [6-(2,4-dimethoxyphenyl)-1-(2-hydroxyethyl)-2-thioxo-2,3-dihydropyrimidin-4(1H)-one], both in vitro and in vivo, and was identified as a major biotransformation (Eng et al. Citation2016). Investigations on the desulphurisation mechanism, using human recombinant FMO in supersomes, led Eng et al. (Citation2016) to propose that it resulted from metabolism by flavin-containing monooxygenases (FMOs), followed by intramolecular cyclisation.
More recently, a similar metabolic desulphurisation was seen for the myeloperoxidase inhibitor AZD4831 (Jurva et al. Citation2023) but no FMO-based investigations were undertaken. We therefore proceeded to investigate the potential involvement of FMOs in Inh 1 metabolism, as described below.
Microsomal metabolites of Inh 1 in heat-inactivated microsomes
Given the obvious structural similarities between compounds such as [6-(2,4-dimethoxyphenyl)-1-(2-hydroxyethyl)-2-thioxo-2,3-dihydropyrimidin-4(1H)-one] and Inh 1, we also investigated the potential involvement of FMOs via a similar reaction (see ) to that proposed by Eng et al. (Citation2016). Inh 1 was incubated with liver microsomes, with and without heat inactivation (see Jones et al. Citation2017), for 5 min incubation with RLM (as performed in the initial microsomal study), 15 min for MuLM and 45 min for HLM (for results see Tables S21–26).
For the RLM incubation, only 2 desulphurised metabolites (M4 and M5) were detected without heat inactivation with one (M4) still present after heat inactivation (see Tables S25, S26, and S29), providing some support for the involvement of FMOs in their production. For the MuLM, a total of 3 metabolites (M4, M6, and M7) were detected after 15 min incubation without heat inactivation. However, of the 3 metabolites, only M6 was not present in MuLM treated by heat inactivation. The HLM provided the richest source of desulphurised Inh 1 metabolites with 6 in total (M4-6, M9, M11, and M12). Of these only M12 was absent after incubation with heat-inactivated HLM (as mentioned above, one further desulphurised metabolite of Inh 1 (M18) was only detected in human hepatocyte incubations).
Across species, the relative abundance of all of the metabolites of Inh 1 produced using heat treated microsomes, including those that were not desulphurised, with the exception of M9 in human (reduced from 47% to 29% of the total TIC), was similar, or only slightly reduced following heat inactivation. Any metabolites that were not detected were low level metabolites when observed in the samples without heat inactivation (see Tables S25, S26, and S29). A pivotal role for FMOs in the desulphurisation of Inh 1 is therefore difficult to support based on these in vitro data and, should these prove to be major metabolites in vivo, further studies to determine the potential of CYP-mediated mechanisms, using e.g. human recombinant FMO’s as employed by Eng et al. (Citation2016) may be warranted.
The relative amounts of these metabolites, assuming similar mass spectral properties to Inh 1, are provided in Tables S21–S26.
In vivo pharmacokinetics of Inh 1 in the Swiss mouse
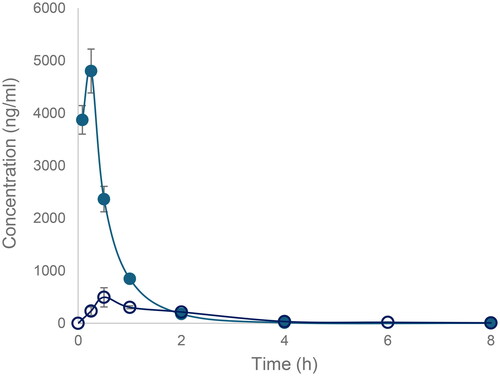
Inh 1 was well tolerated following either IV or PO dosing at 3 mg/kg, with no clinical signs observed over the 24 h duration of the study. Following IV administration the plasma concentrations of Inh 1 at 0.08 h were marginally lower than at the subsequent sampling time of 0.25 h which probably resulted from the use of a ‘discovery’ formulation. For the purposes of estimating the IV C0 and AUC values for Inh 1 pharmacokinetic calculations based on the perpendicular back extrapolation of the concentration observed at 0.08 h were used. Following IV administration. Inh 1 exhibited a monophasic decline (t1/2 0.91 h, ) and by 24 h the drug was no longer detectable in the plasma of 2 out of the 3 animals (Table S27). Based on the PK data obtained here Inh 1 had low systemic plasma clearance (11.8% of mouse liver blood flow) and a terminal elimination half-life of 0.91 h. From the in vitro microsomal mouse incubations the CLH of Inh 1 in mouse was predicted to be 5.96 mL/min/kg whilst for hepatocytes the equivalent figure was 21.3 mL/min/kg, which were equivalent of 4.97% and 17.8% of normal liver blood flow in mice, respectively. The scaled in vitro CLint of Inh 1 in mouse hepatocytes predicted the observed plasma clearance better than the in vitro microsomal CLint, most likely a reflection of the absence of conjugative metabolism in the microsomal system, although such a marked disparity between microsomes and hepatocytes was less evident in rat and human. The low volume of distribution calculated based on these data of 0.7 L/kg was less than total body water suggesting low extravascular distribution.
Table 1. Pharmacokinetic parameters for Inh 1 following IV and PO Administration to Swiss Mice at 3 mg/kg.
Following PO dosing there was rapid absorption with peak observed plasma concentrations of Inh 1 seen at 0.5 h of ca 500 ng/mL post dose. Drug concentrations declined exponentially thereafter, falling to less than 10 ng/ml by 8 h, and weres below the LOD by 24 h post dose (see for pharmacokinetic data and Tables S27 and S28 for the individual animal plasma concentrations for IV and PO doses, respectively). The mean plasma profiles obtained following for both IV and PO dosing are provided in . The oral bioavailability of Inh 1 administered at 3 mg/kg was approximately 25.7%.
Figure 4. The oxidative desulfurization of 6-(2,4-dimethoxyphenyl)-1-(2-hydroxyethyl)-2-thioxo-2,3-dihydropyrimidin-4(1H)-one by FMO by rat and dog microsomes. Adapted from Eng et al. (Citation2016).
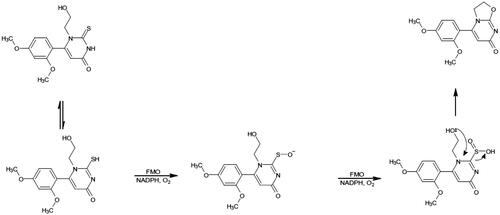
Figure 5. Proposed biotransformations leading to metabolites showing desaturation -H2S.
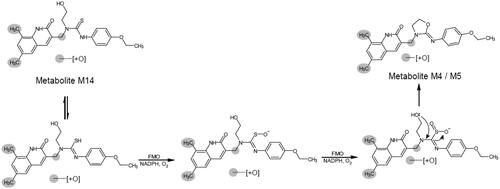
Figure 6. Mean plasma concentration-time profiles to 8 h for Inh 1 following single intravenous and oral administration to Swiss albino mice both at 3 mg/kg. Key: - 
Conclusions
The gut commensal bacterial GUS inhibitor Inh 1 was found to be relatively stable when incubated with hepatic microsomes and hepatocytes but was nevertheless subject to a wide range of biotransformations at multiple sites. Whilst the bulk of these biotransformations were relatively ‘conventional’ oxidations/hydroxylations/deethylations and conjugations, the large number of minor desulphurised metabolites appears to be relatively novel. Given the structural similarity between Inh 1 and 6-(2,4-dimethoxyphenyl)-1-(2-hydroxyethyl)-2-thioxo-2,3-dihydropyrimidin-4(1H)-one, this Inh 1 biotransformation may represent a further example of oxidative desulphurisation by FMO although, as our limited data show, the enzymes responsible for this reaction may be species-dependent and P450-based reactions may have a major role in this reaction.
Supplemental Material
Download PDF (2.1 MB)Disclosure statement
MRR is a Founder and Board member of Symberix, Inc., and has received research funding from Merck and Lilly. The other authors report no declarations of interest.
Data availability statement
The authors confirm that the data supporting the findings of this study are available within the article and its supplementary materials.
Additional information
Funding
References
- Allison MC, Howatson AG, Torrance CJ, Lee FD, Russell RI. 1992. Gastrointestinal damage associated with the use of nonsteroidal anti-inflammatory drugs. New Engl J Med. 327 (11):749–754.
- Bhatt AP, Gunasekara DB, Speer J, Reed MI, Peña AN, Midkiff BR, Magness ST, Bultman SJ, Allbritton NL, Redinbo MR. 2018. Nonsteroidal anti-inflammatory drug-induced leaky Gut modeled using polarized monolayers of primary human intestinal epithelial cells. ACS Infect Dis. 12 (2018):46–52.
- Bhatt AP, Pellock SJ, Biernat KA, Walton WG, Wallace BD, Creekmore BC, Letertre MM, Swann JR, Wilson ID, Roques JR, Darr BD, Baily ST, Montgomery SA, Roach JM, Azcarate-Peril MA, Sartor RB, Gharaiibeh RZ, Bultman SJ, Redinbo R. 2020. Targeted inhibition of gut bacterial β-glucuronidase activity enhances anticancer drug efficacy. Proc Natl Acad Sci USA. 117(13):7374–7381.
- Bjarnason I, Hayllar J, MacPherson AJ, Russell AS. 1993. Side effects of nonsteroidal anti-inflammatory drugs on the small and large intestine in humans. Gastroenterology. 104(6):1832–1847. doi: 10.1016/0016-5085(93)90667-2.
- Boelsterli UA, Ramirez-Alcantara V. 2011. NSAID acyl glucuronides and enteropathy. Curr Drug Metab. 12(3):245–252.
- Davies B, Morris T. 1993. Physiological parameters in laboratory animals and humans. Pharm Res. 10(7):1093–1095. doi: 10.1023/a:1018943613122.
- Eng H, Sharma R, Wolford A, Li D, Ruggeri RB, Buckbinder L, Conn EL, Dalvie DK, Kalgutkar AS. 2016. Species differences in the oxidative desulfurization of a thiouracil-based irreversible myeloperoxidase inactivator by flavin-containing monooxygenase enzymes. Drug Metab Dispos. 44:1262–1269.
- Hakooz N, Ito K, Rawden H, Gill H, Lemmers L, Boobis AR, Edwards RJ, Carlile DJ, Lake BG, Houston JB. 2006. Determination of a human hepatic microsomal scaling factor for predicting in vivo drug clearance. Pharm Res. 23(3):533–539. doi: 10.1007/s11095-006-9531-2.
- Houston JB, Carlile DJ. 1997. Prediction of hepatic clearance from microsomes, hepatocytes, and liver slices. Drug Metab Rev. 29(4):891–922.
- Jones BC, Srivastava A, Colclough N, Wilson J, Reddy VP, Amberntsson S, Li D. 2017. An investigation into the prediction of In Vivo clearance for a range of flavin-containing monooxygenase substrates. Drug Metab Dispos. 45(10):1060–1067. doi: 10.1124/dmd.117.077396.
- Jurva U, Weidolf L, Sandinge AS, Leandersson C, Ekdahl A, Li XQ, Antonsson T, Sundell J, Westerlund K, Amilon C, Inghardt T, Gopaul VS. 2023. Biotransformation of the novel myeloperoxidase inhibitor AZD4831 in preclinical species and humans. Drug Metab Dispos. 51(4):464–479. doi: 10.1124/dmd.122.001099.
- Kerins A, Koszyczarek M, Smith C, Butler P, Riley R, Madgula V, Naik N, Redinbo MR, Wilson ID. 2022. The in vitro metabolism and in vivo pharmacokinetics of the bacterial β-glucuronidase inhibitor UNC10201652. Xenobiotica. 52(8):904–915. doi: 10.1080/00498254.2022.2128468.
- Kilford PJ, Gertz M, Houston JB, Galetin A. 2008. Hepatocellular binding of drugs: correction for unbound fraction in hepatocyte incubations using microsomal binding or drug lipophilicity data. Drug Metab Dispos. 36(7):1194–1197. doi: 10.1124/dmd.108.020834.
- LoGuidice A, Wallace BD, Bendel L, Redinbo MR, Boelsterli UA. 2012. Pharmacologic targeting of bacterial β-glucuronidase alleviates nonsteroidal anti-inflammatory drug-induced enteropathy in mice. J Pharmacol Exp Ther. 341(2):447–454. doi: 10.1124/jpet.111.191122.
- Riley RJ, McGinnity DF, Austin RP. 2005. A unified model for predicting human hepatic, metabolic clearance from in vitro intrinsic clearance data in hepatocytes and microsomes. Drug Metab Dispos. 33(9):1304–1311. doi: 10.1124/dmd.105.004259.
- Ring BJ, Chien JY, Adkison KK, Jones HM, Rowland M, Jones RD, Yates JWT, Ku MS, Gibson CR, He H, Vuppugala R, Marathe P, Fischer V, Dutta S, Sinha VK, Bjornsson T, Lave T, Poulin P. 2011. PhRMA CPCDC initiative on predictive models of human pharmacokinetics, part 3: comparative assessment of prediction methods of human clearance. J. Pharm. Sci. 100(10):4090–4110.
- Roberts AB, Wallace BD, Venkatesh MK, Mani S, Redinbo MR. 2013. Molecular insights into microbial β-glucuronidase inhibition to abrogate CPT-11 toxicity. Mol Pharmacol. 84(2):208–217. doi: 10.1124/mol.113.085852.
- Saitta KS, Zhang C, Lee KK, Fujimoto K, Redinbo MR, Boelsterli UA. 2014. Bacterial β-glucuronidase inhibition protects mice against enteropathy induced by indomethacin, ketoprofen or diclofenac: mode of action and pharmacokinetics. Xenobiotica. 44(1):28–35. doi: 10.3109/00498254.2013.811314.
- Smith R, Jones RDO, Ballard PG, Griffiths HH. 2008. Determination of microsome and hepatocyte scaling factors for in vitro/in vivo extrapolation in the rat and dog. Xenobiotica. 38(11):1386–1398. doi: 10.1080/00498250802491662.
- Takasuna K, Hagiwara T, Hirohashi M, Kato M, Nomura M, Nagai E, Yokoi T, Kamataki T. 1996. Involvement of beta-glucuronidase in intestinal microflora in the intestinal toxicity of the antitumor camptothecin derivative irinotecan hydrochloride (CPT-11) in rats. Cancer Res. 56:3752–3757.
- Wallace BD, Roberts AB, Pollet RM, Ingle JD, Biernat KA, Pellock SJ, Ventatesh MK, Guthrie L, O’Neal SK, Robinson SJ, Dollinger M, Figueroa E, McShane SR, Cohen RD, Jin J, Frye SV, Zamboni WC, Pepe-Ranney, Kelly L, Redinbo MR. 2015. Structure and inhibition of microbiome β-glucuronidases essential to the alleviation of cancer drug toxicity. Chem Biol. 22:1238–1249.
- Wallace JL, Syer S, Denou E, de Palma G, Vong L, McKnight W, Jury J, Bolla M, Bercik P, Collins SM, Verdu E, Ongini E. 2011. Proton pump inhibitors exacerbate NSAID-induced small intestinal injury by inducing dysbiosis. Gastroenterology. 141(4):1314–1322. doi: 10.1053/j.gastro.2011.06.075.
- Wallace BD, Wang H, Lane KT, Scott JE, Orans J, Koo JS, Venkatesh M, Jobin C, Yeh LA, Mani S, Redinbo MR. 2010. Alleviating cancer drug toxicity by inhibiting a bacterial enzyme. Science. 330(6005):831–835. doi: 10.1126/science.1191175.
- Yauw STK, Arron M, Lomme RMLM, van den Broek P, Greupink R, Bhatt AR, Redinbo MR, van Goor H. 2018. Microbial glucuronidase inhibition reduces severity of diclofenac-induced anastomotic leak in rats. Surg Infect (Larchmt). 19:417–423.
- Zeigler DM. 1988. Flavin-containing monooxygenases: catalytic mechanism and substrate specificities. Drug Met Rev. 19:1–32.