
ABSTRACT
Middle Stone Age (MSA) lithic artefacts coming from dated layers preserved in their original stratigraphic position are still rare in Northeast Africa in general and in Sudan in particular. This paper aims to present the results of technological and functional analyses of an assemblage coming from a stratigraphic context, i.e. the upper level of the EDAR (Eastern Desert – Atbara River) 135 site, discovered in an abandoned gold mining pit in the Sudanese Eastern Desert, approximately 70 km east of the town of Atbara. The assemblage, which is based on locally available quartz and rhyolite, comes from a layer bracketed by OSL dates of 116 ± 13 and 125 ± 11 kya. Such dating places it within Marine Isotope Stage 5e–5d. Analysis of the assemblage revealed several characteristics that seem to set it apart from other MSA Northeast African inventories. Among these, the dominance of simple, non-predetermined core reduction strategies and expedient tool types, coupled with the lack of traces of Nubian Levallois technique, are the most conspicuous. Micro-traces of use on animal and plant matter were preserved on some of the tools. EDAR 135 is part of a newly discovered complex of sites that confirms the presence of Middle and Late Pleistocene hominins along one of the possible routes out of Africa towards Eurasia.
RÉSUMÉ
La découverte d’outils lithiques ‘Middle-Stone Age’ (MSA) provenant de niveaux archéologiques datés et dans leur contexte sédimentologique d’origine est encore rare en Afrique du Nord-Est, et plus particulièrement au Soudan. Cet article présente les résultats d’analyses fonctionnelles et technologiques d’un assemblage lithique en stratigraphie, c’est-à-dire provenant du niveau supérieur du site EDAR 135 (Eastern Desert — Atbara River), découvert dans un puits de mine d’or abandonné dans le désert oriental soudanais à environ 70 km à l’est de la ville d’Atbara. L’assemblage, confectionné à partir de sources locales de quartz et de rhyolite, provient d’un niveau encadré par des datations OSL entre 116 ± 13 et 125 ± 11 ka. Ces dates placent cette occupation dans les stades isotopiques de l’oxygène 5e-d (MIS 5e-5d). Les analyses révèlent plusieurs caractéristiques qui semblent différencier cet assemblage d’autres inventaires lithiques du MSA provenant d’Afrique du Nord-Est. Notamment, l’assemblage est dominé par les outils opportunistes et par l’utilisation de stratégies simples, non-prédéterminées, de réduction des nucléus; on observe aussi l’absence de traces de la technique du Levallois nubien. Certains outils présentent des micro-traces d’utilisation relatives au travail de matières animales et végétales. Le site EDAR135 fait partie d’un groupe de sites récemment découverts qui confirment la présence d’hominiens du Pléistocène moyen et tardif le long d’une des voies possibles menant hors d’Afrique vers l’Eurasie.
Introduction: site location and stratigraphy
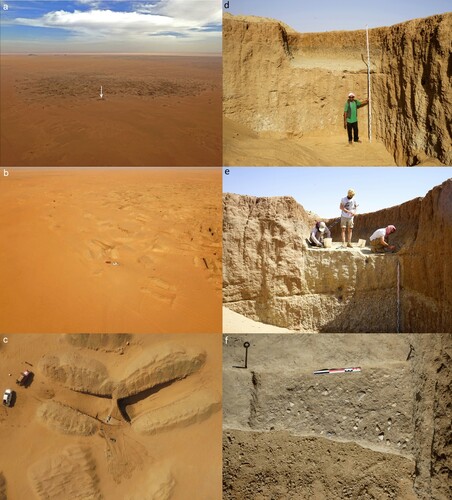
The EDAR (Eastern Desert – Atbara River project) sites were discovered in the Eastern Desert in northeastern Sudan, within the Wadi-el-Arab, a large valley system spanning from the Red Sea Mountains in the east to the lower Atbara River in the west (, Nassr and Masojć Citation2018; Masojć et al. Citation2021a). Most of the sites are located approximately 70 km east-northeast of the city of Atbara in a relatively flat and featureless stretch of the desert pockmarked with gold-mining shafts (a). Site number 135 (EDAR 135) was located in one of the abandoned trenches on the western edge of a particularly large mine (b–c). As with many other EDAR sites, lithic artefacts were found in their original stratigraphic context (d), literally protruding out of the profile (Masojć et al. Citation2019: 142).
Figure 1. Location of EDAR (triangle) and other MSA sites mentioned in the text (dots). 1 Affad; 2 Bir Sahara; 3 BP 177; 4 Kharga Oasis; 5 Khor Abu Anga; 6 Khor Musa; 7 Maghendoli; 8 Sai Island; 9 Taramsa.
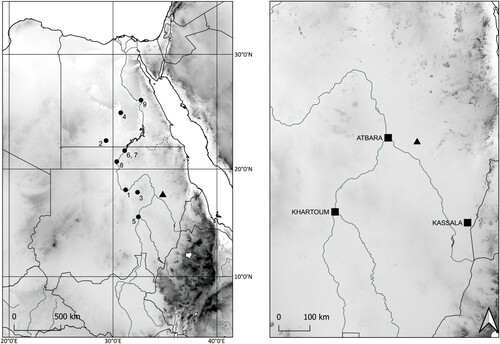
Figure 2. EDAR 135 and its vicinity: (a) the site’s location (arrow) within a large mining pit complex, seen from W; (b) the site and adjacent mining trenches; (c) two trenches seen from above with the profile in between. Note that the grid of excavated square metres extends from the left-hand side trench; (d) the profile before the upper level excavations, the layer of Unit IIA visible at approximately 2.5 m on the measuring rod; (e) the excavations, with traces from OSL sampling visible on the profile below; (f) the exposed MSA horizon at the top of Unit IIA. Photographs by M. Szmit (a–c) and M. Masojć.
The sedimentary deposits of the EDAR sites were exposed down to 5 m below the present-day surface and consist of alternating sand and gravel layers on a basement of weathered rhyolite (a–c). They can be divided into three main units (Masojć et al. Citation2019, Citation2021a) associated with successive Marine Isotope Stages (MIS) during the latter part of the Quaternary:
Unit I, composed of gravel with stratified pebbles (I A, MIS >11) and coarse sand with calcrete nodules (I B, MIS 11–8);
Unit II, again composed of gravel (II A, MIS 7) overlaid with carbonate-cemented sand (II B, MIS 6);
and Unit III, silts and soil, with rare pebbles and plant root remains, divided into three consecutive sub-units: III A (MIS 5), III B (MIS 2), and III C (MIS 1).
Figure 3. EDAR 135 profile and OSL samples: (a) geological and archaeological levels and units, location of OSL samples; (b) grain size; (c) CaCO3 content; (d) OSL De, shown as abanico plots with the central lines representing the palaeodose of the sample extracted with CAM indicating the Central Age Model (Galbraith et al. Citation1999) and OD Overdispersion. By J. Krupa-Kurzynowska, M. Ehlert and E. Andrieux.
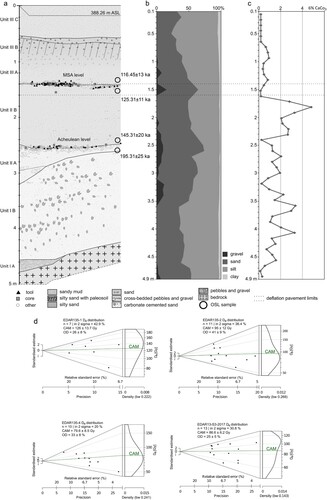
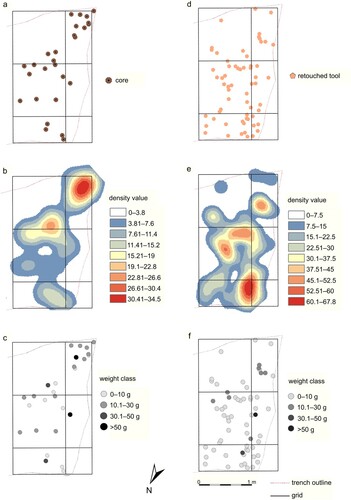
Figure 4. EDAR 135, upper level. Spatial distribution, density, and weight class distribution of artefact classes with (a, b, c) and without cores and tools (d, e, f); by E. Dreczko.
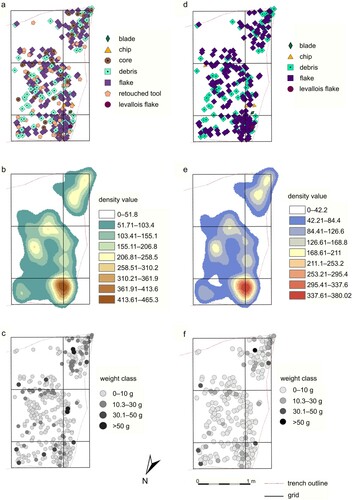
Figure 5. EDAR 135, upper level. Spatial distribution, density, and weight class distribution of cores (a, b, c) and retouched tools (d, e, f); by E. Dreczko.
MSA lithic artefacts were found at a depth of ∼1.4–1.6 m, within a thin erosive layer of sand and pebbles at the interface between the silts of Unit III A and the top of Unit II B. This disconformity — a band of coarse-grained sediment several centimetres deep and lying on sand and silt — is most probably a desert pavement created by deflation of the finest material from the top of Unit IIB. As such, it can be interpreted as the remnant of a short period of severe erosion between the sedimentation of Units II B and III A. Bracketed by two OSL dates of 116.45 ± 13 kya and 125.31 ± 10 kyaFootnote1 (; ), this layer possibly corresponds to conditions of intense wind activity at the onset of the transition between the cold and dry conditions of late MIS 6 and the warm and humid ones of early MIS 5.
Table 1. EDAR 135: OSL data summary and ages.
A small late Acheulean lithic assemblage (N = 737) was discovered at a depth of 2.4–2.65 m in a layer of gravel formed by a palaeostream and was OSL dated to between 220 ± 12 and 145 ± 20 kya (MIS 7a/6). It consists mostly of quartz flakes and chips and also contains traces of different reduction strategies (ad hoc multiplatform as well as discoidal and prepared centripetal cores), as well as three large cutting tools (two handaxes and a chopper). Microwear traces observed on some of the flake tools suggest butchering activities (Michalec et al. Citation2021).
Methods
Fieldwork
Fieldwork at EDAR 135 complied with all relevant regulations and was done after all necessary permits issued by the Director-General of the Sudanese National Corporation for Antiquities and Museums had been obtained. It was conducted over three seasons of the project. In 2017, the site was evaluated during a reconnaissance visit. Preliminary geomorphological and geological descriptions were made, a small collection of artefacts was gathered and the first batch of dating samples was taken.
The sedimentary profile of the site was thoroughly cleaned and described during the second season of excavation, which also saw the systematic sampling of units. Among others, six samples for OSL dating were taken; these provided the main framework for dating the entire sedimentary sequence.
The archaeological excavation of the site was conducted in February 2019. Firstly, the overlaying silts of Unit III A were removed with hoes to uncover the thin deflation pavement containing the MSA artefacts. Once this was achieved, a local co-ordinate system was set up using a total station and a grid of square metres was established over the exposed area. The artefact-bearing horizon was then carefully excavated using trowels, brushes and small hammers. All artefacts larger than 15 mm in diameter were given code numbers and mapped in three dimensions. The sediment from each square was sieved, which resulted in the retrieval of numerous small finds (e–f). After reaching sterile sediment again, the remainder of Unit IIB was removed by hoe until the upper surface of the Acheulean horizon at the interface with Unit IIA was exposed ().
Luminescence dating
Initial luminescence dating results for EDAR 135 were published by Masojć et al. (Citation2019). These samples (EDAR-135-1, -2 and -4) were processed in the Korean Institute of Geoscience and Mineral Resources (KIGAM). However, these initial samples yielded ages with relatively large uncertainties, due to the overdispersion of the equivalent dose measurements. To shed new light on the site's chronology a new sample was taken on the north wall part of the stratigraphy and dated at Gliwice Absolute Dating Methods Centre (GADAM), Poland. To ensure that the ages were comparable, data from KIGAM were reanalysed using the same parameters as those used to calculate the GADAM dates. Consequently, the ages for samples EDAR-135-1, -2 and -4 presented in this paper differ from those in Masojć et al. (Citation2019).
The new sample (EDAR_135_S3_2017) was prepared following standard procedures in GADAM, using HCl and H202 to remove carbonates and organic matter. Pure quartz was then extracted from the 90–212 µm fraction using density separations at 2.62 and 2.70 g/cm3, followed by a 40 min HF acid etch (and a subsequent HCl rinse).
Luminescence measurements were made on multi-grain aliquots of quartz using the single-aliquot regenerative-dose procedure (Murray and Wintle Citation2000). The natural and regenerated signals were measured after a preheating at 260°C for 10 seconds, while test dose signals were made after a 160°C, 10 second preheat. All measurements were carried out on a Risø TL-DA-15 reader, with a Hoya U-340 filter interposed between the sample and photomultiplier tube. The samples were irradiated using a 90Sr/90Y beta source.
For all samples, curve fitting and equivalent dose (De) determination were performed using version 4.57 of the Luminescence Analyst software (Duller Citation2007). The sample equivalent dose was calculated using the Central Age Model (CAM; Galbraith et al. Citation1999).
Radioisotope concentrations were measured using high resolution gamma spectrometry. Palaeo-moistures of 8 ± 3% were assumed for all samples. Beta and gamma dose rates were calculated from radioisotope concentrations and moisture contents using the conversion factors of Guérin et al. (Citation2011). Beta dose rates were corrected for grain size using the attenuation factors of Guérin et al. (Citation2012) and an etch attenuation factor after Bell (Citation1979). Cosmic ray dose rates were calculated based on the location of the site (latitude, longitude and altitude) and the present-day burial depth of each sample, assuming an overburden density of 1.8 g/cm3 (Prescott and Hutton Citation1988). Dose rates and ages for each sample were calculated using the online Dose Rate and Age Calculator (DRAC; Durcan et al. Citation2015) and are presented in and d.
Lithic analysis
The attributes of the lithic inventory were entered into a MS Access database, along with information concerning the context of discovery, raw material and taphonomy. Chosen artefacts, mostly tools and cores, were photographed and drawn.
The assemblage was divided in two groups. First, all cores, flakes and tools were examined individually. Their weight (all artefacts) and length, width and thickness (intact or slightly damaged specimens) were then measured. Platform width and thickness were recorded for flakes and tools, whenever applicable. All three categories were further classified according to several relevant, published lists (e.g. Schild and Wendorf Citation1977) to facilitate inter-assemblage comparisons.
The second group was composed of debris (i.e. chunks or angular shatter) and chips (flakes with a diameter below 15 mm). They were grouped by category, square metre and raw material and then weighed en masse.
Samples of raw material were collected from the immediate vicinity of the site and used in a series of preliminary knapping experiments. Although designed mainly to assess the suitability of various form of quartz and rhyolite cobbles and blocks for Acheulean stone tool production methods, they provided us with valuable insights into the properties of these two raw materials and their behaviour during hard-hammer percussion technique.
Use wear
Quartz artefacts, although ubiquitous in the archaeological record, do not often become the subjects of use wear-analyses. Nevertheless, numerous papers have been published on the matter (e.g. Derndarsky and Ocklind, Citation2001; Clemente Conte et al. Citation2015; Pedergnana and Ollé, Citation2017). Early comprehensive studies by K. Knutsson (Citation1988a, Citation1988b) and Sussman (Citation1985) set the framework for further research. To this day, Knutsson’s comparative tables are a great source of references (Derndarsky and Ocklind Citation2001: 1150–1152; Ollé et al. Citation2016: 155; Venditti et al. Citation2016: 1–2). Many subsequent experimental projects provided additional data on formation of use-wear (Lemorini et al. Citation2014; H. Knutsson et al. Citation2015; Liu and Chen Citation2016) and post-depositional traces (K. Knutsson and Lindé Citation1990; Venditti et al. Citation2016).
Quartz is a highly reflective, heterogeneous material. Both of these qualities pose a challenge during use wear analysis. Traces develop irregularly, more often on crystals than on the matrix (Clemente Conte and Gibaja Bao Citation2009: 94–95; Leipus Citation2014: 230–233; Clemente Conte et al. Citation2015: 64–65). Additionally, diagnostic traces such as striations, polish, or fractures may appear on different parts of the tool being analysed. Consequently, all edges and adjacent areas of the tool must be examined thoroughly to properly identify and interpret any potential traces.
Use-wear analysis was conducted in the laboratory of the Institute of Archaeology, University of Wrocław. A sample of 26 artefacts classified as typological tools with at least one intact, functional working edge was chosen and cleaned in an ultrasonic bath for 2–5 minutes. Macro-traces, such as edge rounding, tool surface condition and micro-chipping, were assessed in the first step. A NIKON Eclipse LV 100 with 200–500x magnification was then used for observing and documenting micro-traces (Taipale Citation2012: 94). Focus was enhanced by image stacking.
Results
Spatial distribution of artefacts
The artefacts were distributed uniformly over the excavated area, although in its mid-southern part a noticeable gap can be observed that divides them into two concentrations (). All artefact categories and weight classes were mixed (a–c).
The distribution of flakes, chips and debris reflects the overall artefact dispersal (d–f). Generally, although the density is highest in the site's northwest corner, the heavier artefacts seem to be more prevalent in the southern concentration (b–c, e–f) which is not only smaller, but also deposited a little deeper (a).
The location, density and weight class dispersion of cores seems to be, at least partially, a result of their greater weight (a–c). Like heavier débitage, their density is highest within the southern cluster. The opposite is true of retouched tools (d–f), the dispersal of which reflects the general image, with a slightly lower density in the northwestern corner of the excavation.
Although the excavated area was too small to allow the observation of larger spatial patterns, it seems that the registered distribution of artefacts results from natural processes of erosion and deflation rather than direct human action. The roughly uniform placement of artefact categories, perhaps with some sorting by weight (heavier specimens in the southern cluster), as well as the conspicuous gap (eroded out and filled with sterile sediment), seems to support this interpretation. This conforms to both models of how the layer with MSA artefacts formed that are presented in the following section.
Luminescence dating
The equivalent dose values for individual samples are rather scattered (d), but the distribution is not suggestive of incomplete bleaching of some mineral grains prior to deposition. Consequently, the Central Age Model (CAM) was used to calculate the equivalent dose for each sample. The CAM equivalent doses for samples EDAR-135-1, -2 and -4 are lower than those presented for the same samples in Masojć et al. (Citation2019), resulting in younger calculated ages.
The MSA archaeology was found in gravel bracketed between layers dated to 116 ± 13 and 125 ± 11 kya. This layer was most likely the result of deflation of fine-grained sediment from the upper parts of Unit II B. It is exceedingly difficult to say whether the lithic artefacts were already there during this episode of erosion, which probably occurred during the dry and windy conditions at the very end of MIS 6. Alternatively, they could have been washed out from sandy soils sometime between 125 and 116 kya, during a wet episode at the onset of MIS 5 that probably resulted in an increased sediment load in the Atbara, leading to the deposition of gravels. This period, globally recognised as the Last Interglacial, saw a wetting of the North African climate and the opening of the so-called green corridors across what is now the Sahara Desert (Drake et al. Citation2011) that may have promoted human dispersal through Northeast Africa (Pausata et al. Citation2020). Both kinds of processes seem to have left taphonomic traces on the artefacts found.
The lithic assemblage
Raw materials
The three raw material types used were, in descending order of importance, quartz, rhyolite and quartzitic sandstone. All three are available in the immediate vicinity of the site as pebbles (less than 6 cm), cobbles (between 6 and 25 cm) and blocks. Over 95% of the artefacts were made from quartz. In terms of weight, the picture is rather skewed by one particularly heavy quartzitic sandstone artefact. Nevertheless, when we compare the total weights of quartz and rhyolite, the ratio resembles the raw material count: 89 to 11 ().
Table 2. EDAR 135: number and weight of artefact classes by raw material (Q quartzite; QS quartzitic sandstone; R rhyolite).
The coexistence of these two raw materials, in different proportions, was noted on all the excavated EDAR sites, both Acheulian and MSA (Masojć et al. Citation2019, Citation2021a, Citation2021b; Michalec et al. Citation2021). Quartz, especially in the form of pebbles, seems to have been the most and popular raw material in the area (, ). Its quality is inferior to that of fine-grained rhyolite, but this might have been compensated for by its abundance. High availability and the convenient initial shape could have affected the technological choices and chaînes opératoires of knapping, which is perhaps reflected in some aspects of the analysed assemblage.
It is important to note that besides one tool, several flakes and pieces of debris, all of the identifiable rhyolite artefacts were made of the fine-grained variety of this material, one that has outstanding knapping properties, not unlike those of good quality chert or flint.
Assemblage structure
Flakes, blades, debris and chips comprised slightly over 90% of the total assemblage. Chips were by far the most ubiquitous and almost two-thirds of the artefacts recovered from the upper level of EDAR 135 were classified as such. Tools and cores formed the remainder of the assemblage, with the former being more common than the latter ().
The weight of artefact categories offers a slightly different perspective from which to look at the assemblage. Cores now become the most significant due to the outstandingly high weight of the quartzitic sandstone specimen. Flakes are the next important category, comprising slightly more than one quarter of the whole, but when lumped together with chips and debris the total rises to 51.8%. The percentage of tools by weight is almost twice as high as by number ().
There are some differences between the two main raw materials. Comparing the artefact count of the categories, one notices significant discrepancies in flake to chip ratio. In the case of rhyolite, there were more of the former (47.1 to 31.7% of all rhyolite artefacts). In the case of quartz, on the other hand, this ratio was opposite and much more pronounced: 17.6 to 64.6% of all quartz artefacts. The predominance of small quartz débitage can be partially explained by the tendency of this raw material to shatter while being knapped (Pargeter and Peña Citation2017). Such a degree of discrepancy between quartz and rhyolite is not seen in category weight, although the importance of quartz chips can still be seen: 16.4% of all quartz artefacts, compared to just 3.9% in case of rhyolite. Finally, quartz has more cores and tools by number and, in the case of cores, also by weight.
Another difference between quartz and rhyolite can be seen in the ratio between flakes and tools. In the case of quartz, there was one tool for approximately. every three flakes, while in that of rhyolite as many as 12.5. Such a degree of difference, unless it is accidental, may stem from raw material quality since flakes of fine-grained rhyolite have edges that are much more even and stable than those of quartz and can thus be more efficiently used without modification, leaving fewer artefacts with retouch and other obvious macroscopic use traces.
Artefact condition, size and weight
Surface condition and completeness were recorded for all cores, tools and flakes (N = 340, 29.4% of the assemblage). The summary of artefact size and weight is based on a sample of 231 complete specimens.
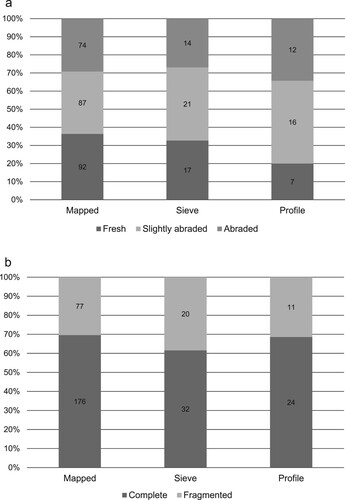
More than two thirds of the evaluated artefacts showed traces of either strong or moderate aeolian abrasion. Specimens recovered from the site profile were more affected with only 20% of them not being abraded (a). Approximately 70% of the artefacts were found complete, with slightly more fragmentation among those found in the sieve (b).
Figure 6. EDAR 135, upper level. Artefact properties: (a) surface condition; (b) completeness; (c) length/width scatter plot: 1 quartz flakes; 2 rhyolite flakes; 3 quartz tools; 4 rhyolite tools; 5 quartzitic sandstone tool; 6 quartz cores; 7 rhyolite cores; 8 quartzitic sandstone core. For surface condition and completeness N = 340. For the length/width scatter plot N = 231.
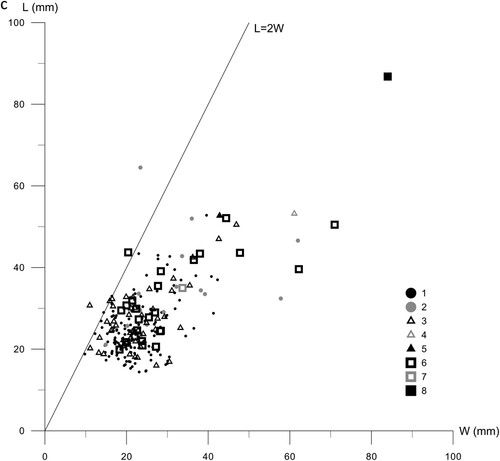
The artefacts were rather small in mean size, with only cores slightly exceeding 35 mm in mean length. Unsurprisingly, they are the largest (width and thickness) and heaviest category. Again, this is partially due to the presence of one comparatively large quartzitic sandstone core. Without this specimen, mean and median core dimensions would be ∼2 mm lower.
Rhyolite flakes tended to be somewhat heavier, longer, wider and slightly thicker than their quartz counterparts and tools; in fact, they have the highest mean and median length of all categories, including cores. Tools, 95.8% of which were made of quartz, are only very slightly larger, thicker, and heavier than quartz flakes ().
Table 3. EDAR 135: sizes and weight of chosen artefact classes. For length, width, and thickness N = 238, for platform width and thickness N = 165 and for weight N = 338.
Only three artefacts — a rhyolite flake, a quartz tool and a quartz core — could be described as being at least twice as long as they are wide. Most of the others fall somewhere between that and a length to width proportion of 1:1. They cluster quite densely around 20–30 mm in length and 15–35 mm in width, with relatively few outliers (c).
Cores
Besides the specimens classified as Levallois, cores from the upper level of EDAR 135 show no traces of preparation to any considerable degree (). Many were found fragmented and are therefore impossible to classify unambiguously.
Table 4. EDAR 135: core types, reduction stage and initial raw material form.
Multiplatform cores () were the most numerous identifiable group, but unidirectional cores () were quite ubiquitous as well. These were followed in frequency by discoidal () and Levallois forms, both preferential () and recurrent (). Apart from them, there were only two bipolar (c, d) one bidirectional (d, e) and one 90-degree cores.
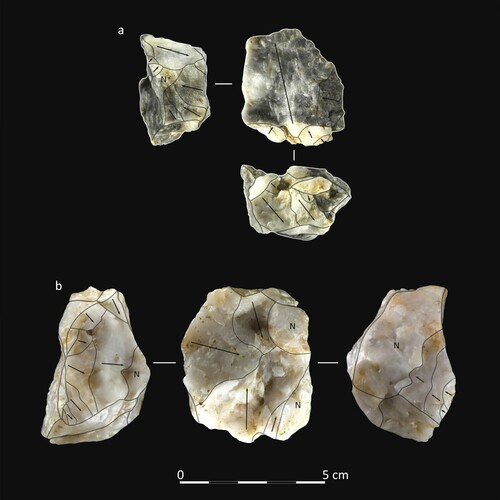
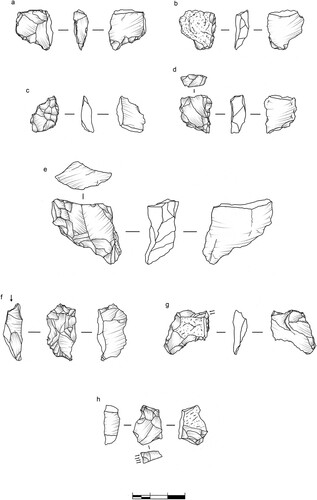
Figure 7. EDAR 135, upper level artefacts: (a) sidescraper (: b); (b) discoidal core (: d); (c) unidirectional core (: a); (d) bidirectional core (: e); (e) multiplatform core (: c); (f) discoidal core (: c); (g) unidirectional core (: e); (h) multiplatform core (: d). Photographs by M. Jórdeczka.
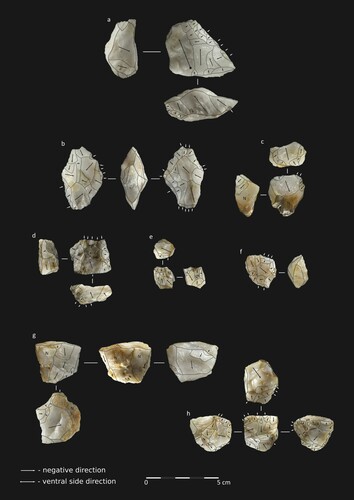
Figure 8. EDAR 135, upper level Levallois cores: a (: a) and b (: c). Photographs by M. Jórdeczka.
More than half of the cores were abandoned when their reduction was already in an advanced stage (); another quarter were reduced to a residual state ().
Figure 9. EDAR 135, upper level. Artefacts collected before the excavations from the site’s surface and profile: (a) discoidal core; (b–c) multiplatform cores. All in quartz. Drawings by M. Ehlert.
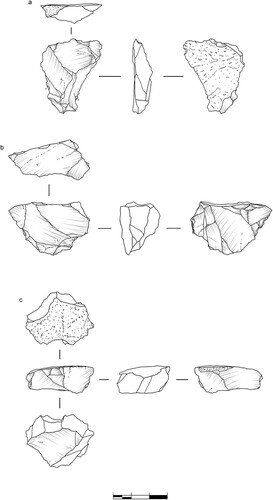
Figure 10. EDAR 135, upper level. Artefacts collected before the excavations from the site’s surface and profile: (a) blade; (b) retouched flake; (c) bipolar core; (d) sidescraper; Raw material: (a) fine-grained rhyolite, (b–d) quartz. Drawings by M. Ehlert.
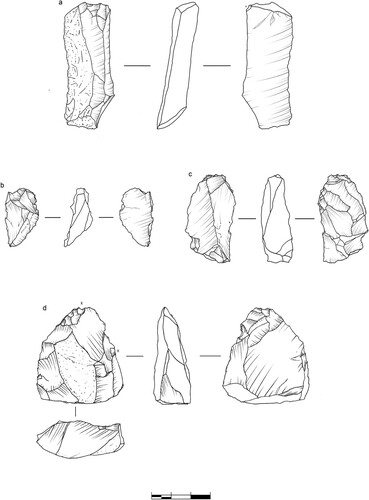
Figure 11. EDAR 135, upper level cores: (a–d) multiplatform; (e) unidirectional. All in quartz. Drawings by M. Ehlert.
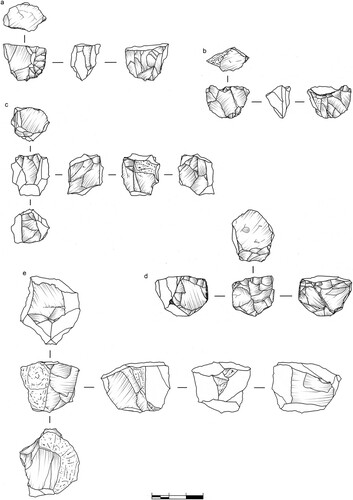
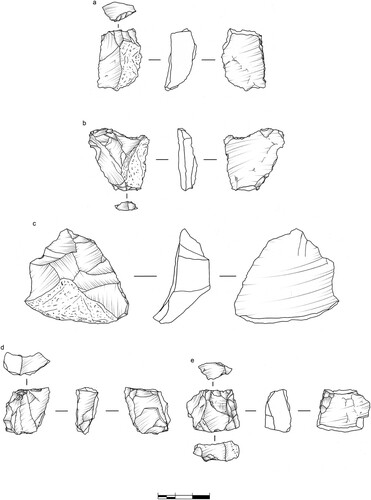
Figure 12. EDAR 135, upper level cores: (a) unidirectional; (b–d) discoidal; (e–f) Levallois. Raw material: (a–e) quartz, (f) coarse-grained rhyolite. Drawings by M. Ehlert.
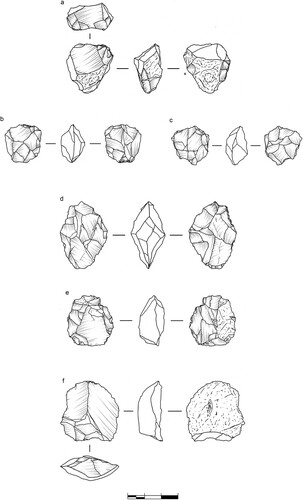
Figure 13. EDAR 135, upper level quartz artefacts: (a) Levallois core; (b) sidescraper; (c) Levallois core. Drawings by M. Ehlert.
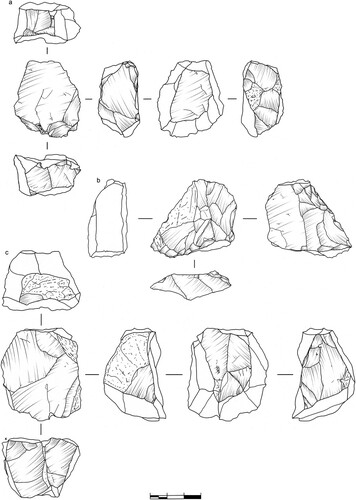
Figure 14. EDAR 135, upper level artefacts: a–c) retouched flakes; d) residual bipolar core; e) residual bidirectional core. Raw material: (a–b, d–e) quartz, (c) fine-grained rhyolite. Drawings by M. Ehlert.
Evaluation of raw material form was impossible for almost 40% of the cores, either because of fragmentation or because they represent a very advanced reduction stage (). With such specimens excluded, it becomes apparent that almost 80% of the remaining cores were based on pebbles. This is true for cores of all types, not only those that seem to be best suited to roundish, flattened raw materials, i.e. discoidal and Levallois. Other initial forms were represented by one or two examples.
Finally, the number of flakes or tools in proportion to cores were calculated. For the former, the ratio was 5.9 flake per core, but for tools only 1.82. Thus overall, each core corresponded to 7.72 flakes. This is not especially high for the MSA (e.g. Groucutt et al. Citation2017: Table 12) and might result from the expedient, non-prepared nature of most of the cores.
Flakes
Although two flakes had lengths exceeding their width by at least twofold (c, a) and were classified as blades, they were not treated a separate group. We decided against this in the face of the overwhelming dominance of blanks under the L = 2W line (c) and the lack of evidence for a discrete blade technology. It seems that producing elongated flakes was not a priority for the knappers responsible for the assemblage we analysed. Eleven flakes, including a débordant, were classified as core-trimming elements.
Most flakes had less than 50% of cortex on their dorsal sides (). Flakes fully covered with previous removal scars comprise approximately half of the subset, while ones with more than 50% of natural surface only 21%.
Table 5. EDAR 135: flake attributes by raw material.
There were slightly more flakes with multidirectional scars than those with unidirectional ones. This is especially true of quartz, as in the case of rhyolite the ratio was close to 1:1 (). Almost one third of the multidirectional flakes had parallel scars. Some bidirectional flakes, mainly made of quartz, were found as well. Again, these characteristics match the frequencies of the main core types.
The two most popular platform types were plain and cortical; 75% of flakes with preserved platforms had one or other of these, especially the former. Linear and punctiform platforms were also quite common, albeit only among quartz flakes. Again, this might be the result of a tendency for that raw material to shatter when struck. More elaborate platform types (dihedral, faceted) evidencing some degree of preparation prior to removal were rather uncommon.
Tools
A definite preference for non-cortical blanks can be seen. When specimens with undetermined amount of cortex are excluded for clarity, those fully covered with scars make up 65% and flakes with less than 50% cortex 90% of the subset. Multidirectional flakes were usually chosen over unidirectional ones. Plain platforms were the most common type; flakes with a cortical platform were chosen less often. Besides that, the presence of faceted platforms is more marked, but these still are isolated cases; two of them are Levallois blanks (a–b; ).
Figure 15. EDAR 135, upper level quartz tools: (a) Levallois point; (b) retouched Levallois flake; (c–e) perforators; (f–i) retouched flakes. Drawings by M. Ehlert.
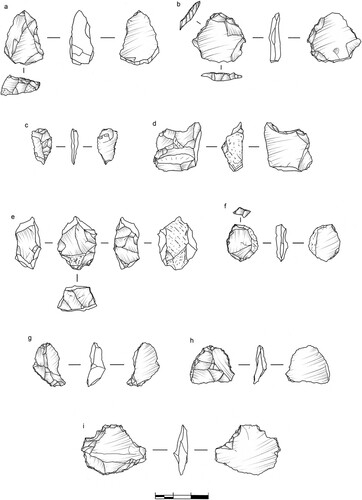
Table 6. EDAR 135: types and blank properties of tools.
Eight types of tools were distinguished. Expedient, multidirectional or unidirectional retouched flakes were the most frequent (). Endscrapers () were the second most numerous tool type. Notches were next (c–h), followed closely by perforators, of both flake (c–d) and core (e) kinds, as well as sidescrapers (). Some of these were made on comparatively large flakes. That cannot be said, however, about denticulates (a–b). Three forms were described as combined tools and can be described as forms somewhere on a continuum between retouched flakes, denticulates and notches, with additional burin blows (f–g). The tool list is closed by two Levallois forms: a point (a) and a retouched flake (b).
Figure 16. EDAR 135, upper level quartz endscrapers. Drawings by M. Ehlert.
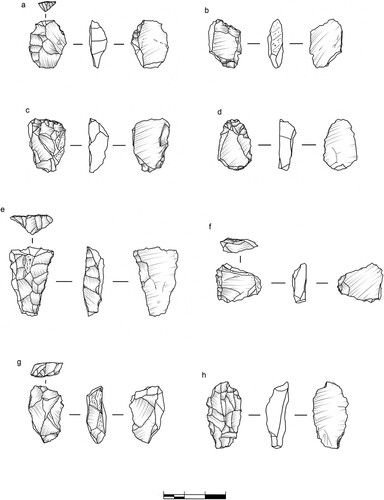
Figure 17. EDAR 135, upper level tools: (a–b) denticulates; (c–h) notches. Raw material: (a–g) quartz, (h) coarse-grained rhyolite. Drawings by M. Ehlert.
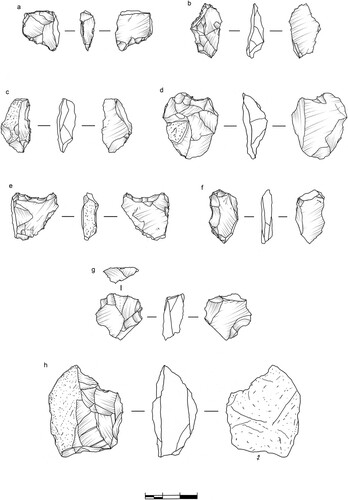
Figure 18. EDAR 135, upper level quartz tools: (a–e) sidescrapers; (f–h) combined tools. Drawings by M. Ehlert.
Use wear
Macro-traces suggesting possible use, including various degrees of edge rounding and patterns of chipping, were detected on 15 artefacts. Their detailed description, along with that of micro-traces is presented in .
Table 7. EDAR 135: description and interpretation of detected macro and micro traces; PDT – post-depositional traces. All artefacts made of quartz.
Based on polish location, type of chipping and linear features (Liu and Chen Citation2016: 508–509; Ollé et al. Citation2016: 157–158), direction of tool movement was identified on five artefacts, namely three endscrapers (), a sidescraper (c, b) and the retouched Levallois flake (b). In all cases small, overlapping chips and perpendicular striations of varied depth and regularity were visible on the edges used for scraping. Two of the tools were possibly used in more than one manner, for both cutting and scraping (). All the analysed artefacts revealed a preference for only one working edge. No traces of hafting were detected.
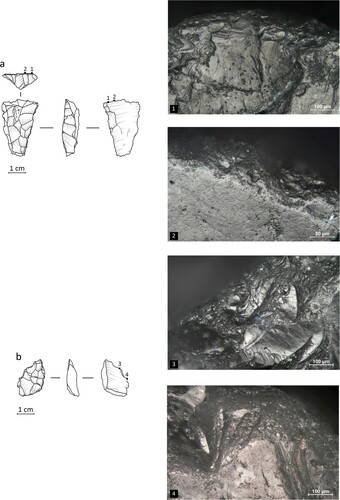
Figure 19. EDAR 135, upper level examples of use wear: (a) post-depositional concentrations of impact pits and ridge crushing that are: (1) superimposed on traces interpreted as results of work in bone and 2) showing a rounded edge with smooth and bright polish of uneven morphology overlapping onto crescent-shaped, few striations parallel to the edge; (b) traces interpreted as produced by hide scraping that exhibit: 3) a significant edge rounding and heavy abrasion, patches of rough, matt polish and 4) a similar polish, plus numerous thin striations perpendicular to the edge. Note that some of the fresher-looking scars here could be from post-depositional damage. Photographs by M. Cendrowska.
Identification of worked material was possible for only a few artefacts. In the case of two tools — the retouched Levallois flake (b) and a sidescraper (c, b) — rough and matt polish together with striations of varying depth and width were identified and interpreted as resulting from hide scraping. Another three artefacts — two perforators (c) and an endscraper (c) — had linear traces perpendicular to the edge, but no distinct polish. This suggests brief contact with meat and hide, possibly during butchering (Lazuén et al. Citation2011; Stemp et al. Citation2013). One endscraper revealed a very bright, smooth polish with domed topography. The traces were located mostly on and near the well-rounded edge and are interpreted as a result of bone working (a/2).
Eleven artefacts revealed post-depositional alterations that made interpretation of their function either exceedingly difficult or completely impossible. They showed several characteristics distinguishing them from other types of wear. Tool edges and ridges were irregularly chipped and sometimes heavily rounded. Surfaces were marked by numerous impact pits forming differently sized concentrations. Linear features of varying width and depth were distributed randomly, sometimes criss-crossing. The degree of abrasion spanned mostly from light and local to medium and covering most of the surface. Examples of very heavy, covering abrasion making the entire surface appear matt to the naked eye were exceedingly rare.
The traces detected on EDAR 135 upper-level tools, although rare due to post-depositional damage, suggest activities oriented mostly towards processing of hide and bone. It is possible that some of the tools were also applied to softer materials, for example meat (butchering?) or for shorter periods of time, resulting in the creation of weaker and more generic traces (Rots et al. Citation2011; Igreja and Porraz Citation2013; Porraz et al. Citation2015).
Although quite small, the analysed sample reflects general use-wear trends observed in other MSA assemblages from Africa where evidence of work on faunal resources has been recorded. Artefacts from Diepkloof Rock Shelter in the Western Cape Province of South Africa, which are dated by TL to 106 ± 10 kya and by OSL to 109 ± 10 kya (although note that the chronology for this site is contentious (e.g. Tribolo et al. Citation2013; Jacobs and Roberts Citation2017) show traces of the processing of wood and animal materials by cutting and scraping (Igreja and Porraz Citation2013). Traces of butchering have also been found at Site 8-B-11 on Sai Island, Sudan, where they were accompanied by several artefacts bearing impact wear, implying a possible function as hunting weapons. Most of the Sai tools were used hand-held, whereas the projectiles were hafted (Rots et al. Citation2011). Finally, we note that wood and hide working, together with butchery, are activities detected at White Paintings Rock Shelter site, Botswana. This younger (94.3 ± 9.4 kya) site also provided numerous examples of points used as spear tips (Donahue et al. Citation2004).
Artefact taphonomy provides clues about site formation processes. Published experiments show that the damage found on the analysed sample could have been caused by several factors, including the friction between sediment and artefact surface, rolling, sand particle impact or water activity (Venditti et al. Citation2016). Aeolian abrasion creates numerous impact pits, flat fractures, and cracks (K. Knutsson and Lindé Citation1990). In the case of water abrasion, the degree of wear depends on artefact stability. Surfaces and edges of freely rolling artefacts become well-polished and rounded. Being embedded or buried in sediment makes such damage more local. Rolling in coarse-grained gravel would have exacerbated chipping (Petraglia and Potts Citation1994; Venditti et al. Citation2016).
Thus, some traces on the EDAR 135 artefacts, such as impact pits, irregular striations and crushes, could have been caused by aeolian activity. Other features, such as edge rounding and chipping, covering abrasion, irregular patches of bright polish and criss-crossing striations, may be attributed to transport in water.
The assemblage: summary
The analysed assemblage can be characterised as being rather utilitarian and opportunistic, at least from the technological point of view. It is dominated by quartz chips by count and cores by weight (). Tools were quite abundant, too, and the flake-tool ratio for the whole assemblage was approximately 3.2.
The blanks came mostly from non-predetermined, multiplatform or unidirectional cores. This is corroborated by both core type frequency and flake dorsal side attributes ( and ). The cores were reduced intensely, with the overwhelming majority of them found in an advanced or residual state. Thus, mainly multi/unidirectional flakes with no or little cortex were the key product of blank production (). They were rather thick, usually below 30 mm in diameter and had length/width ratios of between 1:1 and 2:1. Such blanks were then transformed into tools. In most cases, this encompassed applying generic retouch to parts of their edges; sometimes the retouch can be described as notch or denticulate. Endscrapers were the most numerous formal tool type ().
The rather marginal use of predetermined techniques is perhaps the most striking feature of the upper level assemblage at EDAR 135. It is evidenced only by four Levallois cores, two tools and several core-trimming flakes. Although initially hinted at by several artefacts from the mine wall at the site, closer examination revealed no evidence of use of the Nubian Levallois technique (Masojć et al. Citation2019: 147).
It seems unlikely that such a situation is the result of factors related to raw material quality and availability (sensu Andrefsky Citation1994). The assemblage from the adjacent, although younger MSA site of EDAR 155 was based on the same stone sources and has a higher incidence of Levallois tools and cores. In another nearby site, EDAR 134, rhyolite was the predominant raw material. All the remaining assemblages, whether younger or older than that from EDAR 135's upper level, were dominated by quartz (Masojć et al. Citation2019: 146–147, Citation2021b).
If we exclude raw material limitations, we are therefore led to conclude that the technological choices evident must have been functionally motivated, i.e. by the needs to which the manufactured tools corresponded. Micro-traces of use were to a large degree obliterated by factors standing behind the formation of the artefact-bearing layer. What could be detected, coupled with the environmental context in which the tools were utilised, seems to hint at a functionally driven production. Micro-traces appear to suggest that these small tools were used ad hoc, during animal butchery. These preliminary and tentative observations may imply that the repertoire of reduction sequences and artefact forms was wide and did not only depend on socio-cultural factors. The question that inevitably follows from this is whether this situation should be treated as unique or whether it has analogies elsewhere in the MSA of Northeast Africa and beyond?
Discussion: EDAR 135 in the Middle Stone Age of Northeast Africa
An accurate comparison of the upper level assemblage at EDAR 135 with contemporaneous, published ones from Sudan, Nubia and the rest of Northeast Africa is not an easy task to accomplish (Scerri and Spinapolice Citation2019; Usai Citation2019; Garcea Citation2020; Leplongeon Citation2021, Citation2022; Masojć Citation2021). The dearth of similarly well dated sites and the technological characteristics of the analysed assemblage make placing it within any of the taxonomic units identified in the area in MIS 5 (the Nubian Complex, the Lupemban and the Aterian) an exceedingly difficult task.
One analogy, perhaps the closest, comes from a complex of MSA localities found near Kharga Oasis in the Western Desert of Egypt. One of them, KH/MT-02 contained an artefact-bearing silt layer between two tufa sheets dated by uranium-series methods to 103 kya (above) and 128 kya (below) (Smith et al. Citation2007: 695). The assemblage was composed mostly of débitage and cores, which were described as oval, discoidal and ‘classical Levallois’, although two triangular specimens, interpreted as Nubian II cores are mentioned as well (Smith et al. Citation2007: 695–696). Because of their minor proportion in the assemblage, these Nubian Complex components were treated as the results of local innovation or inter-population contact (Smith et al. Citation2007: 699).
The complexly stratified site of Taramsa in Upper Egypt provides another analogy. Lithic artefacts found in the oldest group of contexts named Activity Phase I, which is dated to between approximately 117 and 160 kya, have been described as coming from a production system dominated by the discoid method, with only marginal occurrence of a Levallois technique. The whole phase is classified as Lupemban; the later date is supposed to mark the onset of the early Nubian Complex (Van Peer et al. Citation2003: 225–227). It seems to correspond well to the situation in the upper level at EDAR 135, although there are differences, with blades and foliates being named as the main flaking products.
Other assemblages yielding similar ages as to those found in the upper level at EDAR 135 are quite different technologically and all exhibit a much higher importance of Levallois methods, especially of the Nubian kind. MSA artefacts from Site 8-B-11 on Sai Island, Sudan, are a good example. Found in layers above an OSL date of 150 ± 10 kya, they are described as having been made using classic Levallois, Nubian and discoid reduction strategies. They were also accompanied by thin bifacial foliates and described as belonging to a Nubian Complex with Lupemban affinities (Van Peer et al. Citation2003: 189). The lithic assemblage from Station One in northern Sudan shared these characteristics; its similarities to the upper level at EDAR 135 include the dominance of quartz despite the availability of other raw materials and the structure of non-Levallois cores and unifacial tools (Rose Citation2004).
Further comparable MSA assemblages such as Affad 23 (Osypiński et al. Citation2016) or BP177 in the Bayuda Desert of Sudan (Masojć et al. Citation2017; Masojć Citation2018) are either technologically quite different or not precisely dated. Site E-88-1 in Bir Sahara East, southern Egypt, is roughly contemporaneous, but its lithic industry was dominated by Levallois reduction (Close and Wendorf Citation1993). Some forms of retouched tools from the inselberg of Maghendoli, Sudan, especially burins and perforators (called gravers by the author), resemble those from the upper level at EDAR 135. This site, which was repeatedly used as a raw material source, is not well dated, but appears to be MSA in age. Additionally, its assemblage contains numerous stemmed tools, which are completely absent from all the EDAR sites (Carlson Citation2015: 120, 125–128).
In summary, assemblages that are approximately contemporaneous with that from the upper level at EDAR 135 have variously been classified as belonging to the Lupemban, the early Nubian Complex or the Aterian. Although the definitions of these taxonomic units seem to be quite well established, their exact ages change as new data are published. For example, the beginning of the Nubian Complex has been dated to anywhere between 240 to 120 kya, while its geographical distribution has widened from Nubia itself to the whole of Northeast, and then eastern, Africa together with the Arabian Peninsula and even the Levant (Groucutt Citation2020).
The presence of the Lupemban in Sudan is placed in MIS 6 and is known from two localities, Sai Island and Khor Abu Anga (Van Peer et al. Citation2003; Carlson Citation2015; Taylor Citation2016). The most characteristic feature of the Lupemban industries is a mixture of different lithic reduction strategies, including bifaces, prepared cores, blades and backed blades; bifacial lanceolate points as well as core axes and picks are common (Taylor Citation2016: 276). The Aterian, seen by some researchers as a desert adaptation, formed away from the larger hydrological systems and is distinguished by its stemmed tools; its early stage dates to MIS 6–5b. Despite differences in core reduction patterns, researchers have noted some similarities in blank production between Aterian and the Nubian Complex, perhaps stemming from a common, Lupemban origin (Scerri Citation2013; Scerri and Spinapolice Citation2019: ). MSA sites containing such forms are spread over vast areas of northern Africa, including Sudan (Carlson Citation2015; Scerri and Spinapolice Citation2019: ).
In addition, the assemblage from EDAR 135 shares some similarities with much younger collections that have been published as Khormusan, the most important feature of which is the absence of Nubian Levallois. On the other hand, the EDAR 135 assemblage shows no trace of bladelets, which are seen as a defining feature of the Khormusan (Marks Citation1968; Goder-Goldberger Citation2013).
As stated at the beginning of this section, there do not seem to be any direct analogies for the assemblage from the upper level at EDAR 135 among the published literature. This assemblage, which was gathered from a small area and is fragmentary, lacks forms that would allow it to be placed unambiguously in any of the above-mentioned complexes. The typical Lupemban (foliate bifaces), Nubian Complex (Nubian Levallois) and Aterian (stemmed tools) components are absent, in contrast to the situation with the few well-dated, published assemblages. Sites dated based on technological and typological properties of the lithics help only marginally.
Perhaps the EDAR 135 assemblage should therefore be viewed as yet another example of the variability of the lithic industries of Northeast and East Africa (Tryon and Faith Citation2013; Groucutt et al. Citation2015). Recent studies have shown that this variability is not necessarily dependent on geographical and environmental variation (Blinkhorn and Grove Citation2018). However, it is unfortunately not yet possible to determine unambiguously the cause of that variation, although it could perhaps reflect variability between the groups inhabiting the Nile Valley and societies subsisting in the habitats beyond it, as suggested by Van Peer (Citation1998). Such a difference could have been accentuated in periods of relative humidity in the region, such as MIS 5d (Drake et al. Citation2013: 56, ; but see Van Peer Citation2016 for an opposite view of conditions in MIS 5d).
There are chronological analogies to the upper level assemblage from EDAR 135 among Middle Palaeolithic sites in the Arabian Peninsula (Petraglia et al. Citation2011; Groucutt and Petraglia Citation2012; Blinkhorn et al. Citation2013). These localities were probably inhabited by Homo sapiens groups that originated in Northeast Africa (Armitage et al. Citation2011). The Al-Wusta site in the Nefud Desert of Saudi Arabia, where an intermediate Homo sapiens phalanx was recently found, is, for example, dated to ∼90 kya (Groucutt et al. Citation2018). Middle Palaeolithic sites in that area dating to MIS 5 are often thought to be located near palaeolakes and their lithic débitage is dominated by a centripetal Levallois technology (Breeze et al. Citation2017).
Many questions remain unanswered and there are still controversies and inconsistencies to investigate in the Northeast African Middle Stone Age (Groucutt Citation2020; Leplongeon Citation2022). However, well-dated sites such as the EDAR series can provide valuable new data. Eventually, this will enhance our understanding of variation in lithic assemblages and of the cultural processes that took place at the onset of the expansion of anatomically modern human populations across Africa and into adjacent parts of Eurasia.
Acknowledgements
This work was supported by the National Science Centre, Poland, under Grant no. NCN2015/19/B/HS3/03562 and the Excellence Initiative — Research University (IDUB) programme of the University of Wrocław. The project was based at the University of Wrocław and supported by the Korean Institute of Geoscience and Mineral Resources (GP2017-013), Gyeonsang National University and Al Neelain University, Khartoum, Sudan. Researchers and students from these organisations were of course not the only people participating in the fieldwork. It would not be possible to have carried out the project without the permission of the National Corporation for Antiques and the Museum in Khartoum and the dedicated work of our many Sudanese friends and colleagues.
Additional information
Notes on contributors
Maciej Ehlert
Maciej Ehlert is the chairman of the Archeolodzy.org Foundation. He obtained his PhD at the Institute of Archaeology of the University of Wrocław, Poland. Lithic technologies, especially in the Neolithic and Bronze Age of Europe and the Middle Stone Age of Northeast Africa, are his main field of expertise. He participated in the fieldwork and lithic analyses of the EDAR project.
Ju Yong Kim
Ju Yong Kim is an Honorary Research Fellow at the Korean Institute of Geoscience and Mineral Resource (KIGAM) and holds a PhD from Seoul National University (SNU). He carried out geoarchaeological investigations for the EDAR project as a principal research fellow of KIGAM, Korea.
Young Kwan Sohn
Young Kwan Sohn is Professor in Sedimentology at the College of Natural Sciences, Gyeongsang National University (GNU), Jinju City, Korea and a member of the EDAR geoarchaeological team.
Marzena Cendrowska
Marzena Cendrowska obtained her PhD at the Institute of Archaeology of the University of Wrocław, Poland, and is a post-doctoral research associate at The Zinman Institute of Archaeology in Haifa, Israel. She specialises in microscopic use-wear analyses of stone artefacts, with an emphasis on those made of quartz. She analysed tool samples from all the excavated EDAR sites.
Joanna Krupa-Kurzynowska
Joanna Krupa-Kurzynowska is an Associate Professor at the Faculty of Geoengineering, Mining and Geology of the Wrocław University of Science and Technology, Poland. She is a geomorphologist and her work on the EDAR project was focused on issues related to the site’s palaeoenvironment.
Eric Andrieux
Eric Andrieux is a post-doctoral research associate in luminescence dating at Royal Holloway University of London and Durham University, United Kingdom. He conducted the luminescence dating data analyses and calculations and participated in writing the manuscript.
Simon J. Armitage
Simon Armitage is Professor in Quaternary Science at Royal Holloway University of London (United Kingdom), and a PI of the Centre for Early Sapiens Behaviour (SapienCE) at the University of Bergen (Norway). He uses luminescence dating to better understand the relationship between climate change and early human behaviour, particularly in dryland environments. He supervised the luminescence data analyses for the EDAR project.
Grzegorz Michalec
Grzegorz Michalec is a PhD candidate at the Institute of Archaeology of the University of Wrocław, Poland. His research focuses on lithic technologies, both those of the Upper Palaeolithic in central Europe and those of the Acheulean and Middle Stone Age in Northeast Africa. He participated in the fieldwork and conducted the lithic analyses of the EDAR assemblages.
Ewa Dreczko
Ewa Dreczko obtained her PhD at the Institute of Archaeology of the University of Wrocław, Poland, and a member of the EDAR team. GIS analyses, particularly in Stone Age contexts, are among her research interests.
Hassan Mustafa Alkhidir
Hassan Mustafa Alkhidir is a faculty member at the Department of Archaeology, Faculty of Tourism and Archaeology, Shendi University, Sudan, and a PhD student at the Faculty of Arts and Humanities, University of Cologne, Cologne, Germany. He was an active participant in the EDAR project’s fieldwork campaigns.
Marcin Szmit
Marcin Szmit is the head of the Digitalisation and Archiving Department of Gdańsk Archaeological Museum, Poland. He has 20 years of experience in archaeological fieldwork in Sudan. In the EDAR project, he was responsible for surveying and the use of GIS tools.
Mirosław Masojć
Mirosław Masojć is an Associate Professor at the Institute of Archaeology of the University of Wrocław, Poland. His principal research interests lie in studying Pleistocene and early Holocene hunter-gatherers in Europe and Northeast Africa and flint knapping in the Late Bronze Age. He was the PI of the EDAR project.
Notes
1 The three published EDAR OSL dates, corresponding to the first, second and fourth samples from the top in a (Masojć et al. Citation2019: , ) have recently been recalculated following a standardised methodology at Royal Holloway, University of London as being younger than previously thought.
References
- Andrefsky, W. 1994. “Raw material availability and the organization of technology.” American Antiquity 59: 21–34.
- Armitage, S.J., Jasim, S.A., Marks, A.E., Parker, A., Usik, V.I. and Uerpmann, H.P. 2011. “The Southern Route ‘out of Africa’: evidence for an early expansion of modern humans into Arabia.” Science 331: 435–456.
- Bell, W.T. 1979. “Attenuation factors for the absorbed radiation dose in quartz inclusions for thermoluminescence dating.” Ancient TL 8: 1–12.
- Blinkhorn, J., Achyuthan, H., Petraglia, M. and Ditchfield, P. 2013. “Middle Palaeolithic occupation in the Thar Desert during the Upper Pleistocene: the signature of a modern human exit out of Africa?” Quaternary Science Reviews 77: 233–238.
- Blinkhorn, J. and Grove, M. 2018. “The structure of the Middle Stone Age of eastern Africa.” Quaternary Science Reviews 195: 1–20.
- Breeze, P.S., Groucutt, H.S., Drake, N.A., Louys, J., Scerri, E.L.M., Armitage, S.J., Zalmout I.S.A., Memesh, A.M., Haptari, M.A., Soubhi, S.A., Matari, A.H., Zahir, M., Al-Omari, A., Alsharekh, A.M and Petraglia, M.D. 2017. “Prehistory and palaeoenvironments of the western Nefud Desert, Saudi Arabia.” Archaeological Research in Asia 10: 1–16.
- Carlson, R.L. 2015. Khor Abu Anga and Magendholi. Stone Age Sites on the Sudanese Nile. Oxford: British Archaeological Reports.
- Clemente Conte, I. and Gibaja Bao, J.F. 2009. “Formation of use-wear traces in non-flint rocks: the case of quartzite and rhyolite — differences and similarities.” In Non-Flint Raw Material Use in Prehistory: Old Prejudices and New Directions/ L’Utilisation Préhistorique de Matières Premières Lithiques Alternatives: Anciens Préjugés, Nouvelles Perspectives, edited by F. Sternke, L. Eigeland, and L.J. Costa, 93–98. Oxford: Archaeopress.
- Clemente Conte, I., Lazuén Fernández, T., Astruc, L. and Rodríguez Rodríguez, A.C. 2015. “Use-wear analysis of nonflint lithic raw materials: the cases of quartz/quartzite and obsidian.” In Use-Wear and Residue Analysis in Archaeology, edited by J.M. Marreiros, J.F. Gibaja Bao and N.F. Bicho, 59–81. Cham: Springer International Publishing.
- Close, A.E. and Wendorf, F. 1993. “E-88-1: the archaeology of the Sandsheet.” In Egypt During the Last Interglacial. The Middle Palaeolithic of Bir Tarfawi and Bir Sahara East, edited by F. Wendorf, R. Schild and A.E. Close, 473–487. New York: Plenum Press.
- Derndarsky, M. and Ocklind, G. 2001. “Some preliminary observations on subsurface damage on experimental and archaeological quartz tools using CLSM and Dye.” Journal of Archaeological Science 28: 1149–1158.
- Donahue, R.E., Murphy, M.L. and Robbins, L.H. 2004. “Lithic microwear analysis of Middle Stone Age artifacts from White Paintings Rock Shelter, Botswana.” Journal of Field Archaeology 29: 155–163.
- Drake, N.A., Blench, R.M., Armitage, S.J., Bristow, C.S. and White, K.H. 2011. “Ancient watercourses and biogeography of the Sahara explain the peopling of the desert.” Proceedings of the National Academy of Sciences of the United States of America 108: 458–462.
- Drake, N.A., Breeze, P. and Parker, A. 2013. “Palaeoclimate in the Saharan and Arabian Deserts during the Middle Palaeolithic and the potential for hominin dispersals.” Quaternary International 300: 48–61.
- Duller, G.A.T. 2007. “Assessing the error on equivalent dose estimates derived from single aliquot regenerative dose measurements.” Ancient TL 25: 15–24.
- Durcan, J.A., King, G.E and Duller, G.A.T. 2015. “DRAC: dose rate and age calculator for trapped charge dating.” Quaternary Geochronology 28: 54–61.
- Galbraith, R., Roberts, R.G., Laslette, G. and Olley, J.Y. 1999. “Optical dating of single and multiple grain quartz from Jinmium Rock Shelter, Northern Australia. Part I, experimental design and statistical models.” Archaeometry 41: 339–364.
- Garcea, E.A.A. 2020. The Prehistory of the Sudan. Springer Briefs in Archaeology. Cham: Springer International Publishing.
- Goder-Goldberger, M. 2013. “The Khormusan: evidence for an MSA East African industry in Nubia.” Quaternary International 300: 182–194.
- Groucutt, H.S. 2020. “Culture and convergence: the curious case of the Nubian Complex.” In Culture History and Convergent Evolution: Can We Detect Populations in Prehistory? edited by H.S. Groucutt, 55–86. Berlin: Springer.
- Groucutt, H.S., Grün, R., Zalmout, I.A.S., Drake, N.A., Armitage, S.J., Candy, I., Clark-Wilson, R., Louys, J., Breeze, P.S., Duval, M., Buck, L.T., Kivell, T.L, Pomeroy, E., Stephens, N.B., Stock, J.T., Stewart, M., Price, G.J., Kinsley, L., Wai Sung, W., Alsharekh, A., Al-Omari, A., Zahir, M., Memesh, A.M., Abdulshakoor, A.J., Al-Masari, A.M., Bahameem, A.A., Al Murayyi, K.M.S., Zahrani, B., Scerri, E.L.M. and Petraglia, M.D. 2018. “Homo sapiens in Arabia by 85,000 years ago.” Nature Ecology & Evolution 2: 800–809.
- Groucutt, H. S. and Petraglia, M.D. 2012. “The prehistory of the Arabian Peninsula: deserts, dispersals, and demography.” Evolutionary Anthropology 21: 113–125.
- Groucutt, H.S., Scerri, E.M.L., Amor, K., Shipton, C., Jennings, R.P., Parton, A., Clark-Balzan, L., Alsharekh, A. and Petraglia, M.D. 2017. “Middle Palaeolithic raw material procurement and early stage reduction at Jubbah, Saudi Arabia.” Archaeological Research in Asia 9: 44–62.
- Groucutt, H.S., Scerri, E.M.L., Lewis, L., Clark-Balzan, L., Blinkhorn, J., Jennings, R.P., Parton, A. and Petraglia, M.D. 2015. “Stone tool assemblages and models for the dispersal of Homo sapiens out of Africa.” Quaternary International 382: 8–30.
- Guerin, G., Mercier, N. and Adamiec, G. 2011. “Dose-rate conversion factors: update.” Ancient TL 29: 5–8.
- Guerin, G., Mercier, N., Nahtan, R., Adamiec, G. and Lefrais, Y. 2012. “On the use of the infinite matrix assumption and associated concepts: a critical review.” Radiation Measurements 47: 778–785.
- Igreja, M. and Porraz, G. 2013. “Functional insights into the innovative early Howiesons Poort technology at Diepkloof Rock Shelter (Western Cape, South Africa).” Journal of Archaeological Science 40: 3475–3491.
- Jacobs, Z. and Roberts, R.G. 2017. “Single-Grain OSL chronologies for the Still Bay and Howieson’s Poort Industries and the transition between them: further analyses and statistical modelling.” Journal of Human Evolution 107: 1–13.
- Knutsson, H., Knutsson, K., Taipale, N., Tallavaara, M. and Darmark, K. 2015. “How shattered flakes were used: micro-wear analysis of quartz flake fragments.” Journal of Archaeological Science: Reports 2: 517–531.
- Knutsson, K. 1988a. “Chemical etching of wear features on experimental quartz tools.” In Scanning Electron Microscopy in Archaeology, edited by S.L. Olsen, 117–153. Oxford: British Archaeological Reports.
- Knutsson, K. 1988b. Patterns of Tool Use: Scanning Electron Microscopy of Experimental Quartz Tools. Uppsala: Societas Archaeologica Upsaliensis.
- Knutsson, K. and Lindé, K. 1990. “Post-depositional alterations or wear marks on quartz tools, preliminary observations on an experiment with aeolian abrasion.” Le Silex de Sa Genèse à l'Outil 17: 607–618.
- Lazuén, T., Valcarce, R., Lombera-Hermida, A., Xose P. and Rodríguez-Alvarez, X-P. 2011. “La gestión el utillaje de piedra tallada en el Paleolítico medio de Galicia. El nivel 3 de Cova Eirós (Triacastela, Lugo).” Trabajos de Prehistoria 68: 237–258.
- Leipus, M. 2014. “Análisis funcional de base microscópica de los instrumentos líticos manufacturados por talla de las unidades estratigráficas Y, S y Z.” In Estado Actual de las Investigaciones en el Sitio Arqueológico Arroyo Seco 2: (Partido de Tres Arroyos, Provincia de Buenos Aires, Argentina), edited by G. Politis, M.A Gutierrez and C. Scabuzzo. Olavarría: Incuapa-conicet, Unicen.
- Lemorini, C., Plummer, T.W., Braun, D.R., Crittenden, A.N., Ditchfield, P.W., Bishop, L.C., Hertel, F., Oliver, J.S., Marlowe, F.W., Schoeninger, M.J. and Potts, R., 2014. “Old stones’ song: use-wear experiments and analysis of the Oldowan quartz and quartzite assemblage from Kanjera South (Kenya).” Journal of Human Evolution 72: 10–25.
- Leplongeon, A. 2021. North-Eastern African Stone Age. https://doi.org/http://doi.org/10.1093/acrefore/9780190854584.013.563
- Leplongeon, A. 2022. “Le peuplement Paleolithique de l’Afrique du Nord-Est dans son contexte macroregional.” L’anthropologie.
- Liu, J. and Chen, H. 2016. “An experimental case of wood-working use-wear on quartzite artefacts.” Documenta Praehistorica 43: 507.
- Marks, A. E. 1968. “The Khormusan: an Upper Pleistocene industry in Sudanese Nubia.” In The Prehistory of Nubia, edited by F. Wendorf, 315–391. Dallas: Southern Methodist University Press.
- Masojć, M. 2018. “Lithic materials from a late Nubian Complex Middle Stone Age site in the Bayuda Desert: Goat Mountain.” In Bayuda Studies. Proceedings of the First International Conference on the Archaeology of the Bayuda Desert in Sudan, edited by A. Lohwasser, T. Karberg and J. Auenmüller, 503–534. Wiesbaden: Harrassowitz Verlag.
- Masojć, M. 2021. “Paleolithic Hunther-Gatherers of Nubia.” In The Oxford Handbook of Ancient Nubia, edited by G. Emberling, and B. Williams. New York: Oxford University Press.
- Masojć, M., Nassr, A., Kim, J.Y., Ehlert, M., Michalec, G., Krupa-Kurzynowska, J., Sohn, Y.K., Andrieux, E., Armitage, S.J., Szmit, M. and Kim, J.C. 2021a. “Gold miners on the trail of the earliest humans in the Eastern Saharan Africa. Investigating the Acheulean and Middle Stone Age in the Sudanese Nubia.” Journal of African Archaeology 19: 1–10. https://doi.org/http://doi.org/10.1163/21915784-20210003
- Masojć, M., Kim, J.Y., Krupa-Kurzynowska, J., Sohn, Y.K., Ehlert, M., Michalec, G., Cendrowska, M., Andrieux, E., Armitage, S.J., Szmit, M., Dreczko, E., Kim, J.Ch., Kim, J.S., Lee, G-S. Moska, P. and Jadain M.A. 2021b. “The oldest Homo erectus buried lithic horizon from the eastern Sahara, Africa. EDAR 7 – an Acheulean assemblage with Kombewa method from the Eastern Desert, Sudan.” PLoS ONE 16(3): e0248279.
- Masojć, M., Kusiak, J., Standzikowski, K., Paner, H., Kuc, M., Parafiniuk, M. and Szmit, M. 2017. “OSL/IRSL estimation for Nubian Complex Middle Stone Age settlement from Bayuda Desert in Sudan.” Journal of Archaeological Science: Reports 16: 391–396.
- Masojć, M., Nassr, A., Kim, J.Y., Krupa-Kurzynowska, J., Sohn, Y.K., Szmit, M., Kim, J.Ch., Kim, J.S., Choi, H.W., Wieczorek, M. and Timmermann, A. 2019. “Saharan green corridors and Middle Pleistocene hominin dispersals across the Eastern Desert, Sudan.” Journal of Human Evolution 130: 141–150.
- Michalec, G., Cendrowska, M., Andrieux, E., Armitage, S.J., Ehlert, M., Kim, J.Y., Sohn, Y.K., Krupa-Kurzynowska, J., Moska, P., Szmit, M. and Masojć, M. 2021. “A window into the Early–Middle Stone Age transition in Northeastern Africa—A Marine Isotope Stage 7a/6 Late Acheulean Horizon from the EDAR 135 site, Eastern Sahara (Sudan).” Journal of Field Archaeology 46(8): 513–33. https://doi.org/https://doi.org/10.1080/00934690.2021.1993618
- Murray, A.S. and Wintle, A.G. 2000. “Luminescence dating of quartz using an improved single-aliquot regenerative-dose protocol.” Radiation Measurements 32: 57–73.
- Nassr, A. and Masojć, M. 2018. “The EDAR project – Archaeological collaboration outcomes between the University of Al Neelain and the University of Wrocław in the Eastern Desert, Sudan.” Der Antike Sudan. MittSAG 29: 7–15.
- Ollé, A., Pedergnana, A., Fernández-Marchena, J.L., Martin, S., Borel, A. and Aranda, V. 2016. “Microwear features on vein quartz, rock crystal and quartzite: a study combining optical light and scanning electron microscopy.” New Approaches to the Study of Quartz Lithic Industries 424: 154–170.
- Osypiński, P., Morley, M.W., Osypińska, M. and Kotarba-Morley, A.M. 2016. “Affad 23: settlement structures and palaeoenvironments of the Middle Nile Valley, Sudan.” Antiquity 90: 894–913.
- Pargeter, J. and de la Peña, P. 2017. “Milky quartz bipolar reduction and lithic miniaturization: experimental results and archaeological implications.” Journal of Field Archaeology 42: 551–565.
- Pausata, F.S.R., Gaetani, M., Messori, G., Berg, A., de Souza, A.M., Sage, R.F. and deMenocal, P.B. 2020. “The greening of the Sahara: past changes and future implications”. One Earth 2(3): 235–250.
- Pedergnana, A. and Ollé, A. 2017. “Monitoring and interpreting the use-wear formation processes on quartzite flakes through sequential experiments.” Quaternary International 427: 35–65.
- Petraglia, M.D., Alsharekh, A.M., Crassard, R., Drake, N.A., Groucutt, H.S., Parker, A.G. and Roberts, R.G. 2011. “Middle Paleolithic occupation on a Marine Isotope Stage 5 lakeshore in the Nefud Desert, Saudi Arabia.” Quaternary Science Reviews 30: 1555–1559.
- Petraglia, M.D. and Potts, R. 1994. “Water flow and the formation of early Pleistocene artifact sites in Olduvai Gorge, Tanzania.” Journal of Anthropological Archaeology 13: 228–54.
- Porraz, G., Igreja, M. and Texier, P.-J. 2015. “Développement sur une discontinuité technique dans la séquence Howiesons Poort de l’abri Diepkloof (Afrique du Sud).” In Settlement Dynamics of the Middle Paleolithic and Middle Stone Age, edited by N.J. Conrad and A. Delagnes, 77–104. Tübingen: Tübingen Publications in Prehistory.
- Prescott, J.R. and J.T. Hutton. 1988. “Cosmic ray and gamma ray dosimetry for TL and ESR.” Nuclear Tracks and Radiation Measurements 14: 223–227.
- Rose, J.I. 2004. “New evidence for the expansion of an Upper Pleistocene population out of East Africa, from the site of Station One, northern Sudan.” Cambridge Archaeological Journal 14: 205–216.
- Rots, V., Van Peer, P. and Vermeersch, P.M. 2011. “Aspects of tool production, use, and hafting in Palaeolithic assemblages from Northeast Africa.” Journal of Human Evolution 60: 637–664.
- Scerri, E.M.L. 2013. “The Aterian and its place in the North African Middle Stone Age.” Quaternary International 300: 111–130.
- Scerri, E.M.L. and Spinapolice, E.E. 2019. “Lithics of the North African Middle Stone Age: assumptions, evidence and future directions.” Journal of Anthropological Sciences 97: 1–36.
- Schild, R. and Wendorf, F. 1977. The Prehistory of Dakhla Oasis and Adjacent Desert. Wrocław: Zakład Narodowy im. Ossolińskich.
- Smith, J.R., Hawkins, A.L., Asmerom, Y., Polyak, V. and Giegengack, R. 2007. “New age constraints on the Middle Stone Age occupations of Kharga Oasis, Western Desert, Egypt.” Journal of Human Evolution 52: 690–701.
- Stemp, W., Lerner, H. and Kristant, E. 2013. “Quantifying microwear on experimental Mistassini quartzite scrapers: preliminary results of exploratory research using LSCM and scale-sensitive fractal analysis.” Scanning 35: 28–39.
- Sussman, C. 1985. “Microwear on quartz: fact or fiction?” World Archaeology 17: 101–111.
- Taipale, N. 2012. “Micro vs. macro: a microwear analysis of quartz artefacts from two Finnish late Mesolithic assemblages with comments on the earlier macrowear results, wear preservation and tool blank selection.” MA diss., Uppsala University.
- Taylor, N. 2016. “Across woodlands and rainforests: a systematic re-appraisal of the Lupemban Middle Stone Age in Central Africa.” In Africa from MIS6–2: Population Dynamics and Palaeoenvironments, edited by S. Jones and B.A. Stewart, 273–299. Dordrecht: Springer.
- Tribolo, C., Mercier, N., Douville, E., Joron, J.-L., Reyss, J.-L., Rufer, D., Cantin, N., Lefrais, Y., Miller, C., Porraz, G., Parkington, J.E., Rigaud, J.-P. and Texier, P.-J. 2013. “OSL and TL dating of the Middle Stone Age sequence at Diepkloof Rock Shelter (South Africa): a clarification.” Journal of Archaeological Science 40: 3401–3411.
- Tryon, C.A. and Faith, J.T. 2013. “Variability in the Middle Stone Age of eastern Africa.” Current Anthropology 54: 234–254.
- Usai, D. 2019. “The Palaeolithic/Stone Age.” In Handbook of Ancient Nubia, edited by D. Raue, 155–170. Berlin, Boston: De Gruyter.
- Van Peer, P. 1998. “The Nile corridor and the Out-of-Africa model. An examination of the archaeological record.” Current Anthropology 19: 115–140.
- Van Peer, P. 2016. “Technological systems, population dynamics, and historical process in the MSA of northern Africa.” In Africa from MIS 6–2: Population Dynamics and Paleoenvironments, edited by S. Jones and B.A. Stewart, 147–159. Dordrecht: Springer.
- Van Peer, P., Fullagar, R., Stokes, S., Bailey, R.M., Moeyersons, J., Steenhoudt, F., Geerts, A., Vanderbeken, T., De Dapper, M. and Geus, F. 2003. “The Early to Middle Stone Age transition and the modern human behaviour at Site 8-B-11, Sai Island, Sudan.” Journal of Human Evolution 45: 187–193.
- Venditti, F., Tirillò, J. and Garcea, E. 2016. “Identification and evaluation of post-depositional mechanical traces on quartz assemblages: an experimental investigation.” Quaternary International 424: 143–153.