
 ?Mathematical formulae have been encoded as MathML and are displayed in this HTML version using MathJax in order to improve their display. Uncheck the box to turn MathJax off. This feature requires Javascript. Click on a formula to zoom.
Introduction
The decade following the global financial crisis (GFC) has witnessed rampant house price appreciation in many cities of the developed world. The metropolitan centres of New Zealand showcase this phenomenon with house price appreciation persistently outpacing income growth. In Auckland, the ratio of prevailing median house prices to median household income rose from 6.4 in 2010 to 10.0 in 2016 (Demographia, Citation2011, Citation2017), before declining to 8.6 by 2019 as house prices flat-lined while household incomes increased (Demographia, Citation2020). However, a strong resurgence in house prices during 2020 means that this ratio has resumed its upward trajectory, with an increase of approximately 16% set against an increase in average household income of only 4.4% for the year through to June 2019 (Statistics New Zealand, Citation2020). Increases over the last decade of a similar or even larger magnitude have occurred in the cities of Tauranga, Hamilton, Napier, Wellington and Dunedin. A study by the authors (Greenaway-McGrevy & Phillips, Citation2016) analysed data for the main metropolitan centres over 2005–2016, finding strong evidence of repeated episodes of house price exuberance coupled with clear indications of spill-over effects among New Zealand cities.
In response to these developments in the New Zealand housing market, an array of policy tools has been marshalled by the government and central bank designed to curb house price inflation. The measures have acted on both housing supply and demand but broadly have met with very limited success, as evidenced by the raw data in Figures and . Empirical results from recursive econometric tests for speculative exuberance in the Auckland and Wellington markets are shown in Figure . These recursive tests use the methods of Phillips, Shi, and Yu (Citation2015a, Citation2015b) for detection and real-time dating of asset price bubbles, and indicate the presence of real estate bubble episodes in both Auckland and Wellington housing markets over the two periods 2004–2006 and 2015–2016. Moreover, the latest data for Auckland and Wellington suggest a renewal of explosive behaviour in these two real estate markets in the final quarter of 2020, confirming widespread anecdotal and media evidence in late 2020 of intensive demand pressure and resulting FOMOFootnote1 in real estate activity in New Zealand.
Figure 1. Quarterly repeat sales index 1990Q1 to 2020Q4 with 1990Q1 = 1. Source: Author calculations. Due to data unavailability, inflation in REINZ monthly median sales price is used to impute index values between 2020Q1 and 2020Q4, using the middle month of each quarter.
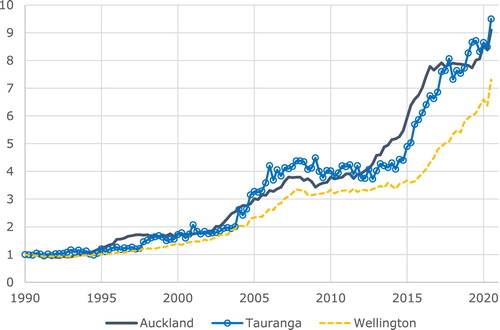
Figure 2. Quarterly price-rent (PR) ratios and annual price-income (PI) ratios for Auckland and Wellington. PR ratios span 1990Q1 to 2020Q4. PI ratios span 2010 to 2019. PI ratios obtained from Demographia annual reports, 2011 to 2019. Regional median rents obtained from Ministry of Business, Innovation and Employment. A four-quarter backwards moving average is applied to rents to smooth-out seasonal effects.
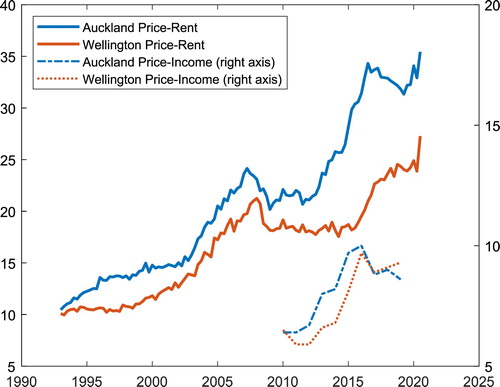
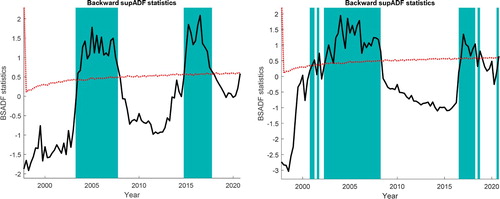
Figure 3. Phillips, Shi, and Yu (Citation2015a, Citation2015b, PSY) backwards supADF recursive test statistics (unbroken lines) for Auckland (left) and Wellington (right) log price-rent ratios. The corresponding recursive 5% critical value (cv) curves are shown by the broken lines. Shaded regions indicate periods during which the statistics exceed the cv and indicate explosive behaviour in the price-rent ratio. For Auckland, the test-statistic exceeds the 5% critical value between 2004 and 2008 and between 2015 and 2018, indicating exuberance during these periods. The test statistic is marginally below the 5% cv in final quarter of 2020. For Wellington, the test-statistic exceeds the 5% critical value between 2002 and 2009, between 2017 and 2019, and in the final quarter of 2020. Following PSY, the minimum window size fraction used in the recursions was set to 0.01 + 1.8/, or 20 observations, where T is the sample size.
In response to these recurrent developments over the last two decades, central government has recent sought to restrain housing demand by reducing foreign investment (through the Overseas Investment Bill) and by restricting investor speculation (through the Taxation (Bright Lines Test for Residential Land) Bill).Footnote2 In addition, macro-prudential policies by the Reserve Bank of New Zealand have sought to restrict access to credit through maximum load-to-value ratios (LVRs) that serve to cool down housing demand (Armstrong, Skilling, & Yao, Citation2019). These policies contributed to stabilizing house price appreciation for a few years after 2016, as evidenced in Figure . But these cooling measures have not led to noticeable reductions in house prices or improvements in affordability as measured by median price-to-income ratios. The latest data for 2020 indicate a renewal of rampant house price inflation that is contributing further to unaffordability.
In response to the Covid 19 crisis, in 2020 the Reserve Bank suspended LVR restrictions and significantly lowered the official cash rate (OCR). Mortgage rates fell commensurately in consequence as trading banks took advantage of substantial new monetary reserves to open up access to cheap loans. These changes in the availability and cost of mortgage finance have added to demand pressure on the housing market, raising housing fever and, concomitantly, risks to financial stability as the number of high loan-to-value mortgages has risen (Figure ).
Figure 4. Monthly interest rates, January 2004 to November 2020; Source: RBNZ.

Regulatory constraints on supply have also been moderated in some areas of the country. In Auckland, local government relaxed land use regulations in late 2016 through the Unitary Plan in order to stimulate construction and redevelopment of more intensive housing, with evidence suggesting that the policy change led to an effective depreciation of existing capital-intensive structures relative to land-intensive housing (Greenaway-McGrevy, Pacheco, & Sorensen, Citation2020). Most recently, the 2020 National Policy Statement on Urban Development urged local councils to better plan for population growth by measuring housing capacity and issued several directives intended to encourage intensification.
Overview of the special issue
Many of the housing market concerns discussed above in the context of New Zealand have been recurring issues in other countries and major metropolitan centres. Our goal in organizing this Special Issue of New Zealand Economic Papers is to bring together a collection of academic research papers that examine the causes, consequences and policy responses to house price inflation and unaffordable housing in New Zealand and other countries around the world. These papers include methodological studies as well as empirical research. As Guest Editors we followed the usual editorial procedures and standards of New Zealand Economic Papers, including double blind refereeing. Eleven papers were submitted for the issue, of which 8 survived the review and revision process.
The first task in any discussion of housing affordability is the accurate measurement of house prices, a task complicated by the considerable heterogeneity in the housing stock. Grimes, Sorensen and Young (Citation2020) examine whether a straightforward cross-sectional regression approach to house price measurement can outperform the commonly-used repeat sales estimator of Bailey, Muth, and Nourse (Citation1963) and Case and Shiller (Citation1987), finding that it does, albeit only under somewhat restrictive assumptions on price dynamics.
Supply restrictions often contribute to unaffordable housing. A large and growing body of literature demonstrates that overly restrictive land use regulations increase house prices by inhibiting development and reducing housing construction (see Gyourko & Molloy, Citation2015, for a recent survey). Cooper and Namit (Citation2020) quantify the costs of one such regulation that is relatively unique to Auckland: ‘viewshaft restrictions’ that ensure developments preserve sightlines of its prominent volcanic cones and historic War Memorial Museum from various vantage points in the city.
While there is an abundance of research on how regulation and land topology restrict housing supply, more recently there has been an upsurge of research examining how demand-side factors, such as speculation, have exacerbated unaffordability. Linked to the general issue of housing market speculation are related effects of spill-over influences across housing markets in different metropolitan areas. In this connection, the paper by Rherrad, Bago, and Mokengoy (Citation2020) applies real estate asset bubble tests to Canadian house prices, showing how speculative bubbles migrate between cities, pushing up prices as speculators anticipate capital gains.
Demand for housing naturally reflects the presence and absence of local amenities, such as parks, cafés, restaurants, and shopping centres as well as drivers at the national level. Liu et al. (Citation2020) use a hedonic model of house prices to estimate the value of another amenity, clean air, using a regression discontinuity design, finding that cities in China with greater particulate matter in local air pollution have lower house prices. This finding serves as a timely reminder that reductions in the cost of housing services that are achieved through the erosion of local amenities may deliver affordability but at the price of a lower quality of life, emphasizing the importance of thoughtful urban planning and environmental regulation in underpinning health and well-being.
The consequences of unaffordable housing are multifaceted, affecting labour productivity, economic output, financial stability, and intergenerational inequality. Unaffordable housing hampers growth and restricts household income by inhibiting labour mobility from less productive to more productive regions. The consequences can be long term on economic activity and societal well-being. Nunns (Citation2020) quantifies the cost of restrictive housing supply on the New Zealand economy, and concludes that per capita Gross Domestic Product would be approximately 1% higher if land use regulations were relaxed to permit additional construction in our large cities, such as Auckland.
Housing can also have negative consequences for the financial sector, as the GFC of 2008–2009 amply demonstrated. Pavlidis, Paya, and Skouralis (Citation2020) distinguish sustainable increases in house prices from those driven by exuberance, showing that the latter undermines the resilience of the financial sector, while the former enhances it.
House price appreciation is sometimes framed in a positive economic light as supporting consumption through the wealth effect. For many households, housing represents a large store of wealth that impacts consumption behaviour. Using the Singapore life panel dataset, Chen et al. (Citation2020) examine whether housing wealth influences the consumption behaviour of retirees, finding no evidence that increases in housing equity affect non-durable consumption.
The special issue also contains some useful lessons for policymakers looking to restore housing affordability. Fernandez, Sánchez, and Bucaram (Citation2020) show that inclusionary housing incentives introduced under ‘Special Housing Areas’ have failed to deliver cheaper housing in Auckland due to lax monitoring and enforcement of development obligations.
Conclusion
It is widely recognized in government, central bank, and academic circles in New Zealand and overseas that housing market concerns about rampant inflation, affordability, generational inequity, and societal divisions into haves and have-nots combine to present difficulties that have persistently challenged existing policy tools and the timing of market cooling measures. Regulators have been frustrated by the limitations of the conventional monetary toolkit when pressures on real economic activity, such as those precipitated by the GFC and Covid 19 pandemic, induce central banks to action quantitative easing on a vast scale and to reduce interest rates to historically low levels that lead to widespread demand side pressure on the real estate market.
The regular recurrence over decades of heated property markets, clearly manifested in Figures for New Zealand, has led to bewilderment about the effectiveness of conventional monetary, fiscal, and even well-directed macroprudential measures to control house prices, coupled with concerns about the real-economy impact of a housing market collapse that might be induced by the use of more extreme policy measures. Empirical econometric work designed to alert regulators of emergent house price bubbles can help in timing the use and extent of market-cooling measures; and better understanding of the empirical impact on prices of various restrictive regulations on land usage provides quantitative information about supply side pressures and indications of how these pressures may be alleviated by government intervention. The papers in this Special Issue of NZEP shed light on all these issues and will, we hope, be of interest to policy makers and property market researchers, as well as government and academic economists.
Acknowledgements
The authors thank Tayla Forward for excellent research assistance and Shuping Shi for providing helpful Matlab code.
Disclosure statement
No potential conflict of interest was reported by the author(s).
Additional information
Funding
Notes
1 Fear of missing out.
2 Both pieces of legislation were motivated in part by concerns related to housing affordability. See Hansard debate 19 December 2017, https://www.parliament.nz/en/pb/hansard-debates/rhr/combined/HansDeb_20171219_20171219_16 and Hansard debate 8 September 2015, https://www.parliament.nz/en/pb/hansard-debates/rhr/document/51HansD_20150908/volume-708-week-27-tuesday-8-september-2015
References
- Armstrong, J., Skilling, H., & Yao, F. (2019). Loan-to-value ratio restrictions and house prices: Micro evidence from New Zealand. Journal of Housing Economics, 44, 88–98.
- Bailey, M. J., Muth, R. F., & Nourse, H. O. (1963). A regression method for real estate price index construction. Journal of the American Statistical Association, 58(304), 933–942.
- Case, K., & Shiller, R. (1987). Prices of single family homes since 1970: New indexes for four cities. New England Economic Review, 45–56.
- Chen, L., Jiang, L., Phang, S.-Y., & Yu, J. (2020). Housing equity and household consumption in retirement: Evidence from the Singapore Life Panel. New Zealand Economic Papers, 55(1), 124–140. https://doi.org/10.1080/00779954.2020.1842794
- Cooper, G. C. K., & Namit, K. (2020). City with a billion dollar view. New Zealand Economic Papers, 55(1), 19–37. https://doi.org/10.1080/00779954.2018.1509110
- Demographia. (2011). 7th Annual demographia international housing affordability survey: 2020. Available at: http://demographia.com/dhi2011.pdf
- Demographia. (2017). 13th Annual demographia international housing affordability survey: 2017. Available at: http://demographia.com/dhi2017.pdf
- Demographia. (2020). 16th Annual demographia international housing affordability survey: 2020. Available at: http://demographia.com/dhi2020.pdf
- Fernandez, M. A., Sánchez, G. E., & Bucaram, S. (2020). Price effects of the special housing areas in Auckland. New Zealand Economic Papers, 55(1), 141–154. https://doi.org/10.1080/00779954.2019.1588916
- Greenaway-McGrevy, R., Pacheco, G., & Sorensen, K. (2020). The effect of upzoning on house prices and redevelopment premiums in Auckland, New Zealand. Urban Studies. https://doi.org/10.1177/0042098020940602
- Greenaway-McGrevy, R., & Phillips, P. C. B. (2016). Hot property in New Zealand: Empirical evidence of housing bubbles in the metropolitan centres. New Zealand Economic Papers, 50(1), 88–113.
- Grimes, A., Sorensen, K., & Young, C. (2020). Repeat sales house price indices: Comparative properties under alternative data generation processes. New Zealand Economic Papers, 55(1), 7–18. https://doi.org/10.1080/00779954.2019.1612937
- Gyourko, J., & Molloy, R. (2015). Chapter 19 - Regulation and housing supply. Handbook of Regional and Urban Economics, 5, 1289–1337. https://doi.org/10.1016/B978-0-444-59531-7.00019-3
- Liu, X., Li, Q., Chand, S., & Sharpe, K. (2020). Effects of air quality on house prices: Evidence from China’s Huai River Policy. New Zealand Economic Papers, 55(1), 52–65. https://doi.org/10.1080/00779954.2020.1827014
- Nunns, P. (2020). The causes and economic consequences of rising regional housing prices in New Zealand. New Zealand Economic Papers, 55(1), 66–104. https://doi.org/10.1080/00779954.2020.1791939
- Pavlidis, E., Paya, I., & Skouralis, A. (2020). House prices, (un)affordability and systemic risk. New Zealand Economic Papers., 55(1), 105–123. https://doi.org/10.1080/00779954.2020.1718185
- Phillips, P. C. B., Shi, S., & Yu, J. (2015a). Testing for multiple bubbles: Historical episodes of exuberance and collapse in the S&P 500. International Economic Review, 56, 1043–1078.
- Phillips, P. C. B., Shi, S., & Yu, J. (2015b). Testing for multiple bubbles: Limit theory of real-time detectors. International Economic Review, 56, 1079–1134.
- Rherrad, I., Bago, J.-L., & Mokengoy, M. (2020). Real estate bubbles and contagion: New empirical evidence from Canada. New Zealand Economic Papers, 55(1), 38–51. https://doi.org/10.1080/00779954.2020.1791940
- Statistics New Zealand. (2020). Household income and housing-cost statistics: Year ended June 2019. Retrieved December 16, 2020. https://www.stats.govt.nz/information-releases/household-income-and-housing-cost-statistics-year-ended-june-2019