
 ?Mathematical formulae have been encoded as MathML and are displayed in this HTML version using MathJax in order to improve their display. Uncheck the box to turn MathJax off. This feature requires Javascript. Click on a formula to zoom.
Abstract
Merger, acquisition and restructuring activity has long been conducted by public and private entities to minimise cost through increased scale of business operations. Past literature is mixed on the realised gains from this activity. Utilising a dataset of New Zealand-based regulated electricity distribution businesses we find limited potential gain from unit cost reduction purely through increasing scale. Instead, we find that potential benefits come from increasing the population density of service. This is important and often overlooked in policy conversations, particularly in relation to infrastructure activities operating highly capital-intensive businesses.
Introduction
Amalgamation of smaller entities into larger ones is often discussed as a way of achieving production efficiencies by lowering unit costs while maintaining output levels. As a result, private and public sectors have engaged in merger and acquisition (M&A) activity to increase private firm profitability or enhance the efficiency of core public services.
Economies of scales, which refers to a decrease in average (per unit) costs as output increases, has long served as the underpinning theory for various business behaviour, ranging from mass production to M&A activity.
If an industry faces a downward sloping average cost curve as output rises, amalgamation across the industry can positively impact a firm’s profit by decreasing the unit cost of production. Amalgamation consolidates the industry by lowering the number of firms, with the remaining firms increasing their production to match the previous aggregate levels. However, at some point capacity limits are reached given the required output level and additional fixed costs is required.
The relationship between service level and the average cost of production in an industry with a declining average cost curve is illustrated in Figure .
Figure 1. Descriptive representation of merger gains.
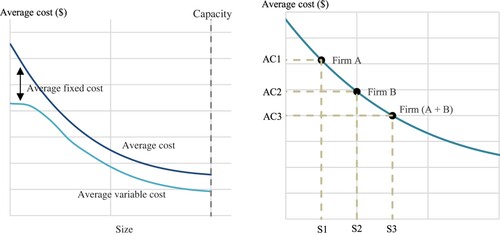
The gain from increasing scale, however, is not without debate and varies by industry and geographical location, amongst various other factors influencing business cost structure. Not all long-run average cost functions are downward sloping, in which case amalgamation can lead to diseconomies of scale.
Consider a manufacturing operation reliant on a limited resource as an important input to production, such as lithium for lithium-ion batteries. As demand for this input increases, its price rises. Therefore, greatly increasing the scale of a firm or operation will result in increased average costs of operations. Diseconomies of scale have also been documented in aviation as the cost of operations per passenger increased as plane sizes increased past their optimal level (Wei & Hansen, Citation2003). Conversely, a retailer can make gains from merging back-office operations, such as through better inventory management and technical products support, pushing down average cost per unit as scale increases.
This paper presents a new exploration of the relationship between scale, operation density and the potential for unit cost reductions from firm amalgamation for electricity distribution businesses (EDBs) in New Zealand.
This topic has been researched in the past with conflicting findings. Some studies find scale efficiencies in core infrastructure, such as electricity distribution (see Ajayi, Weyman-Jones, & Glass, Citation2017; Bobde & Tanaka, Citation2018; Kwoka, Citation2005 for instance), while others show limited gains available from scale efficiencies alone (Clark & Samano, Citation2022; Klien & Michaud, Citation2019; Kwoka & Pollitt, Citation2010).
Policy makers often cite scale efficiencies as a reason for amalgamating core public services, such as those delivered by government departments or of network services such as electricity distribution. In New Zealand, for instance, efficiency gains were cited as the reason for the amalgamation of several government agencies into the Ministry of Business, Innovation and Employment in 2012. More recently, economies of scale have a key argument for the ‘three-waters’ proposal, which aims to amalgamate the 67 local water-asset owning authorities into four (and subsequently ten) cross-regional entities (MBIE, Citation2022).
While both policy analysis and formal research have been conducted in this area, this paper adds to the discussion in two ways:
It presents an updated analysis of the amalgamation efficiencies of core infrastructure operations. Utilising a new testing approach, we examine a new panel dataset of electricity distribution-specific operations of New Zealand EDBs subject to the disclosure requirements of the New Zealand Commerce Commission (NZCC). This dataset adopts a new methodology for estimating average operating costs, adhering to clear and regulated definitions of regulated asset bases, which aligns with more recent international best practice.
It looks further at potential scale efficiency by explicitly analysing the interaction between density of service and operational size at the industry level across geographic regions. As natural monopolies, EDBs typically face a downward-sloping cost curve within their region. While an industry may experience declining unit costs (and at the extreme, be a natural monopoly) within a region doesn’t necessarily translate to economies of scale if the natural monopolies in different regions merge. This distinction between the slope of the supply curve within and between geographic regions is not always clearly considered in analysis underlying policy formulation related to network industries (e.g. MBIE, Citation2022).
When density is not considered, firm size or scale appears to decrease unit costs. However, this is misleading due to omitting a crucial factor – density. Consequently, analysis and discussions of the optimal scale of public and private infrastructure service delivery can be significantly skewed.
From a policy point of view, this finding indicates that efficiency gains from combining regional monopolistic operators in the electricity lines industry (and similar infrastructure utilities with substantial fixed capital) may be limited.
This paper highlights that while the technology of local networks is such that unit costs decrease as the scale of the operations increase – e.g. the per unit cost of a 220kv line is lower than that of a 110kv line – in a given geographical area, this does not necessarily translate to efficiency gains from amalgamating natural monopolies across different regions. Corporate amalgamation of two or more local networks does not necessarily increase utilisation of their existing lines or pipes. While some savings might arise in corporate overhead and improved access to technical skills, these may be minor relative to the capital costs inherent to infrastructure businesses.
Conversely, corporate amalgamation across different networks could introduce inefficiencies. Increased layers of corporate overhead, remote operations and diseconomies, rather than economies of scale, could outweigh any potential benefits. This paper adds to the literature by testing the hypothesis that potential economies of scale may exist within, but not necessarily between, regions for EDBs. If economies of scale are expected from merging EDBs in different geographical locations, we would expect unit costs to decline with an increase in overall size using our sample dataset i.e. as the number of connections, consumption and capacity. On the other hand, if the scale economies are limited to specific regions, then lower unit costs would be associated with increased density or increases in demand within a region, but not with increases in the overall size of an entity by merging geographically distinct natural monopolies.
Electricity distribution in the New Zealand market
Twenty-nine EDBs operate in New Zealand with each being a regional monopoly in terms of their electricity lines business. The EDBs’ lines businesses are subject to regulation by the NZCC. Twelve EDBs are consumer-trust owned and subject to information disclosure requirements while seventeen are investor, community trust or local government-owned enterprises subject to price-quality regulation.
In total, the EDBs distribute electricity to 2.2 million households and businesses. They have a regulatory asset base of $14.5 billion and maintain 157,000 kilometres of lines. In 2022, the New Zealand electricity sector supplied 32,600 gigawatt hours (GWh) of electricity using generating capacity of around 7,000 megawatts (MW).
A brief review of the relevant literature
The potential scale efficiencies within the electricity distribution and other local utilities services have been less investigated than other sectors. However, there has been some notable literature.
Kwoka (Citation2005) finds that, in the US market for electricity distribution, there is potential for mild scale-driven efficiency gains although this is more prevalent for lines operations than for the marketing and administration businesses connected to electricity transportation.
Bobde and Tanaka (Citation2018) find that, in India, customer structure and population density positively affect the efficiency of electricity distribution utilities companies. Additionally, Mydland, Haugom, and Lien (Citation2018) find significant potential scale efficiency gains, particularly in smaller electricity distribution firms in Norway.
In the New Zealand context, Giles and Wyatt (Citation1993) find early evidence of efficiencies from amalgamation of electricity businesses for small operators but not when a firm’s operations are large.
On the other hand, Kwoka and Pollitt (Citation2010) concluded mergers in electricity distribution businesses do not improve cost performance. Klien and Michaud (Citation2019) also find limited general cost efficiencies from increasing scale for water utilities in Europe. In addition, Klien and Michaud (Citation2019) find potential gains from amalgamation vary and depend on the consolidation design among other factors.
Finally, studies by Cronin and Motluk (Citation2007) and Clark and Samano (Citation2022) examine cost gains associated with electricity distribution businesses. Cronin and Motluk (Citation2007) take a backward-looking approach and find that limited efficiency gains followed the tax changes to incentivise amalgamation of local distribution companies (LDCs) in Ontario.Footnote1 Clark and Samano (Citation2022) take a forward-looking approach and depict no efficiency gains from further reforms to reduce LDC numbers also in Ontario.
With these mixed findings and limited work directly focusing on the New Zealand jurisdiction, we consider a new analysis relevant. Additionally, one factor that many studies discuss, but do not appear to explicitly analyse, is that relating to the interaction between size of operation and service density. Bobde and Tanaka (Citation2018) acknowledge customer density as a component of scale efficiency, but do not explicitly address the interaction between density and scale or test for whether the core source of the gain is scale, density, or a combination of the two. Kwoka (Citation2005) explicitly considers service density and shows weak potential gains when holding density constant. Our study differs from Kwoka (Citation2005) by looking directly at the interaction between density and scale as opposed to considering one while keeping the other constant.
Empirical analysis
Data
We collect data from information disclosed by EDBs between 2013 and 2022 on the NZCC’s website. Part 4 of the Commerce Act, 1986 (as amended) provides a regulatory regime for EDBs and sets out the requirements for information disclosure. These disclosures pertain to the natural monopoly aspects of the business operations and not the competitive business segments of the EDBs (e.g. Vector’s metering business).Footnote2 Data is reported annually and has been standardised since 2013, before which a clear picture of the operations was less attainable.Footnote3
From the data we extract measures of the size of each business and the values of average asset operating costs (AOCs), measuring the per-unit cost of service.
Measures of cost
Measures of the operating costs of the EDBs were compiled from information disclosures, following the Australian Electricity Regulator (AER) methodology for estimating average asset operating costs (AER, Citation2022). The AER methodology facilitates the investigation of efficiency gains in a modern regulatory environment by presenting accepted measures of inputs and outputs within electricity distribution.
The first AER benchmarking report (AER, Citation2014) was released in late 2014 and the methodology has been continually developed. Utilising this formalised methodology, which has been reviewed and debated in regulatory consultation processes, enriches the dataset as it follows a standard definition for calculating the cost of regulated natural-monopoly operations. Additionally, the NZCC has standardised the methodology and treatment for the regulated asset base for EDBs’ operations. While accounting treatments could lead to slight differences across firms over time, the asset bases utilised for calculating a fair return on capital employed in this study are known to be consistent over time.
Broadly following the AER, AOCs for each EDB for each year of available data were calculated as the sum of:
a return on capital employed, estimated as the pre-tax weighted average cost of capital (WACC) for regulatory capital employed;
depreciation; and
other asset operating costs (allocated pro-rata to operating asset classes by value where necessary).Footnote4
Measures of size
Using the information disclosure data and consistent with the AER measures of firm size and scale, three measures of EDB size were compiled, as follows:
energy delivered (GWh);
customer connections (number of installation control points (ICPs)); and
maximum demand (MW).
Each definition captures a distinct and important indicator of size. The first measure reflects demand, the second the customer base and the third, delivery capacity. An EDB might possess a large delivery capacity, however population levels and/or warm temperatures may mean that the EDB does not have many customers or a high level of demand. In such cases, the EDB may be physically large but not operating at full capacity and therefore the different definitions of size may give conflicting results. So, utilising only one measure of size may not give a complete analysis and all three should be used to get a better understanding.
Observed relationship between cost and size in electricity distribution
Figure presents the simple cross-sectional depiction of AOC, scale, and density by geographic location of the EDBs for the 2022 regulatory year. The first map presents the calculated AOC and the second utilises the total energy delivered size variable to indicate scale per EDB. Finally, the third map presents the density of each EDB defined as the total energy delivered per km of circuit length.
Figure 2. EDBs’ average asset operating costs, scale and density, 2022.
Note: The heat map depicts 2022 annual regulatory filings. The EDB boundaries are taken from https://critchlow.carto.com/tables/networkboundariesplustrees/public.
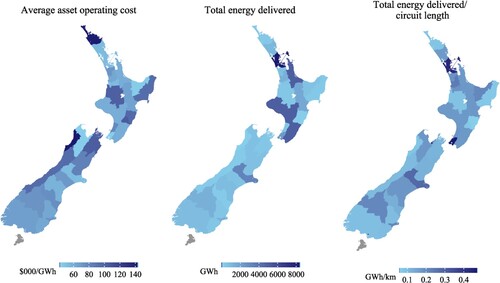
Figure presents the natural log unit AOC (depicted on the left side of Figure ), and the natural log of density (size variable per km of circuit length per network, depicted on the right side of Figure ) for each EDB. Each of our three definitions of size are shown for the years 2013–2022. Each data point on each chart represents one annual observation for one EDB. Panel 1 shows cost per unit of energy delivered with size measured by the amount of energy delivered (in GWh p.a.). Panel 2 shows cost per customer connection with size measured by the number of customer connections and Panel 3 depicts cost per unit of capacity with size measured by total capacity (as measured by maximum demand).
Figure 3. EDBs’ per unit asset operating costs, scale and density of operation, firm-year reporting 2013–2022.
Note: Data sourced from NZ Commerce Commission regulatory filings between 2013 and 2022.
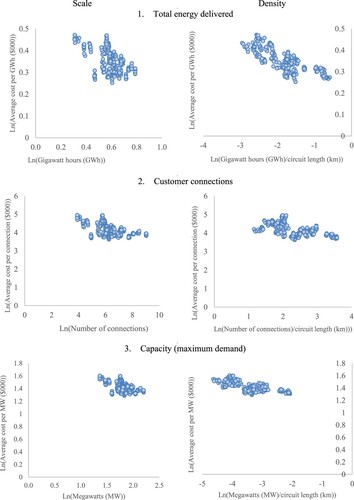
From the diagrams presented in Figure , we observe that regardless of the particular measure of size used the apparent industry cost curve is downward sloping (i.e. exhibiting decreasing unit costs) but with a fair amount of ‘noise’. Similarly, the right side of Figure shows a decreasing and potentially less noisy relationship between unit cost and density.
Regression analysis
For the regression analysis, we adopt a similar approach to that of Kwoka (Citation2005). However, we deviate by estimating a log-log model of cost and size and their relationship, rather than estimating the model assuming a quadratic cost function. Our methodology highlights the sensitivity, or elasticity, of the percentage changes in the dependent to the independent variables. Compared to the quadratic approach adopting a log-log model allows for clearer interpretation of the coefficients. This is particularly important as the question for this analysis is the impact of factors other than size on the cost function. Utilising the simple log-log model allows for better interpretation of coefficients pertaining to both cost and size, as well as cost and density.
We analyse the electricity distribution sector as a whole in order to assess the potential gains from broad, industry-wide amalgamations should they occur.
Our approach differs from previous studies by directly observing and estimating the industry cost curve. This allows for a more direct estimation of efficiency gains from amalgamations of electricity distribution activities specifically.
The approach adopted first employs a simple model of the relationship between unit cost (AOC per size variable) and size without allowing for the possible effects of density. This simple approach is often the one noted by policy advisers when addressing potential cost gains from amalgamation.
(1)
(1) where
is the unknown coefficient for time regressors and
is the firm-specific random effect;Footnote5
is the AOC per unit of output; and
takes on three different measures: total energy delivered; total number of customers; and total energy capacity for each EDB. Additionally, we add control variables for regional output and price level changes, as well as the recorded System Average Interruption Frequency Index (SAIFI) a quality-specific measure, to further control for cost and investment differences across EDBs.Footnote6
Developing on the model fitted in (1), we extend the analysis in (2) to control for the density of the region covered by each EDB.
(2)
(2) where
is defined as size variable per km of total circuit.
Results
The estimated relationships between cost and output are reported in Table . The three panels present the results of each model under the different definitions of business operation size. Columns (1) and (2) define the size, unit cost and density variables in terms of total energy delivered. Columns (3) and (4) define the size, unit cost and density variables in terms of total number of customers. Finally, columns (5) and (6) define the size, unit cost and density variables in terms of maximum demand, a proxy for total capacity available over a year.
Table 1. Determinants of average operating costs for EDB’s.
The results of the simple approach (Equation (1)) depict a strong negative relationship between the unit cost and the size of an EDB’s operation. Interpreting the coefficients as elasticities, consistent with the log-log model adopted, the coefficients reflect the percentage change in unit cost divided by the percentage change per independent variable. Column (1) indicates that in the simple model there is a statistically significant negative 0.21 percent decline in unit cost per 1 percent increase in total energy delivered.
When controlling for density, the effect of firm size on unit costs becomes statistically insignificant. Furthermore, the economic significance diminishes considerably, with a 1 percent increase in energy delivery translating to only a 0.034 percent fall in unit cost. In contrast, a 1 percent increase in density (kms of circuit per GWh delivered) is related to a 0.45 percent decrease in unit cost and is statistically significant at the 1 percent level.
The findings above are consistent across all three definitions of the scale or size of business operations. Increases in total energy delivered, customer numbers and total capacity are negatively associated with unit cost. However, when controlling for density of operation, the difference between size measures become statistically and economically insignificant. Density of operation becomes the driving factor for average operating costs.
Our findings reveal that a simple single-variate model might suggest a downward sloping average cost curve. However, this approach suffers from a significant omitted variable bias, resulting in an incomplete and misleading picture of the true cost curve faced by the industry. Further consideration and analysis are needed. We account for and analyse both size and density, the results indicating that scale alone does not create statistically significant cost efficiencies across the electricity distribution sector in New Zealand. Efficiency gains arise primarily from increasing the density of a firm’s operations, not the scale of its operations. The finding that density, rather than size, matters in reducing unit costs in electricity distribution makes sense given the physical characteristics of the industry. Increasing the number of customers without increasing the population density requires more capital (km of lines) and doesn’t necessarily reduce unit costs. On the other hand, increasing the population density in a distributor’s region is likely to allow for better utilisation of the capital stock in the short term and investment in larger scale circuitry with lower per unit costs over time.
Conclusions
M&A activity or amalgamation of firms potentially creates cost efficiencies by increasing the scale of the business activities. Many companies engage in M&A activity for this purpose. However, this paper highlights that increasing scale alone does not guarantee reductions in unit costs. For regional monopoly utilities service providers like EDBs, which lack competition and operate and maintain large, capital-intensive infrastructure, simply increasing scale without considering population density is unlikely to lead to a major reduction in unit costs and may even lead to an increase in unit costs if diseconomies of scale dominate. Public and private sector agents should be cognisant of this when formulating and assessing options for restructuring delivery of local network entities. Future research on this topic could include empirical studies of the significance of economies of scale in other capital-intensive network services and, where possible, utilise observed market activity to obtain causal inference on this topic.
Disclosure statement
No potential conflict of interest was reported by the author(s).
Notes
1 Tax holidays were granted to acquisitions if both the acquirer and target were public local electricity distribution companies.
2 This also excludes any retail or generation activity. See Gibbard and Grubb (Citation2024) for a monthly retail price and market share series.
3 While disclosure data is available since 2008, we limit the data to 2013 onwards. Data disclosures in 2013 used modified definitions of the Regulated Asset Base (RAB) and this led to some allowable revisions of the historical RAB values. Additionally, prior to 2013 the NZCC did not publish WACC values for disclosure years. We could estimate WACC values consistent with the approach of the NZCC however we consider the overall number of observations is reasonable and comparable to other studies (Kwoka, Citation2005).
4 For simplicity, consistency and reflecting some data availability constraints we have made a slight adjustment to the approach adopted by the AER. Our adjustment makes all the building blocks of the costs pre-tax and consistent across each cost measure.
5 A Hausman test indicates that a fixed-effects model is not necessary for this dataset. We include time-fixed effects as a joint F-test rejects the hypothesis that the year dummy variables are equal to zero and therefore time-fixed effects are required in the model.
6 We obtain regional GDP from Statistics New Zealand. Where an EDB operates in multiple regions, such as Powerco, we use the EDB’s key region of operation as the reference point for the GDP data. In addition, we utilise consumer price changes by broad region. The consumer price data is only available at the broad region level, broken into the key centres and the residual of each island. We consider broad region price changes appropriate as many prices will be set at the headquarter level. SAIFI is calculated as the total individual connection points affected by each grid interruption divided by the total connections covered by each EDB each year. NZCC has an additional quality measure, System Average Interruption Duration Index (SAIDI). As using SAIFI or SAIDI as a quality control variable does not impact the results we consider relying on a single measure as satisfactory. These controls aid in addressing any endogeneity concerns.
References
- Ajayi, V., Weyman-Jones, T., & Glass, A. (2017). Cost efficiency and electricity market structure: A case study of OECD countries. Energy Economics, 65, 283–291.
- Australian Energy Regulator. (2014). Electricity distribution network service providers: Annual benchmarking report.
- Australian Energy Regulator. (2022). Electricity distribution network service providers: Annual benchmarking report.
- Bobde, S. M., & Tanaka, M. (2018). Efficiency evaluation of electricity distribution utilities in India: A two-stage DEA with bootstrap estimation. Journal of the Operational Research Society, 69(9), 1423–1434.
- Clark, R., & Samano, M. (2022). Incentivized mergers and cost efficiency: Evidence from the electricity distribution industry. The Journal of Industrial Economics, 70(4), 791–837.
- Cronin, F. J., & Motluk, S. A. (2007). How effective are M&As in distribution? Evaluating the government's policy of using mergers and amalgamations to drive efficiencies into Ontario's LDCs. The Electricity Journal, 20(3), 60–68.
- Gibbard, P., & Grubb, C. (2024). Retail electricity prices in New Zealand: Recent trends and the relationship to market shares. New Zealand Economic Papers, 1–11.
- Giles, D., & Wyatt, N. (1993). Economies of scale in the New Zealand electricity distribution industry. In P. C. B. Philips (Ed.), Models, methods, and applications of econometrics (pp. 370–382). Oxford: Blackwell.
- Klien, M., & Michaud, D. (2019). Water utility consolidation: Are economies of scale realized? Utilities Policy, 61, 100972.
- Kwoka, J. (2005). Electric power distribution: Economies of scale, mergers, and restructuring. Applied Economics, 37(20), 2373–2386.
- Kwoka, J., & Pollitt, M. (2010). Do mergers improve efficiency? Evidence from restructuring the US electric power sector. International Journal of Industrial Organization, 28(6), 645–656.
- Ministry of Business, Innovation and Employment. (2022). Economic regulation and consumer protection in the three waters sector. Retrieved from https://www.mbie.govt.nz/dmsdocument/25807-economic-regulation-and-consumer-protection-in-the-three-waters-sector-proactiverelase-pdf
- Mydland, Ø, Haugom, E., & Lien, G. (2018). Economies of scale in Norwegian electricity distribution: A quantile regression approach. Applied Economics, 50(40), 4360–4372.
- Wei, W., & Hansen, M. (2003). Cost economics of aircraft size. Journal of Transport Economics and Policy (JTEP), 37(2), 279–296.
