
 ?Mathematical formulae have been encoded as MathML and are displayed in this HTML version using MathJax in order to improve their display. Uncheck the box to turn MathJax off. This feature requires Javascript. Click on a formula to zoom.
SUMMARY
Bioarchaeological analysis of human remains from St Hilda’s Church cemetery, South Shields was undertaken to investigate ancestral diversity in post-medieval Britain. Methodological evaluations argue that when diversity is explored through phenotypic traits, biological affiliations are best investigated through dental morphology due to its resistance to exogenous influences, whereas cranial form appears to be increasingly influenced by environmental and cultural factors in the post-medieval period. A novel quantitative model was developed for a within-group analysis of dental morphology assessed through the Arizona State University Dental Anthropology System, successfully identifying an ancestral outlier. An osteobiographical narrative for this individual, combining osteological and historical data with social theory, suggests that personhood is malleable and multifaceted. Ancestry is therefore most appropriately understood as one aspect of identity which also included sex, occupation, social status and linguistic affiliation.
INTRODUCTION
Post-medieval Britain was an ancestrally heterogenous society, with diversity increasing in magnitude due to Britain’s industrialising economy, colonialism and mercantile ventures.Footnote1 Though a small number of primary sources relate the importance of ancestry in a post-medieval context,Footnote2 historical research into ancestral diversity has been circumscribed by a general paucity of evidence and ancestry-focused osteoarchaeological investigations have been rare.Footnote3 The scarcity of osteoarchaeological research reflects the difficulties encountered when estimating ancestry through skeletal remains; past projects have been criticised for over-simplifying phenotypic diversity and perpetuating unethical, classificatory paradigms.Footnote4 It has also been debated to what extent biological affinities affect skeletal morphology in comparison to environmental pressures,Footnote5 and how well estimates of ancestry correspond to sociocultural associations.Footnote6
New analysis of skeletal remains excavated from post-medieval cemeteries and archived with museums and universities creates the opportunity to contribute to this understudied aspect of post-medieval life. The aim of the present study was to collect and statistically interpret dental morphological data from one such assemblage – the remains from St Hilda’s Church in South Shields – to critically evaluate methods of ancestry estimation and contextualise the nature and role of ancestral diversity in a post-medieval urban population. The aim was achieved through three research objectives: 1. to identify phenotypic outliers using dental non-metric traits and novel statistical procedures, and evaluate the further applicability of such exploratory techniques; 2. to employ a variety of methods to estimate ancestry and critically compare the suitability and efficacy of the techniques with reference to post-medieval skeletal assemblages; 3. to develop osteobiographies for any individuals of diverse ancestry (identified as statistical outliers) to explore attitudes to ancestral diversity in relation to other elements of personhood in post-medieval Britain.
BACKGROUND
THEORETICAL AND METHODOLOGICAL CONTEXT OF ANCESTRY ASSESSMENT
The frequent collocation of ‘ancestry’ with terms such as ‘race’ and ‘ethnicity’ render it difficult to delineate and commonly misunderstood.Footnote7 Recently, Kranioti and colleagues described ancestry as ‘an individual’s ancestral region of geographic origin.’Footnote8 Though this is a broad, perhaps ambiguous, definition, it does imply the time-depth and spatial separation requisite for the development of ancestral groups which are created when populations become geographically isolated and genetic admixture is limited.Footnote9 It is thus theorised that as geographic distance increases between human populations, so will genetic dissimilarity, though genetic heterogeneity can be accentuated or reduced by factors such as selective environmental pressures and culturally determined mating patterns.Footnote10 Such dynamic processes underpin genetic differences between population groups, yet, the subtle markers used in differentiation are ever-changing and no fixed boundaries exist.Footnote11
Ancestry, therefore, represents an individual’s biological affinity; although perceptions of race can closely correspond to ancestral affinity, race has no valid scientific foundation and can be viewed as a social construct.Footnote12 Race is a manipulable concept that has been used to oppress and segregate, and was arguably scientifically reified in 1735 when Carl Linnaeus separated humans into four subspecies distinguished by differences in their characters and physical features.Footnote13 Driven by the pervasive theory of biological determinism, many 19th-century scientists perpetuated this classificatory trend, contending that an individual’s innate moral quality and intellectual capacity were defined and delimited by their physical being.Footnote14 Even famous abolitionists rarely believed that peoples of different ancestral origins were equal; Charles Darwin referred to what he perceived as the ‘civilized races’ and ‘savage races’ of man.Footnote15 Although this theory was not restricted to racial categorisations, the concept of inherited qualitative differences in humans has permeated societies and underpinned segregationist policies that represent a form of structural violence aimed at limiting the opportunities of individuals believed to be inherently inferior.Footnote16 In a conscious effort to break from the racist character of formative scientific models of race and ancestry, which ascribed membership to a specific group and emphasised differences between groups, modern critical approaches instead explore a collective diversity or a range of human variation.
ESTIMATION OF ANCESTRY: TECHNIQUES AND RATIONALE
In archaeological settings attempts have been made to explore diversity through the analysis of grave goods and mortuary rites – the logic being that people whose origin lay in a different region could express ancestral affinities through clothing, accoutrements and funerary custom. This, though, can be problematic. Several individuals in Viking Age Orcadian burials, for example, were initially identified as Norse settlers based on the cut and alignment of their graves as well as the goods contained therein. Yet, with the benefit of aDNA testing it has been revealed that in some cases these individuals did not in fact possess a Scandinavian genotype but were most likely Picts that had adopted – or at least had been buried with – the markers of a Norse cultural identity.Footnote17 These cases highlight two points. Firstly, that cultural or ethnic identity is malleable and fluid; it may reflect personal agency and social processes such as assimilation and diversification. Secondly, that the most effective means of investigating ancestry and biological diversity is through the direct exploration of genetic materials.
Due to constraints in access and funding as well as the technical difficulties associated with extracting aDNA from diagenetically degraded materials, however, most archaeological research projects cannot directly investigate genetic heterogeneity through genomic analyses and usually rely on phenotypic proxies.Footnote18 Phenotypic traits, most often in the cranium or dentition and defined either metrically or non-metrically, are formed through a varying combination of genetics, environmental influences and culturally determined behaviours.Footnote19 Non-metric traits, also known as epigenetic and quasi-continuous traits, are phenotypic idiosyncrasies in skeletal form which have been linked to ancestry due to their heritability and can be described qualitatively but are difficult or impossible to consistently measure.Footnote20 Metric traits, in contrast, can be quantitatively described by measurements taken between two clearly defined landmarks – though applicable to post-skeletal and dental materials, this method is most frequently applied to cranial morphology when estimating ancestry.Footnote21 Phenotypic traits characterise a broad range of anatomical variation and have a strong biological underpinning; they do, however, present certain problems when investigating ancestry.
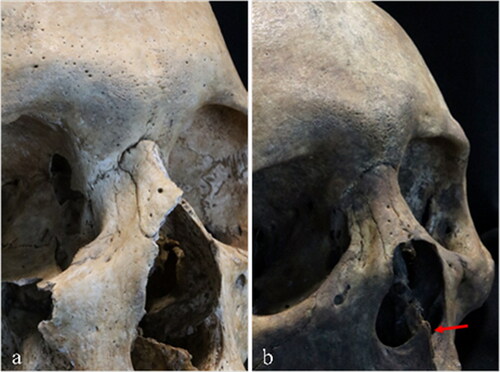
Cranial non-metric traits, for instance, have been successfully used to explore ancestry for many years. Even so, as traits are not confidently discernible until an individual reaches skeletal maturity and no trait is exclusively associated with any ancestral group (see example in ), investigations are limited to adult populations and investigator experience is fundamental in assessing subtle and subjective differences with a high degree of within-group variation.Footnote22 Furthermore, as the interpretative schemata through which cranial non-metric variation is analysed were largely developed at a time when social prejudices permeated science, they have been accused of perpetuating a racist and outdated view of ancestry in which people are coarsely grouped into ‘White’, ‘Black’ or ‘Asian’ categories.Footnote23 In reaction to such criticisms, statistical techniques have been developed to explore cranial variation – especially metrically – with the aim of achieving greater objectivity and inferential nuance. Programs like CRANID and FORDISC, for example, employ the measurements advocated by Howell to assess the length, breadth and height of various cranial features to compare adult crania to populations of known origin.Footnote24 CRANID is a particularly flexible program through which it is possible to conduct either a parametric Linear Discriminant Analysis (LDA) or non-parametric Nearest Neighbour Discriminant Analysis (NNDA). The former calculates the probability of group membership by comparing the weighted sum of an individual’s cranial measurements to mean values from sample populations, while the latter compares unstandardized scores to identify the closest matching crania.Footnote25 Nevertheless, craniometric databases do not yet comprehensively account for diachronic and geographic variation which can reflect significant levels of environmental and cultural influences.Footnote26
Fig. 1 Cranial non-metric traits in the nasal region are often used in ancestry estimation. These two crania illustrate variance in nasal bone contour: a) steepled, almost triangular, contour is more typical in individuals of European ancestry; b) low, rounded nasal bones are more frequently found in people of African ancestry; this individual, however, also has a pronounced nasal spine (red arrow) that is more common in European populations.
In contrast, dental non-metric traits are less affected by external influences.Footnote27 Certain dental traits occur more or less frequently in ancestral groups due to assortative mating patterns and genetic isolation, and are easily recorded using the Arizona State University Dental Anthropology System (ASUDAS).Footnote28 As such, it is generally believed that dental morphology represents the best alternative to direct genetic testing with some dental traits having an estimated heritability of >90%.Footnote29 As with the analysis of cranial form, the frameworks through which dental non-metric traits are being interpreted are becoming increasingly complex. While in the past many researchers took a hypothetico-deductive approach to estimating ancestry, the newly developed rASUDAS program uses a Naïve Bayes classifier algorithm that assumes conditional independence between traits to calculate the probability of an individual belonging to a specific biogeographic population cluster.Footnote30 Dental non-metric analyses are not without limitations though. As the observation of dental traits is typically restricted to the permanent dentition and as cultural and dietary factors – such as occlusal wear and dental caries – may still erode or obscure the dentition, many individuals are excluded from analyses.Footnote31 It is also debatable as to how precisely dental non-metric traits can differentiate biological affinities; some researchers have sought to identify specific familial and kinship clusters within cemeteries, whilst others more cautiously suggest that an individual or assemblage broadly confirms to a morphological pattern associated with much larger, regional population groups.Footnote32 Consequently, as no single method is free of uncertainties and problems, to achieve a substantive estimation of ancestry it is recommended that several methods are applied, though this can create contradictory results.Footnote33
Given such methodological uncertainties, it may be wondered why ancestry is estimated at all. On a practical level, ancestral biases exist in most methodologies used to develop sex, age and stature data,Footnote34 so osteoarchaeological analyses that do not consider the effects of ancestry could potentially generate skewed interpretations. Furthermore, ancestry can form an integral part of a person’s self-identity,Footnote35 influence their life experiences and susceptibility to pathological conditions,Footnote36 and the deep-rooted propensity for humans to recognise and respond to diversity renders any study of an individual or society incomplete if ancestral variation is not sociologically considered.Footnote37 As the New York African Burial Ground Project demonstrates, the consideration of ancestry in a bioarchaeological framework can be informative and socially engaging.Footnote38 In this project, researchers moved from a purely descriptive investigation of ‘ahistoric and acultural’ biological data and took an interdisciplinary approach.Footnote39 Historical and ethnographic sources enhanced the interpretation of osteological remains, permitting a more meaningful and inclusive reflection on the social history of an underrepresented sector of society whilst revealing the complexity of human skeletal and cultural variation.Footnote40
In summary, modern research into ancestry has struggled to escape its embittered past and efforts must always be made to prevent the propagation of categorical and racist paradigms on an impossibly large range of human diversity.Footnote41 Yet, reflecting holistically on the nature of human variation and the embodied experience of ancestrally diverse populations, including migrants, has the capacity to illuminate poorly explored aspects of the past and make historical research more inclusive.
HISTORICAL BACKGROUND: MIGRATION, REACTIONS TO DIVERSITY, AND SOURCES
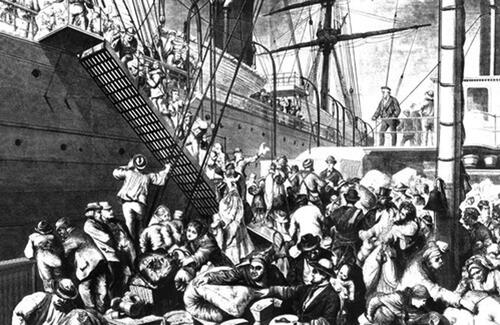
Post-medieval ancestral diversity was strongly related to economic and political disparities that developed during the period and, as depicts, the rapidly industrialising ports and cities of Britain became centres of migration.Footnote42 Previously, the effects of such large scale and varied movements of peoples have largely been investigated through official records and biographies, though both sources pose problems. Official records tend to be biased towards London and inconsistently record ancestral affinity.Footnote43 Furthermore, they do not investigate the lived experience of individuals and families in question but, instead, narrowly focus upon stereotypical fears surrounding migration: indigency, spread of disease and civil unrest.Footnote44 Biographies, in contrast, have been used to add humanising detail, describing the hardships and transformative processes experienced, but by definition are not generalisable.Footnote45 Hence, it is difficult to capture the full impact ancestral diversity had on society or the individual.
Fig. 2 Increasing numbers of migrants, many fleeing economic hardship and political uncertainty, were seen in 19th century British port cities, increasing levels of biological and cultural diversity. Illustration from Harper's Weekly, 7th November 1874.
Despite its limitations, historical data does paint an interesting picture of diversity, which appears to have reached new levels in the 18th and 19th centuries.Footnote46 Indeed, the magnitude of Irish and Scottish economic migrants provoked government commissions to establish how these influxes affected society and labour markets,Footnote47 while census data reports that 30,000-60,000 Germans entered Britain during the mid-19th century to escape famine, persecution and poverty.Footnote48 Additionally, as international trade increased in volume and frequency, especially between British colonies in the West and East Indies, there was an influx of foreign sailors of West African, Indian, Southeast Asian and Pacific origin known as lascars.Footnote49 Contemporary reports estimated that 10,000-12,000 of these seamen manned British ships during the mid-19th century and, as the government began to enforce a restriction on outgoing British vessels that required a certain percentage of the ship’s company to be of British origin, many of these sailors were compelled to remain in Britain for long periods – of these stranded lascars, approximately 140 perished per year as a result of the poor rations and the unsanitary living conditions in which they were expected to live.Footnote50 The expansion of international trading routes and global markets also facilitated the growth of the transatlantic slave trade and British ships – operating out of Bristol and Liverpool in particular – were involved in the transportation of millions of enslaved West Africans between the 16th and 19th centuries.Footnote51 Although most were forcibly relocated to colonies in the Caribbean and Americas, some found themselves in Britain – tombstones dedicated to enslaved Africans can still be found in Bristol’s Henbury Churchyard, for instance.Footnote52 Enslaved individuals occupied a variety of positions, but it became a marker of social status for wealthy families to have Africans in their households and those engaged in the domestic sphere are perhaps most visible in the historical record.Footnote53 Domestic service in general was a major employer for female migrants and it was not uncommon for servants and nursemaids contracted in India and Asia to accompany their employers when they returned to Britain.Footnote54 Though the scale of migration may seem surprising, to promote free trade the British government did not impose limitations on immigration until passing the 1905 Aliens Act, and it was only in the 1960s that legislation was enacted to substantially restrict entry on effectively racial grounds.Footnote55
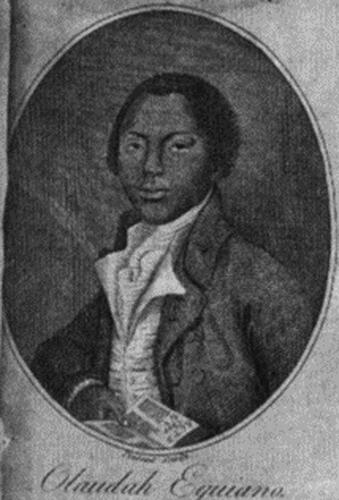
Many incomers that settled in England were economic migrants, frequently fleeing famine or hardship, and were compelled to undertake employment in low-paid, hazardous occupations as well as live in insalubrious, disease-ridden environments.Footnote56 It is perhaps no surprise then that the 19th-century Manchester Constables Accounts reported the giving of charitable payments to poor and sickly individuals from such disparate places as Constantinople and Bengal.Footnote57 There is also evidence of deliberate abuse against migrants, enslaved individuals and peoples of non-British ancestry for whom the protection of the law could not be guaranteed.Footnote58 Although in some situations legal protection was forthcoming – such as a case in 1800 in which a woman was summoned to appear before a Surrey court to be charged with the cruel treatment of her Indian maid – the legal status of enslaved peoples, for example, was highly ambiguous and judicial decisions on the subject were often diametrically opposed, popularly misinterpreted, or so narrowly phrased that their impact beyond a particular case was hard to discern.Footnote59 Nevertheless, societal attitudes and prejudices did not always prove to be an insurmountable barrier.Footnote60 So, though many ancestrally distinct individuals were forced to occupy socially liminal positions as indentured labourers, political exiles or transients, some managed to overcome social hostilities and rise to positions of prominence, as illustrated in the biographies of Sake Deen Mahomed and Olaudah Equiano.Footnote61 Sake Deen Mahomed was born in India in 1759, but relocated to Britain where he married an Anglo-Irish wife and established a successful business in therapeutic medicine which was acknowledged by medical professionals and patronised by royalty.Footnote62 Olaudah Equiano’s (see ) biography, meanwhile, recounts how after having been enslaved as a child, he negotiated his own freedom and became a renowned abolitionist, politician and social celebrity.Footnote63
Fig. 3 Portrait of Olaudah Equiano, a prominent Britain of non-European origin, taken from the frontispiece of his 1789 autobiography.
Despite being incompletely documented, it can be said that post-medieval British commercial centres were socially dynamic and, for some residents, ancestry played a fundamental role in shaping personhood and the life course.Footnote64 However, attitudes towards diversity were ill-defined and there would have been great variety in both the origins and experiences of migrants and their families.Footnote65 On the one hand, migrants could achieve great social and financial successes, but many were also employed in strenuous occupations and lived in sub-optimal conditions.Footnote66 The lack of comprehensive documentary data can, in part, be alleviated through interdisciplinary bioarchaeological investigations which draw upon osteological analyses and archaeological theory as well as historic sources.Footnote67 Skeletal material from port cities, such as South Shields, present viable research opportunities for such bioarchaeological explorations. Due to its prominent location and connection to maritime networks, South Shields during the 19th century was a demographically and industrially expanding city with collieries, chemical factories, shipyards and one of Britain’s largest international ports (see ).Footnote68 Investigation of mid-19th century documents report international migrants in the Tyneside area,Footnote69 while census data for contemporary Liverpool – a comparable port city – indicates that 1.5-2.0% of the population was not British.Footnote70 Migration of non-Europeans to South Shields had reached such levels by the early-20th century that riots erupted protesting the associated increase in workplace competition and cultural differences.Footnote71 One local paper went so far as to state that, ‘the import of coloured seamen and firemen is a more serious menace to the health of the community… and should be prohibited.’Footnote72
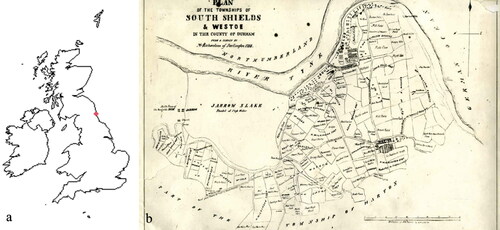
Fig. 4 The location of South Shields on the northeast coast made it a centre of maritime trade and industry during the 19th century. Illustration of the Tyneside area taken from Haswell.
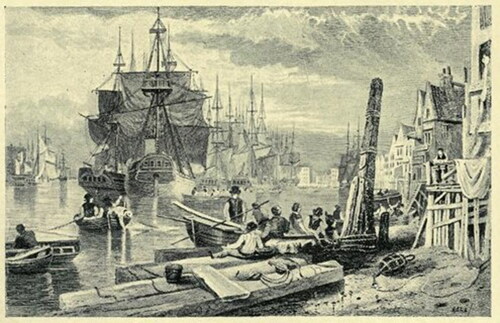
Fig. 5 a) South Shield’s location; b) a historic map of the city.
MATERIALS
THE CORONATION STREET ASSEMBLAGE
Rescue excavations at the site of St Hilda’s Parish Church in South Shields, conducted by Oxford Archaeology North between 2006-2007, uncovered 204 individual skeletons.Footnote73 The skeletal collection, known as the Coronation Street assemblage, is curated by the Department of Archaeology at the University of Sheffield.
Prior to submission to the University of Sheffield, a medium-resolution osteological analysis was conducted on the articulated skeletal remains to establish a demographic and health profile for the assemblage and highlight any individuals with notable pathologies or indicators of lifestyle – assessment of ancestry was not attempted at that time. A review of this report was undertaken to establish whether the Coronation Street assemblage was an appropriate collection through which to explore ancestral diversity. The osteological analysis revealed that the remains of most adults (n=91/117) were well-preserved with clear or only slightly eroded surface morphology, just over half the adults (n=60/117) were >75% complete, there were 100 individuals with surviving dentition, and that there were a total of 1,289 teeth within the assemblage.Footnote74
Of the 117 adult remains, sex could be estimated for 103 individuals; this revealed a near equal split of males (n=51) and females (n=52) with a very slight female bias. The original investigators noted that the marginal female bias was not generally typical, but also not altogether unusual when compared to other assemblages from the Newcastle area and historic data from the region.Footnote75 Age-at-death estimation in the adult population showed a peak in adult mortality in the ‘mature adult’ and ‘mature-older adult’ age categories, which were respectively defined as 36-45 and 36-45+ years of age. On the basis of these results it was suggested that the population had a life-expectancy of between 36-45 years, which is typical when compared to contemporary assemblages, though historic documents for Britain and the Tyneside area indicate that some individuals survived past their ninetieth year.Footnote76 From long bone lengths, the mean male stature was estimated to be 171 cm with a range of 149-181 cm; female mean stature was estimated as 159 cm with a range of 149-174 cm.Footnote77
A review of the assemblage report and historical documents revealed that, though St Hilda’s church was first recorded in the early 15th century, the excavated section was in use between the mid-18th and mid-19th centuries.Footnote78 The burials were largely of lower socioeconomic status and most likely associated with labourers employed in local industries.Footnote79 The existence of family vaults for more prosperous residents suggested an organised and symbolically invested burial rite.Footnote80 Historical research has indicated that individuals from culturally diverse backgrounds may have been inclined to follow a non-Anglican or non-Christian religion,Footnote81 however, St Hilda’s was the only burial ground serving the community until the latter half of the 19th century and therefore seems to have provided for all residents.Footnote82 As a consequence, from the late-18th century, the cemetery was built up and expanded on several occasions in response to population growth until it was eventually officially closed in 1855, though it appears that some interments – possibly in family plots – occurred as late as the 1860s.Footnote83
In summary, adult skeletal remains were well-preserved, many individuals had surviving dentition, there was a contextually typical demographic profile, and people of different backgrounds living within the environs of St Hilda’s church were unlikely to have been buried elsewhere. On the basis of this it was surmised that the Coronation Street assemblage presented a viable opportunity to explore ancestral diversity through dental non-metric traits in the South Shields population.
METHODS
This project consisted of two phases. Initially, a quantitative model was developed to identify significant deviations in dental non-metric trait expression within the skeletal population. Statistical outliers to this model represented individuals with traits that are non-normative, and therefore the most likely to be of non-local ancestry. Stage two was the construction of an osteobiographical narrative for outliers.
SELECTION AND STATISTICAL ANALYSIS OF DENTAL TRAITS
Due to their strong genetic component and archaeological survivability,Footnote84 dental traits were chosen in this initial phase of analysis to detect ancestral outliers. A total of 20 observations were made per individual, on the enamel surfaces of permanent first incisors, first molars and second molars (see ). Many of these traits, especially supernumerary cusps, are more commonly found in individuals with an ancestral affiliation to Sub-Saharan African, Southeast Asian and Pacific populations, whose presence in 19th-century Britain has been inferred from historical sources.Footnote85 Traits such as Bushman canine and enamel pearls were not included (see ); although the former has a very strong association with specific ancestral group – the Khoisan – historical documents do not suggest that individuals from this population were likely to have been present in 19th-century South Shields, whilst for the latter trait specific populational frequencies have not been established.Footnote86
Fig. 6 Small spherical masses of enamel on the tooth root, known as enamel pearls, are a dental non-metric trait whose occurrence in populations is poorly recorded and is of limited use in exploring ancestral diversity.
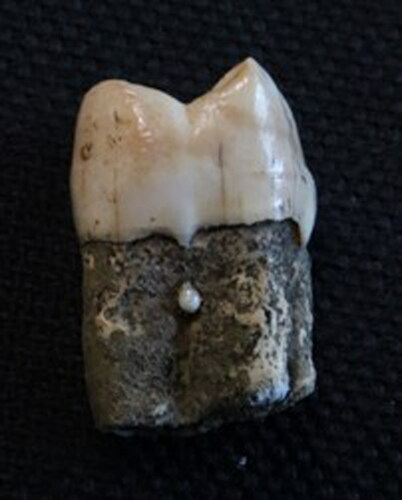
Table 1. Dental non-metric traits chosen.
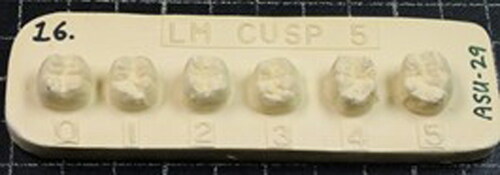
Traits were scored along the ASUDAS ordinal scale with reference to standardised plaques (example shown in ), pictures and written descriptions in a Microsoft Excel 2016 spreadsheet.Footnote87 The ASU system is an efficient, easily interpretable format that promotes transparency in research methods and evaluation by external observers.Footnote88 When available, both left and right dental quadrants of an individual’s dentition were observed; in the case of antimeric asymmetry, the greatest expression of a trait was scored, as it is believed that this represents genotype more accurately.Footnote89 Trait scores were converted to binarized presence/absence values at standardised breakpoints.Footnote90
Fig. 7 An ASUDAS reference plaque.
Typically, variance in dental non-metric traits is quantified by calculating either the Mean Measure of Divergence () or the Mahalanobis Distance (
). The latter was chosen in this instance because it was originally developed for use with biological variables, has been shown to produce comparable results to
is relatively well-catered for in most statistical packages, and, by taking into account the correlations between variables, prevents observations with high collinearity receiving undue weight.Footnote91 The formula for calculating the Mahalanobis Distance for
th skeleton in the sample is given as:
where
and
– transposed vectors of equal length that represented respectively the dental trait observations for the
th skeleton and the mean observations for the sample – while
is the covariance matrix. The computation thus reduced the multivariate data into a univariate statistic in N-dimensional Euclidean space
which measured the distance between a vector of scores for each individual and the underlying sample mean whilst incorporating the correlations between different scores so that infrequent or unusual combinations of traits generated a greater
statistic.Footnote92
A requirement for Mahalanobis analyses is a complete dataset. In an archaeological context, incomplete data is near ubiquitous, so prior to the calculation of missing trait observations were imputed.Footnote93 When imputing data, it is suggested that multiple data points should be estimated initially through probabilistic calculations based upon frequencies of genuine observations; the newly generated datasets represent a distribution of possible values, which can then be aggregated.Footnote94 In this study five imputations were performed using a regression method and the average used. After the computation of the
statistic, distances between individuals were visualised through Multidimensional Scaling (
). Kruskal’s Stress test was employed to indicate how well scaled data was visually represented in the given number of dimensions and an R2 value quantified the proportion of scaled variance accounted for; visualisations were considered valid when Kruskal’s Stress was <0.1 and R2 was >0.6.Footnote95 A p value was also calculated by comparing the
statistic to a χ2 distribution with N degrees of freedom to ascertain the probability of each distance representing a statistically meaningful outlier.Footnote96
Broadly speaking, an outlier is an abnormal deviation from a measure of centrality, but their statistical identification can be confused by the clustering of multiple outliers and there is no consensus regarding significance thresholds, or the alpha value (α), at which a value is deemed a significant.Footnote97 To select an appropriate significance threshold, a power analysis was conducted. Power analyses are generally employed to determine appropriate sample sizes to achieve acceptable statistical power where traditionally α=0.05.Footnote98 In this instance, sample size was pre-defined by archaeological survivability, permitting an inversion of custom to produce an experiment-specific significance threshold and a balancing of the statistical parameters associated with sample size and α, namely power and effect size.Footnote99 A relatively high statistical power (≥0.9) and a strong effect size (ɳρ2=≥0.8) were desired to ensure sensitivity to pronounced variations in a dataset which was expected to display a large degree of within-group variation.Footnote100 Though significant results would not directly specify the nature of an alternate hypothesis,Footnote101 the association of dental non-metric traits with ancestral groups inferred significant deviations were the result of ancestral differences.Footnote102 Thus, a flexible framework was established which satisfied the ethical demand for parameters to be explicitly stated a priori in ancestral research.Footnote103 All statistical procedures were conducted in SPSS 24.
OSTEOBIOGRAPHICAL NARRATIVES
The second phase of investigation involved the construction of osteobiographies for individuals identified as significant outliers. This qualitative approach, termed the bioarchaeology of the individual, theorises that the body is an experiential site which can reflect personal choices, social mores and culturally influenced behaviours,Footnote104 such as the saliency of ancestral affiliations.
A standardised suite of methodologies employed to estimate sex, age and stature are briefly described in .Footnote105 A body of evidence has formed, however, which demonstrates that these techniques can at times produce inaccurate estimates for individuals not of European descent – many of them having been developed using samples with a European or Euro-American bias. For some ancestral groups, corrections have been developed and these were applied as appropriate.Footnote106 Ancestry was estimated through a multifactorial process,Footnote107 using methods shown in . Based upon previous research, it was expected that a ‘simplified’ Western Eurasian dental complex, characterised by trait reduction from M1-M2, would be typical in 19th-century South Shields, as would craniometric analyses inferring a similarity to European populations;Footnote108 deviation from this pattern would infer a substantive ancestral difference that would justify further exploration. Cranial non-metric traits were not assessed for ancestral affiliations, as it has been argued that the associated interpretative frameworks impose a racial categorisation.Footnote109
Table 2. Features used for age, sex and stature estimation.
Table 3. Methods to estimate ancestry.
Palaeopathological features were recorded through standardised terminologies that specified the lesion’s anatomical location, appearance and size, so that the patterning of lesions could be comprehensively charted throughout the skeleton; the likely pathological processes that led to lesion development were also discussed with the intention of differentiating between acquired and congenital conditions.Footnote110 With this information, where possible, differential diagnoses were made when the distribution and inferred pathogenesis of lesions was suggestive of a specific disease, alternative aetiologies could be reasonably excluded, and contextual data – such as historic sources – were available to provide added supported.Footnote111 Particular interest was paid to diseases that are rare to the UK that might further suggest a non-British origin or ancestry and also lesions that reflected developmental perturbations, such as hypoplastic defects, as childhood growth can be more sensitive to cultural pressures and produce changes that persist into adulthood.Footnote112 It should, nonetheless, be noted that only stressors/diseases that disrupt physiological homeostasis for long enough to cause an alteration to bone morphology can be identified osteologically; especially virulent and acute diseases may cause death before any osseous signs develop, while low-level stressors may not leave discernible traces on the skeleton. As such, it is not always possible to fully appreciate an individual’s health during life through skeletal remains, and estimates of disease presence and prevalence are likely to be conservative in nature.Footnote113
Finally, the funeral rite was explored to discuss socio-cultural attitudes. Despite the fact that the focus of an osteobiography is on the lived experience, burial rites can reflect the attitudes of society in general.Footnote114 Through this multidimensional approach a narrative of an individual’s life course could be inferred, the role of ancestry in relation to other elements of personhood explored, and the effects of ancestral biases in methodologies discussed.
RESULTS
QUANTITATIVE RESULTS
In total, dental non-metric data could be gathered from 85 skeletons. Trait frequencies generally conformed to the trends expected in a Western Eurasian population, with low frequencies of traits such UI1 winging (9.1%) and shovelling (8.1%), as well as a pronounced reduction in molar trait expression from M1 to M2 (see ). χ2 tests did not detected significant associations between traits and sex. Using a random sample of five individuals and the calculation of an intraclass correlation coefficient (ICC) using a two-way mixed model, absolute observer agreement and the reliability of the data collection procedure was estimated to be ‘good’ (ICC=0.851).Footnote115
Table 4. Trait frequencies.
The visual representation of Mahalanobis distances did not lead to plots that were considered valid. The Kruskal stress score of 0.302 and R2 value of 0.532 for the two-dimensional plot did not meet the minimum thresholds believed acceptable; although the three-dimensional plot was associated with a reasonable R2 value of 0.70, a Kruskal stress score of 0.198 suggested that data was still not accurately displayed in three-dimensions.Footnote116 Greater success, however, was achieved in detecting statistical outliers through the use of a tailored p value. A power analysis indicated that strong statistical power (0.98) and effects size (ɳρ2=0.88) were accomplished with a rejection of the null hypothesis at p=≤0.01.Footnote117 With this criterion two significant outliers were detected: SK 358 (=40.531, p =0.00428) and SK 649 (
=46.759, p =0.00063). These skeletons were selected for the construction of osteobiographies.
QUALITATIVE RESULTS
OSTEOBIOGRAPHY 1: SK 358
For SK 358, grave cut truncation limited demographic and palaeopathological inferences to the skull, thorax and upper limb. Cranial morphology suggested a male, while ectocranial vault closure and the calcification of thyroid cartilage inferred that SK 358 was above 45 years of age at their time of death.Footnote118 Trotter’s regression formula for a ‘White’ individual – often used in historic European contextsFootnote119 – generated a stature estimate of 168.7 cm ± 4.05 which falls close to the assemblage’s male average (male mean=171 cm; range=149-181 cm).Footnote120 Regarding ancestral affiliation, SK 358’s dentition displayed a pattern of trait loss from M1-M2 typical of the Western Eurasian dental complex,Footnote121 and an rASUDAS assessment of dental non-metric traits assigned the greatest probability to Western Eurasian ancestry (52.0%).Footnote122 Damage to the cranium, which had led to both fragmentation and slight distortion of the cranial vault (see ), prevented a comparative craniometric analysis. In sum, it seemed likely that SK 358 was not ancestrally distinct and their identification as an outlier resulted from a combination of normal within-group variation and the imputation of several low frequency traits (n=3).
Fig. 8 Damage to SK 358’s cranial vault.
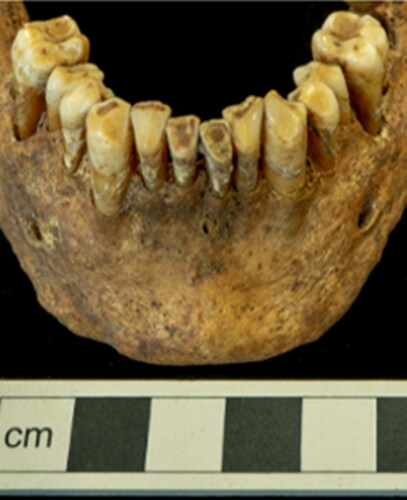
Perhaps the most striking features noted in SK 358’s skeleton were located in the dentition. There was, for instance, pronounced erosion of the antero-labial enamel surfaces in the mandibular teeth, seen in . This may either have been the result of using the dentition as a “third hand” or an overbite; an overbite could have been consequence of either a genetic predisposition or a response to the softer diet of the post-medieval period – it has been theorised that soft diets do not provide sufficient chewing stress to stimulate normal mandibular growth.Footnote123 Though dental defects and irregularities can be the cause of pejorative remarks in both past and modern populations,Footnote124 the extent to which such a noticeable idiosyncrasy affected SK 358 can only be speculated. Additionally, a pipe smoking notch was observed between the left mandibular canine and first premolar. For a pipe to have noticeably abraded the teeth, it can be suggested that SK 358 was a habitual smoker who used a coarse clay pipe. As socially privileged pipe smokers in the 19th century tended to use pipes made with less abrasive, meershum stems,Footnote125 it may be therefore be inferred that SK 358’s socioeconomic status was relatively low.
Fig. 9 Wear on the anterior dentition.
The supposition that SK 358 was of lower socioeconomic status is also consistent with skeletal signs of physical injury – deviated nasal bones and a healed fracture callus on a rib – that are frequently associated with employment in lower status and dangerous professions.Footnote126 Evidence for occupational adaptations were not, however, apparent in markers of degenerative joint disease (DJD) or alterations at sites of muscle and ligament attachment – known as entheseal change (EC). Osteophytic formation around the glenoid fossae, for instance, and EC in the pectoral girdle was largely bilateral and likely age related.Footnote127
OSTEOBIOGRAPHY 2: SK 649
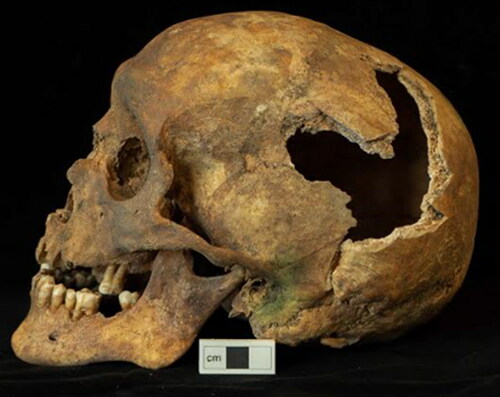
Much like SK 358, the grave of SK 649 had been truncated and only a partial skeleton was present; this included the cranium and mandible, both scapulae, claviculae and humeri, cervical and thoracic vertebrae, as well as the manubrium, sternum, and ribs. In the absence of the pelvis, sex estimation was based on cranial and mandibular morphology. Although overall it appeared that SK 649 was female – the relatively small mastoid processes and slight glabella in the cranium were typically feminine, for example – certain mandibular traits were more masculine.Footnote128 The gonial angle, for instance, was very steep, while the mandibular ramus was wide and robust (see ). When estimating age, further curious discrepancies were found. On the basis on dental development and epiphyseal fusion, it was believed that SK 649 was in their late teens or early twenties; the maxillary third molars were not quite in occlusion and the clavicular medial epiphyses were unfused.Footnote129 However, the sutures of the ectocranial vault were generally closed, which suggested that SK 649 was at least in their late-twenties and possibly much older (see ).Footnote130 From the length of the left humerus (34.7 cm), stature was approximated to be 174.6 cm ± 4.45, which is significantly taller than the female mean (159 cm) and is the upper extreme of the assemblage’s female stature range (149-174 cm).Footnote131
Fig. 10 SK 649's skull with notable mandibular robusticity.
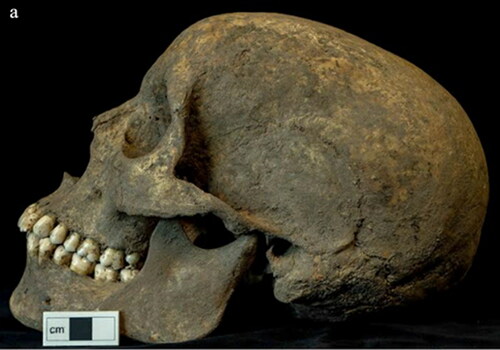
Table 5. Comparison of age estimates.
SK 649 possessed complex dental morphology, retaining cusps in the distal molars characteristic of Asian and African groups.Footnote132 Analysis of dental morphology via the rASUDAS program indicated that a Western Eurasian ancestry was unlikely (13.5%), and that Southeast Asian or Polynesian ancestry was most probable (33.9%) though the likelihood of Australo-Melanesian and Micronesian affinity was also high (32.1%).Footnote133 Although results from the FORDISC analysis did not reach the typicality probability criteria for classification,Footnote134 analyses conducted in CRANID were well catered for. LDA ascribed the greatest probability (46.9%) of affiliation to female populations from Hokkaido, Japan; the weighted sum was also highest for this population (692) and SK 649’s cranium was classified as female from Hokkaido through NNDA after all weighted sums were tallied. As the recommended cut-off points for reporting results are probabilities >0.1 for LDA and NNDA weighted sums >300, these results are presented in and .Footnote135 SK 649’s crowded dentition is also more common in Asian populations, but could similarly have been linked to a soft diet providing insufficient stress to encourage normal mandibular development.Footnote136
Table 6. Probabilities of population affinity based on LDA in CRANID.
Table 7. Results of NNDA in CRANID.
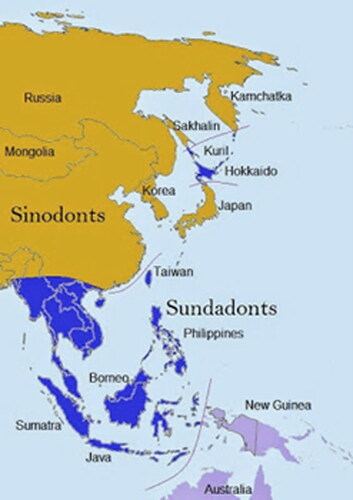
These ancestry estimates initially appeared disparate and contradictory. However, the Ainu population of Hokkaido, being descended from a separate migratory event from the majority of the Japanese population, are dentally classified as Sundadonts along with Southeast Asians, Polynesians and other Pacific Asian groups (see ).Footnote137 Sundadonts typically possess a ‘conservative’ dental morphology noted for features such as supernumerary cusp retention and third molar development. Sinodont groups, on the other hand, are noted for high frequencies of traits like incisor shovelling which were not observed in the dentition of SK 649.Footnote138 The results of dental and cranial analyses are therefore broadly consistent and it is proposed that SK 649 was of Sundadont ancestry and that their presence in South Shields was possibly connected to British colonial and mercantile ventures in Southeast or Pacific Asia.Footnote139 This estimate of ancestry also helped to clarify the idiosyncrasies noted in sex estimation; Sundadont groups can exhibit lower levels of sexual dimorphism in skull morphology, with mandibular robusticity noted in females.Footnote140 Additionally, it has been found that traditional ectocranial suture closure methods overestimate age in Southeast Asian populations by 13-22 years; adjusting for this gave an age-at-death estimate of between 18-29 years that is congruent with dental development and epiphyseal fusion.Footnote141 Stature was also recalculated as 160.2 cm ± 2.6 with a regression formula designed for Southeast Asian females.Footnote142
Fig. 11 Geographic dispersal of Sundadont and Sinadont populations. Map courtesy of Austin Whittal, Citation2014.
Several lesions suggested that SK 649 had been subjected to episodes of stress during development. For instance, slight porotic lesions were observed in SK 649’s orbits. These lesions, known as cribra orbitalia, most often develop during an individual’s early years and can be caused by a range of factors that includes nutritional insufficiency, infection and metabolic imbalances; generally, they are taken as evidence of non-specific stress experienced during infancy or childhood.Footnote143 Bilateral linear enamel hypoplastic (LEH) defects on the mandibular canines, estimated to have formed between 3.0-3.9 years of age, further indicated that SK 649 was physiologically stressed during their formative years. LEH, which have the appearance of furrow-like depressions, form when normal enamel production is disrupted; although this can be the result of localised trauma, bilateral defects are more likely to be the consequence of a systemic perturbation.Footnote144 Weaning and the cessation of maternal support has been implicated in the formation of cribra orbitalia and LEH in past populations,Footnote145 however, the estimated age of LEH formation is slightly later than the typical weaning age for the period of c. 2 years.Footnote146 Yet, as the lesions cannot be definitively linked to a specific cause, it is impossible to tell if this represents a weaning practice not normative for an industrial British population or an alternate explanation – such as interindividual variation in the chronology of dental development.
Entheseal and degenerative joint changes present in the left scapula – but absent in the right – appeared to be the result of physical activity. As shows, heterotopic ossification had occurred at the origin of the Teres major muscle on the lateral border of the scapula, whilst a depression in the glenoid fossa was differentially diagnosed as osteochondritis dissecans – a degenerative change in which a piece of cartilage and subchondral bone become detached from the joint surface.Footnote147 Both of these lesions, though multifactorial, are often associated with intense or repetitive strain; the latter especially so in adolescents and younger adults.Footnote148 In SK 649, this exertion appears to be focused on movements at the left glenohumeral joint, despite humeral and clavicular dimensions inferring right-handedness. As can be seen in , the right clavicle is more robust and slightly shorter, while the right humerus is longer overall and broader at sites of muscle attachment around the epicondyles; this suite of adaptations has been associated with the additional mechanical and compressive forces in the shoulder girdle and upper limb of the dominant side.Footnote149 On this basis, it is speculated that SK 649 repeatedly undertook a prescriptive and possibly specialist task that dictated an imbalanced loading of the non-dominant hand resulting in trauma and subsequent osteological modifications.
Fig. 12 Ossification at the origin of Teres major on the lateral border of the left scapula.
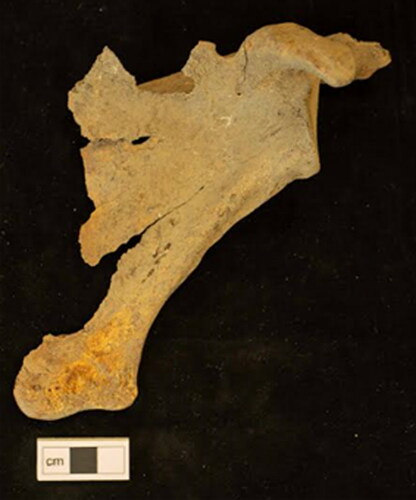
Table 8. Clavicular and humeral measurements in millimetres.
Longitudinal cortical defects with raised margins, located bilaterally at Pectoralis major’s humeral insertions and unilaterally at the clavicular origin of the right Deltoid muscle, could have been interpreted as further evidence of activity-related trauma.Footnote150 However, these lesions in younger individuals can be ascribed to an imbalance in osteoclastic and osteoblastic activity associated with the migration of fibrous muscle attachments during diaphyseal growth.Footnote151 The young age estimate, established through consideration of ancestral biases in aging methods, supported the latter interpretation.
SK 649's burial in an area of the cemetery thought to be consecrated and in use until c. 1816 could suggest that regardless of ancestral differences SK 649 was treated as an integrated member of the community. However, the clergy were known to exercise discretion concerning grave location; for, example, in spite of laws forbidding it, even confirmed suicides could be interred within consecrated grounds.Footnote152 Additionally, by the 19th century, St Hilda’s cemetery was beginning to experience severe overcrowding,Footnote153 so the positioning of burials may reflect pragmatic rather than symbolic choices.
DISCUSSION
IDENTIFICATION OF OUTLIERS
As the consistency of dental morphological data collection both within and between recorders has been questioned and studies of ancestry are ethically sensitive,Footnote154 it was important to consider the reliability of the assessed non-metric data. This was achieved by comparing trait frequencies to those found by other researchers and quantifying intra-observer error. After contrasting the trait frequencies found by this project with reference data for a Western Eurasian population,Footnote155 a few notable differences were apparent and are presented in . These could either represent normal variation between populations, or inter-observer disagreement. Though inter-observer error can be pronounced in the recording of dental non-metric traits and make inter-project comparisons inadvisable, it does not necessarily affect the validity of the individual projects.Footnote156 As intra-observer testing in this instance produced an intraclass correlation coefficient regarded as ‘good’ (ICC=0.851), data collection procedures were considered consistent and recorder error appears unlikely to have compromised results.Footnote157 It should be noted though that trait selection will have biased the project’s outcomes. The selection of a large number of supernumerary molar cusps favoured the detection of individuals with a Sundadont or Sub-Saharan African dental complex, both of which are noted for supernumerary cusp retention.Footnote158 Potentially, outliers from different ancestral groups went undetected.
Table 9. Comparison of anomalous trait frequencies in the Coronation Street sample to the Western Eurasian mean.
A novel feature of this study was a customised significance threshold. Although this revealed two significant outliers (SK 358 and SK 649), SK 358’s estimated Western Eurasian ancestry was considered typical for 19th-century South Shields.Footnote159 A simple solution for this instance of Type 1 error could be to reduce this project’s high statistical power (0.986), leading to a more conservative alpha threshold and a lower likelihood of false positives.Footnote160 However, decreasing power may lead to an unacceptably high chance of Type 2 error in an archaeological context.Footnote161 At Hazel Grove’s Wesleyan chapel, for example, a group of skeletons thought to have African affinities were recovered; a grouping like this would cause statistical clustering, rendering such individuals imperceptible with a conservative alpha.Footnote162 Furthermore, it is questionable whether individuals of mixed ancestry, for whom non-metric traits are generally only expressed to an intermediary extent,Footnote163 would be sufficiently different dentally to register as outliers – even though they may have been perceived or self-identified as being distinctive in life.Footnote164 As the biographies of Olaudah Equiano and Sake Deen Mahomed indicate, both men had children with British women; an inability to accommodate admixture is a real limitation of this statistical framework.Footnote165
Overall, it is estimated that 1.2% of the sample are ancestrally distinct (n=1/85), which is congruous with documentary sources from Liverpool approximating that 1.5-2.0% of the population was not British.Footnote166 However, these figures are likely underestimates; for many migrants Britain was a waystation on a journey and cross-sectional cemetery samples and census data cannot fully represent such a dynamic situation.Footnote167 Despite these limitations, a level of success was achieved as an ancestral outlier (SK 649) was identified through an objective procedure which was validated through a multifactorial estimation of ancestry. The further applicability of this method would likely be limited to historic niches where the majority of the population was phenotypically homogenous, outliers were few, and there was little admixture. The identification of individuals whose phenotypic traits lie beyond what could be considered normal within-group variation as ‘outliers’, however, arguably imposes a statistical typology and implies exaggerated differences between groups.Footnote168 Thus, before any attempt is made to further apply this or a similar method, it would be essential to consider the ethical implications.
ANCESTRY ESTIMATION IN THE POST-MEDIEVAL PERIOD
This project highlights the practical benefits of estimating ancestry in several ways. As the case of SK 649 illustrates, estimating ancestry – as opposed to assuming a European affiliation in a historic British context – led to a more precise osteological profile. The more specific age estimate assisted in the interpretation of cortical defects, which could either have been viewed as normal developmental changes or activity-related adaptation dependent upon age.Footnote169 Furthermore, for SK 358 and SK 649, ancestry estimates were made with reference to dental complexes. To achieve this a suite of biological features were assessed, preventing an oversimplified reliance on a small number of traits.Footnote170 These estimates of biological affiliation represented an improvement on the traditional three-group model of African, Asian and European ancestry which has been termed a ‘folk taxonomy’ due to its close correspondence to social categorisations.Footnote171
It should be noted, however, that in the case of SK 358, a stature estimate was made using Trotter’s regression formulae which prompted a categorisation of SK 358 as ‘White.’Footnote172 Though this is common practice,Footnote173 the use of a categorisation imbued with racial overtones did undermine the attempt to produce a more ethically considerate biological profile.Footnote174 The issue was less pronounced in the analysis of SK 649’s remains, as in Southeast Asia attempts have been made to counter-balance the Euro-American focus of many sex, age and stature estimation methodologies.Footnote175 Yet, even here, the final stature estimate was generated for someone of Southeast Asian rather than Sundadont ancestry;Footnote176 though the two designations closely correspond, they are not synonymous.
Perhaps more important is the lack of specificity in estimates based on dental morphology. 19th-century European migrants established communities, businesses and eventually churches in South Shields,Footnote177 thereby actively contributing to social diversity despite being indistinguishable through dental traits. Additionally, upon migration to Britain, German migrants underwent a transformative process; on the Continent they would have belonged to a politically distinct Germanic state, but in Britain they were ‘Germans’ collectively identified through language.Footnote178 It is doubtful that SK 358 and SK 649 ever self-identified or were socially recognised as being of ‘Western Eurasian’ or ‘Sundadont’ ancestry; it is more likely that they distinguished themselves and constructed a sense of self-identity through language and culture. Although an expansion of craniometric databases could offset this lack of synergism – cranial morphology represents a relatively specific bio-geographic and temporal nicheFootnote179 – it has been hypothesised that over the last three centuries humans have been subject to a ‘technophysio evolution’.Footnote180 Potentially, human physiology is now less subject to genetic constraints and biological changes are increasingly dictated by the unprecedented control humans exert on their environment.Footnote181 Secular changes in European skull morphology support this theory,Footnote182 and potentially SK 358’s possible overbite and SK 649’s mandibular dental crowding may both have resulted from the increasingly soft 19th-century diet.Footnote183 As such, post-medieval skull morphology would appear to increasingly reflect human influences rather than biological affinities.Footnote184
In summary, it appears as though teeth, due to their strong genetic control and resistance to external leverages, still offer significant advantages when exploring biological affiliation.Footnote185 However, perceived ancestry was likely influenced by socio-political context and language. As such fluid, contextual aspects of identity would be unidentifiable through unresponsive dental traits, the anthropological value of estimating ancestry is most evident when it is combined with historical and sociological data.Footnote186
ANCESTRY AS AN ELEMENT OF PERSONHOOD
It still remains to be discussed to what extent ancestry may have shaped the life courses of SK 358 and SK 649 and contributed to the formation of the osteological features noted in their remains. Whilst doing this, ancestry will be contrasted with other facets of identity – such as sex, social status, and age – and, with refence to documentary data, the importance of these aspects of personhood will be contextualised in a 19th-century setting.
The traces of traumatic events consistent with intense or prolonged strain were seen in remains of both SK 358 and SK 649,Footnote187 and it was speculated that these were related to employment. As many 19th-century migrants were employed in onerous and dangerous trades, for SK 649 these osteological markers may have been linked to ancestry.Footnote188 However, other aspects of personhood would also have influenced occupation. For instance, social conventions and a lack of educational opportunities in poorer communities forced many to choose a profession that was deemed appropriate for their class – perhaps following peers and close family members.Footnote189 Employment options for most women would have been even more restricted; women were perceived by many to be inherently less able and it was claimed that a man was capable of achieving ‘higher eminence, in whatever he takes up, than woman can attain’.Footnote190 After marriage, in particular, many women would have been expected to remain in the domestic sphere, their personal identity potentially overshadowed by their role as a wife or mother.Footnote191 As it was suggested that SK 358 was of a lower socioeconomic status and SK 649 was female, the development of traumatic lesions associated with activity and occupation may therefore have been influenced by status and sex. In contrast, the hypoplastic defects and cribra orbitalia observed in SK 649 are strong evidence of infant or childhood adversity and suggest that age also played an influential role in a person’s experiences.Footnote192 Again, though age may be relevant in part due to its relation to occupation and work capacity; the diet of dependent offspring in 19th-century British families was generally of very low quality in poorer urban communities, but did improve when the child began to work and contribute to the household income.Footnote193
It is worth considering that age may not have only affected an individual’s life experiences, but also the extent to which those experiences can be embodied. Adult skeletons are far less responsive than the bones of immature individuals,Footnote194 which could mean that more subtle social stressors are less likely to be reflected in the adult skeleton. Similarly, although there is no direct skeletal evidence that unambiguously suggests that SK 649’s status as an ancestral outlier shaped their life, it does not mean that this is the case. Historical texts make plain that the opposite was likely true; in the stratified 19th-century society there was a documented hostility directed towards individuals whose ancestral origins led them to be perceived as the ‘other’.Footnote195 Sources do however show that attacks often collocated characterisations of sex, social class and ancestry; certain ancestral groups were regarded as ‘effeminate,’ while ‘sickly physiques’ became associated with lower-class criminals and non-Europeans.Footnote196 Such language lacks the precisely defined and institutionalised racism seen in other contexts, but arguably demonstrates the pervasive nature of biological determinism – the scientific paradigm that propagated qualitative categorisations regarding ancestry and race as well as sex and social class.Footnote197 The impact such attitudes had are to an extent described by historic sources – Olaudah Equiano’s poignant personal accounts detail the deep psychological wounds suffered that could cause a ‘collapse’ of self-identityFootnote198 – and modern research which has shown that marginalised and ancestrally distinct subgroups are the victims of entrenched health inequalities and barriers to attainment.Footnote199
As such experiences are impossible to generalise, however, it cannot be said to what extent SK 649 was affected by racism. The discussion does highlight though that the study of ancestral diversity in the past cannot be broached without reference to racism and structural inequalities perpetuated by scientific trends. Yet, it is also important to acknowledge that deterministic theories did not always reflect everyday practice. One 19th-century writer travelling in the Tyneside region commented on ‘the singular practice of engaging women as labourers’ which, though he found it to be ‘unfavourable’ and ‘disgraceful’, was an economic necessity in the rapidly expanding industrial region.Footnote200 As such, it may be implied that economic pressures often defined the nature of an individual’s experiences and the importance of a particular aspect of identity; the race-riots in South Shields, for instance, occurred decades after the development of migrant communities, but were coincident with a sharp economic downturn which led to increasingly intense work-place competition.Footnote201
On reflection, confidently drawing out interpretations pertaining to the subtleties of personhood is complex and best achieved by integrating multiple evidentiary strands. This assessment of osteological and historical data exemplifies how social identities are multifaceted, relationally bound and contextually dependent; even though aspects of personhood are theoretically partible, considering them separately and without reference to cultural environment is unrepresentative of social reality.Footnote202 An individual’s experiences would have been shaped by, inter alia, their sex, age, social status and occupation as well as ancestry – or the racialised perceptions of ancestral differences for those whose biological affinities made them distinct.Footnote203 The facet of personhood which was most significant likely shifted over a life course and across social and historical contexts, making generalisations impossible. The interpretation of osteoarchaeological and historical data specific to a 19th-century British industrial context, suggests that the treatment of marginalised groups and individuals in this environment was influenced by a mixture of sometimes competing pressures rooted in deterministic prejudices and socioeconomic necessities.
CONCLUSION
The purpose of this project was to identify and contextualise ancestral diversity whilst critically evaluating associated methodologies. It appeared that the demographic impact of ancestral outliers was relatively small in early to mid-19th century South Shields (1.2%), and the presence of people from non-European backgrounds was likely the result of globally expanding commercial networks.Footnote204 It was further demonstrated that estimating ancestry can improve the accuracy of an individual’s biological profile and assist in the interpretation of palaeopathological lesions.Footnote205 Another salient feature discussed was the malleability of cranial morphology; recent research suggests that osseous adaptations in response to environmental pressures may be more pronounced that previously recognised.Footnote206 Dental morphology was deemed the most effective means of assessing biological affinities due to its resistance to environmental pressures, but with current techniques only broad ancestral affiliations could be estimated – the continued development of quantitative methods does, however, suggest that greater accuracy and precision will be available in the future.Footnote207 It is paramount though that progress is made ethically and does not propagate categorical paradigms or reduce human biological and cultural variation into statistical typologies.Footnote208
The impact ancestral diversity had upon an individual’s life course was much harder to define, partly reflecting the difficulty in discerning cultural nuance from a limited range of osteological reactions.Footnote209 This limitation, however, was mitigated through the inclusion of historical data. By integrating multiple strands of evidence it was possible to explore deterministic perceptions of personhood, investigate reactions to diversity in the Tyneside region, and argue that ancestral affiliation is best considered as one facet of identity, most appropriately understood and contextualised through its intersection with sex, social status, occupation and language.Footnote210 As such, it is proposed that bioarchaeology, which is by its nature interdisciplinary, is in an ideal position to contribute to discussions relating to diversity and the persistent legacy of structural inequalities, especially in historic populations where textual data can inform and supplement research conducted on skeletal remains.Footnote211 Regarding future research, a greater appreciation of diversity in historic Britain could be facilitated by bioarchaeological investigations that compare assemblages recovered from port cities – isotopic analyses that would enable an exploration of geographic origin as well as population mobility may be especially informative.
ABBREVIATIONS
| ASUDAS | = | Arizona State University Anthropology System |
| DJD | = | degenerative joint disease |
| EC | = | entheseal change |
| I | = | incisor |
| LEH | = | linear enamel hypoplasia |
| L | = | lower (e.g. LM1= lower first molar) |
| LDA | = | Linear Discriminant Analysis |
| M | = | permanent molar |
| NNDA | = | Nearest Neighbour Discriminant Analysis |
| SK | = | skeleton |
| U | = | upper (e.g. UM1= upper first molar) |
SUMMARY IN FRENCH, GERMAN, ITALIAN AND SPANISH
RESUME
Une évaluation de la diversité génétique dans les South Shields du XIXe siècle
L’analyse bioarchéologique de restes humains du cimetière de l’église de Sainte- Hilda, South Shields, a été menée afin d’investiguer la diversité génétique dans la Grande-Bretagne postmédiévale. Des évaluations méthodologiques montrent que, lorsque la diversité est étudiée à travers des traits phénotypiques, les affiliations biologiques sont mieux investiguées à travers la morphologie dentaire grâce à sa résistance aux influences exogènes, qu’à travers la forme crânienne. En effet, cette dernière semble être progressivement influencée par des facteurs culturels et environnementaux dans la période postmédiévale. Un modèle quantitatif novateur a été développé dans le cadre d’une analyse au sein du groupe de morphologie dentaire, évaluée par le Système anthropologique dentaire de l’Université de Arizona State. Ce modèle a permis d’identifier avec succès un outlier génétique. Un récit ostéobiographique pour cet individu, combinant ostéologie et données historiques avec une théorie sociale, suggère que le statut de personne est malléable et multifacette. L’ascendance est ainsi mieux appréhendée comme aspect de l’identité, identité qui inclut également le sexe, l’occupation, le statut social et l’affiliation linguistique.
ZUSAMMENFASSUNG
Eine Untersuchung zur „Ancestral Diversity“ in South Shields, U.K., während des 19. Jahrhunderts
Der Artikel behandelt die bioarchäologische Untersuchung nachmittelalterlicher, menschlicher Überreste vom Friedhof der St. Hilda’s Church in South Shields, U.K. In bisherigen methodischen Untersuchungen wird oftmals argumentiert, dass bei der Erforschung der Diversität durch phänotypische Merkmale biologische Zugehörigkeiten aufgrund ihrer Resistenz gegenüber exogenen Einflüssen am besten durch die Zahnmorphologie untersucht werden, während die Schädelform in der nachmittelalterlichen Zeit zunehmend von Umwelt- und Kulturfaktoren beeinflusst zu werden scheint. Für eine Analyse der Zahnmorphologie, die mit dem Dental Anthropology System der Arizona State University durchgeführt wurde, wurde ein neuartiges quantitatives Modell entwickelt, mit dem ein Individuum herausgestellt werden konnte, dass eine andere Herkunft aufweist. Eine osteobiographische Erzählung für dieses Individuum, die osteologische und historische Daten mit Sozialtheorie kombiniert, legt nahe, dass Abstammung formbar und vielfältig ist. Abstammung wird daher am besten als ein Aspekt der Identität verstanden, der auch Geschlecht, Beruf, soziale Stellung und sprachliche Zugehörigkeit umfasst.
RIASSUNTO
Una valutazione della diversità ancestrale nella South Shields del XIX secolo
L’analisi bioarcheologica dei resti umani provenienti dal cimitero di St Hilda’s Church a South Shields, fu condotta con lo scopo di analizzare la diversità ancestrale nella Gran Bretagna post-medievale. Le considerazioni metodologiche suggeriscono che quando la diversità è indagata attraverso i tratti fenotipici, la discendenza biologica si accerta meglio attraverso la morfologia dentale in ragione della sua resistenza alle influenze esogene; la forma del cranio, invece, sembra essere progressivamente influenzata da fattori ambientali e culturali durante il periodo post-medievale. Un nuovo modello quantitativo è stato sviluppato per l’analisi della morfologia dentale all’interno di un gruppo: tramite il Dental Anthropology System della Arizona State University è stato identificato con successo un valore anomalo nel tracciamento ancestrale. Una narrazione basata sulla storia osteologica di questo individuo, che unisca dati osteologici e storici con elementi sociologici, suggerisce che l’individualità è plasmabile e proteiforme. La discendenza è quindi più opportunamente comprensibile come un aspetto dell’identità, che comprende anche il sesso, l’occupazione, lo status sociale e l’identità linguistica.
RESUMEN
Evaluación de la diversidad ancestral en el South Shields del siglo XIX
Se ha realizado un análisis bioarqueológico de los restos humanos del cementerio de la iglesia de Santa Hilda, South Shields, para investigar la diversidad ancestral en la Gran Bretaña temprano-moderna. Las evaluaciones metodológicas argumentan que cuando la diversidad se explora a través de rasgos fenotípicos, las afiliaciones biológicas se investigan mejor a través de la morfología dental por su resistencia a influencias exógenas, mientras que la forma craneal parece estar cada vez más influenciada por factores medioambientales y culturales en el período temprano-moderno. Se ha creado un modelo cuantitativo nuevo para analizar la morfología dental intergrupal, evaluada a través del Sistema de Antropología Dental de la Universidad Estatal de Arizona, gracias al cual se ha identificado con éxito un valor ancestral atípico. La narrativa osteobiográfica de este individuo, combinando datos históricos y osteológicos con la teoría social, sugiere que la personalidad es maleable y multifacética, por lo que es más apropiado entender la ascendencia como un aspecto de la identidad que también incluye sexo, ocupación, estatus social y afiliación lingüística.
The skeletal collection is curated at the Archaeology Department, The University of Sheffield. Department of Archaeology, Minalloy House, Regent Street, Sheffield, S10 2TN. [[email protected]]
ACKNOWLEDGMENTS
This paper is based upon research undertaken in the summer of 2018 as part of a Master’s dissertation project at the Department of Archaeology, University of Sheffield. I would like to acknowledge and thank Dr E. Craig-Atkins for her continued help and guidance throughout the research and writing process. Also, many thanks to Dr S. Newman for advice, organising access to materials and information on unpublished reports. I am further grateful for the constructive feedback offered by two anonymous reviewers and the help of the journal’s editorial team.
Notes
1 Fuller Citation2016; Qureshi Citation2011; Panayi Citation1995; Visram Citation1986.
2 Mahomet Citation1794; CitationEquiano 1789.
3 Newman & Holst Citation2016; Myers 1996; Visram Citation1986.
4 Spradley & Hefner Citation2016; Edgar Citation2009; Smay and Armelagos Citation2000.
5 Jellinghaus et al. 2018; Fogel Citation2004.
6 Blakey Citation2001.
7 McLean Citation2020; Burchard et al. 2003, 1170-1; Mukhopadhyay & Henze Citation2003, 670.
8 Kranioti et al. 2018, 265.
9 CitationCunningham Citation2019; Zack Citation2002, 69; Appiah Citation1996, 73; Konigsberg Citation1990; Lewontin Citation1972.
10 Cunningham Citation2019; Relethford Citation2004, 499.
11 Spradley & Hefner Citation2016; Edgar Citation2009; Ousley et al. 2009; Cavalli-Sforza et al. 1994.
12 McLean Citation2020; McLean Citation2019, 481; Msimang Citation2019, 4; Hochman Citation2017, 62; Ousley et al. 2009, 68; Mallon Citation2007; Appiah Citation2006, 381; Mukhopadhyay & Henze Citation2003, 670; Zack Citation2002, 87-8; Appiah Citation1996.
13 Müller-Wille Citation2014; Gould Citation1981, 66.
14 Watkins Citation2007, 187-188; Gould Citation1981; Broca Citation1877, 191.
15 Gould Citation1981, 417; Darwin Citation1871, 201.
16 Msimang Citation2019, 8; Erasmus Citation2010, 388; Watkins Citation2007, 187-188; Gould Citation1981, 418; Galtung Citation1969; Darwin Citation1871.
17 Margaryan et al. 2020, 392; Ritchie Citation1976, 190.
18 Willmott et al. 2020, 189; Stone and Ozga Citation2019, 183-5; Jellinghaus et al. 2018; Cross & Wright Citation2015, 58; Chatters Citation2017, 24.
19 Jellinghaus et al. 2018; Spradley & Hefner Citation2016.
20 White & Folkens Citation2005, 404.
21 CitationBuikstra & Ubelaker Citation1994, 69.
22 Hefner Citation2009; Edgar Citation2009.
23 Watkins Citation2007, 187-188; Mukhopadhyay & Henze Citation2003, 670; Blakey Citation2001, 411; Gould Citation1981.
24 Howell 1973.
25 Cunningham Citation2019; Kallenberger & Pilbrow Citation2012; Wright Citation2012; Buikstra & Ubelaker Citation1994, 69.
26 Jellinghaus et al. 2018; Sierp & Henneberg Citation2015.
27 Scott & Turner Citation1997; Hillson Citation1996.
28 Scott et al. 2018; Scott & Turner Citation1997; Turner et al. 1991.
29 Hasegawa et al. 2010, 7; Arte et al. Citation2001, 1448.
30 Scott et al. 2018; Scott & Turner Citation1997, 238-42.
31 Hillson Citation1996.
32 Scott et al. 2018; Scott & Turner Citation1997; Alt & Vach Citation1995.
33 Scott et al. 2018; CitationChatters Citation2017; Cross & Wright Citation2015.
34 Ruengdita et al. 2018, 78; Ubelaker & DeGaglia Citation2017; Kondo et al. 2017, 86; Traithepchanapai et al. 2016, 167e4; Gocha Citation2015, 318e3; Green & Curnoe 2009, 529.
35 McLean Citation2019, 481; Blakey Citation2001, 397.
36 Thoreson et al. 2015; Walker & Segal Citation1997.
37 Mallon Citation2007, 103; Appiah Citation2006, 365; Gelman Citation2003, 105; Tyrrell Citation1999.
38 Goodman & Leatherman Citation1998.
39 Pierre Citation2020, 127; Blakey Citation2001, 409.
40 Blakey Citation2001.
41 McLean Citation2020; Edgar Citation2009; Smay & Armelagos Citation2000.
42 Tyrrell Citation1999; Friedlander Citation1992; Ravenstein Citation1885, 199.
43 Myers 1996, 18-37.
44 Myers 1996, 19.
45 Jones-Katz Citation2017, 214; Paul Citation2009; Visram Citation1986; Mahomet Citation1794; CitationEquiano 1789.
46 Ravenstein Citation1885, 196-9.
47 Redford & Chaloner Citation1976, 132-7.
48 Panayi Citation1995, 35.
49 Fuller Citation2016; Myers 1996, 110; Visram Citation1986; Doyle Citation1978, 64; Shyllon Citation1977, 122; George Citation1926, 122; Hughes Citation1855, 5.
50 Myers 1996, 110; Visram Citation1986; Shyllon Citation1977, 122; George Citation1926, 122; Hughes Citation1855, 5.
51 Otele Citation2012, 155-6; Richardson Citation2005, 41; Dresser Citation2001, 9.
52 Otele Citation2012; Richardson Citation2005; Dresser Citation2001, 9.
53 Dresser Citation2001, 81; Visram Citation1986; Hecht Citation1954.
54 Visram Citation1986; Hecht Citation1954.
55 Bashford & McAdam Citation2014, 311.
56 Newman Citation2016; Myers 1996; Panayi Citation1995.
57 Redford & Chaloner Citation1976, 133.
58 Jackman Citation2018, 141-3; Dresser Citation2001; Visram Citation1986, 17.
59 Jackman Citation2018, 141-2; Dresser Citation2001, 62; Visram Citation1986, 17; Hecht Citation1954, 52.
60 Dresser Citation2001; Visram Citation1986, 30-2.
61 Qureshi Citation2011.
62 Teltscher Citation2000; Mahomet Citation1794.
64 Jones-Katz Citation2017; Myers 1996.
65 Qureshi Citation2011; Myers 1996; Visram Citation1986.
66 Hecht Citation1954, 52; Mahomet Citation1794; CitationEquiano 1789.
67 Blakey Citation2001; Rankin-Hill Citation1997; Owsley et al. 1987.
68 Newman Citation2016, 8-10; Eastlake Citation2013, 6; Bland Citation2006, 68.
69 Nolan Citation1998, 33-6.
70 Myers 1996, 22.
71 Bland Citation2006.
72 Byrne Citation1977, 268.
73 Raynor et al. Citation2011, 6.
74 Raynor et al. 2011; CitationBrickley Citation2018, 7.
75 Raynor et al. 2011, 53.
76 Raynor et al. 2011, 44-5; Buckberry & Chamberlain Citation2002; Molleson et al. 1993 Mackenzie Citation1827, 730-5.
77 Raynor et al. 2011, 47.
78 CitationBreeze Citation2006, 115; Surtees Citation1820, 94-104.
79 Newman Citation2016, 69.
80 Raynor et al. 2011.
81 Myers 1996.
82 Raynor et al. 2011, 11; Mackenzie Citation1834, 31.
83 Raynor et al. 2011, 15; Salmon Citation1856, 64.
84 Hasegawa et al. 2010; Arte et al. Citation2001; Scott & Turner Citation1997; Hillson Citation1996.
85 Scott & Turner Citation1997; Turner 1990a.
86 Fuller Citation2016; Myers 1996; Visram Citation1986.
87 Scott & Turner Citation1997; Turner et al. 1991.
88 Scott & Turner Citation1997, 69-73.
89 Fuller Citation2016; Scott & Turner Citation1997, 96; Myers 1996; Turner et al. 1991; Visram Citation1986.
90 Scott & Turner Citation1997; Turner et al. 1991.
91 Ghorbani Citation2019, 588; Elfadaly et al. 2016, 116; Nikita Citation2015; Irish Citation2010; Field Citation2009, 215-7; Leese & Main Citation1994, 309-10; Mahalanobis Citation1936.
92 Ghorbani Citation2019, 588; Elfadaly et al. 2016, 116; Filzmoser et al. 2014; Field Citation2009, 215-7; Leese & Main Citation1994, 309-10; Mahalanobis Citation1936.
93 Hayati Rezvan et al. 2015.
94 Pedersen et al. 2017; Hayati Rezvan et al. 2015; Newman Citation2014.
95 Irish Citation2010; Irish Citation2006, 534; Kruskal & Wish Citation1978.
96 Ghorbani Citation2019, 590; Elfadaly et al. Citation2016, 116; Brereton Citation2015, 10; Field Citation2009, 51; Leese & Main Citation1994, 309.
97 Elfadaly et al. 2016; Field Citation2009: 215-7.
98 Smith Citation2018; CitationCohen Citation1988.
99 Cohen Citation1988, 14.
100 Field Citation2009, 55-8; Scott & Turner Citation1997, 161; Cohen Citation1988, 14.
101 Smith Citation2018.
102 Scott et al. 2018.
103 CitationBlakey Citation2001; Gould Citation1981.
104 Roffey et al. 2018; Hamilakis et al. 2002.
105 Ubelaker Citation1989a; Meindl & Lovejoy Citation1985; Ferembach et al. 1980; Trotter Citation1970.
106 Ubelaker & DeGaglia Citation2017.
107 Scott et al. 2018; Scott & Turner Citation1997, 238-42; Wright Citation2012; Jantz & Ousley Citation2005; Howell 1973.
108 Jellinghaus et al. 2018; Scott & Turner Citation1997, 236; Bland Citation2006, 68.
109 Blakey Citation2001, 411.
110 Klaus Citation2017; Villotte et al. 2016; CitationBuikstra & Ubelaker Citation1994, 107-159.
111 Mays Citation2020, 91-3; Klaus & Lynnerup Citation2019, 81; Klaus Citation2017; Villotte et al. 2016; Ortner Citation2003, 45-63; Buikstra & Ubelaker Citation1994, 107-159.
112 DeWitte & Stojanowski Citation2015, 416-8; Primeau et al. 2015.
113 CitationDeWitte & Stojanowski Citation2015; Wood et al. 1992.
114 Nystrom Citation2014; Zvelebil & Weber Citation2013, 275; Parker Pearson Citation1999, 42-3.
115 Koo & Li Citation2016, 155.
116 Irish Citation2010; Irish Citation2006, 534; Kruskal & Wish Citation1978.
117 Field Citation2009, 55-8; Cohen Citation1988, 14.
118 Mupparapu & Vuppalapati, Citation2005; Loth & Henneberg Citation1996; Meindl & Lovejoy Citation1985.
119 Mays Citation2016; Trotter Citation1970.
120 Raynor et al. 2011, 47.
121 Scott & Turner Citation1997, 236.
122 Scott et al. 2018.
123 Pilloud Citation2018, 14; Mew Citation2014, 555; Ortner Citation2003 598.
124 Scheffel et al. 2014; Lombroso Citation1911, 21; Broca Citation1877, 195.
125 Eastlake Citation2013, 49; Henderson & Walker Citation2012, 796.
126 Van Staa et al. 2001, 517-22.
127 Niinimäki & Baiges Sotos 2013; Knusel 2000.
128 Loth and Henneberg Citation1996; Ferembach et al. Citation1980.
129 Scheuer & Black: 252; Ubelaker Citation1989a; Iscan et al. 1984.
130 Meindl & Lovejoy Citation1985.
131 Raynor et al. 2011, 49; Trotter Citation1970.
132 Scott & Turner Citation1997, 236-52
133 Scott et al. 2018, 23-5.
134 Jantz & Ousley Citation2005.
135 Wright Citation2012.
136 Pilloud Citation2018, 14; Mew Citation2014 555.
137 Howell Citation1996: 172-3.
138 Turner 1990a.
139 Fuller Citation2016; Scott & Turner Citation1997; Visram Citation1986.
140 Kondo et al. 2017, 86; Green & Curnoe 2009, 529; Kean & Houghton Citation1990, 361.
141 Traithepchanapai et al. 2016, 167e4.
142 Ruengdita et al. 2018, 78; Gocha Citation2015, 318e3; Ubelaker Citation1989a; Meindl & Lovejoy Citation1985; Iscan et al. 1984.
143 Gamboa et al. 2011; Mahoney-Swales & Nystrom Citation2009, 34; Ortner Citation2003, 387-8.
144 Primeau et al. 2015.
145 Tsutaya Citation2017; Newman Citation2016; Pooley Citation2013; Beaumont et al. Citation2013; Nitsch et al. 2011.
146 Tsutaya Citation2017; Newman Citation2016; Pooley Citation2013; Beaumont et al. 2013; Nitsch et al. 2011.
147 Villotte & Knusel Citation2013, 138; Blondiaux et al. Citation2012, 226; Waldron Citation2009, 153-4.
148 Villotte & Knusel Citation2013, 138; Blondiaux et al. Citation2012, 226; Waldron Citation2009, 153-4; Rossi & Dragoni Citation2006.
149 Henderson et al. Citation2013b, 197; Niinimaki & Baiges Sotos Citation2013; Rhodes & Knusel Citation2005; Knusel 2000; Mays et al. 1999.
150 Villotte et al. 2016, 53; Gosling et al. Citation2002.
151 Villotte & Knusel Citation2013: 140-1.
152 Cox et al. 1990, 578.
153 Salmon Citation1856.
154 Smay & Armelagos Citation2000; Tyrrell Citation1999, 161.
155 Scott & Turner Citation1997, 323.
156 Tyrrell Citation1999, 161.
157 Koo and Li Citation2016, 155.
158 Scott et al. 2018; Scott & Turner Citation1997; Turner 1990a.
159 Scott et al. 2018; Bland Citation2006.
160 Cohen Citation1988, 14.
161 Field Citation2009, 55-8; Cohen Citation1988, 14.
162 Elfadaly et al. 2016; Newman & Holst Citation2016.
163 L’Abbé et al. 2011; Edgar Citation2009.
164 Aspinall Citation2018; Mahomet Citation1794; CitationEquiano 1789.
165 Myers 1996, 22.
166 Field Citation2009, 784; Myers 1996; Visram Citation1986.
167 Turk Citation2005; Myers 1996; Panayi Citation1995; Visram Citation1986; Doyle Citation1978, 222.
168 McLean Citation2020, 43; Gannet 2001.
169 Villotte et al. 2016, 53.
170 L’Abbé et al. 2011.
171 Spradley & Hefner Citation2016; Edgar Citation2009; Mallon Citation2007, 103; Watkins Citation2007, 187-188; Appiah Citation2006, 367-70; Mukhopadhyay & Henze Citation2003, 670; Smay & Armelagos Citation2000.
172 Trotter Citation1970.
173 Mays Citation2016.
174 Smay & Armelagos Citation2000.
175 Ruengdita et al. 2018; Gocha Citation2015; Green & Curnoe 2009.
176 Traithepchanapai et al. 2016.
177 Panayi Citation1995, 163.
178 Turk Citation2005; Panayi Citation1995; Doyle Citation1978, 222.
179 Larsen Citation1997, 237-8; Buikstra & Ubelaker Citation1994, 69.
180 Fogel Citation2004.
181 Fogel Citation2004, 20-1.
182 Jellinghaus et al. 2018; Jantz & Jantz Citation2016.
183 Pilloud Citation2018.
184 Jellinghaus et al. 2018; Fogel Citation2004; Relethford Citation2004.
185 Hasegawa et al. 2010, 7; Arte et al. 2001, 1448; Hillson Citation1996, 181.
186 CitationBlakey Citation2001.
187 Villotte et al. Citation2016; Waldron Citation2009.
188 Myers 1996; Visram Citation1986.
189 Karlsson & Stanfors Citation2011; Laband & Lentz Citation1983, 478.
190 Gould Citation1981, 418; Darwin Citation1871.
191 Henderson et al. 2013b, 205-6; Pooley Citation2013, 87; Raynor et al. 2011, 108; Hiley Citation1979; Mackenzie Citation1827, 731-2.
192 CitationDeWitte & Stojanowski Citation2015, 423-6; Primeau et al. 2015; Ortner Citation2003, 387-8.
193 Tsutaya Citation2017; Newman Citation2016; Pooley Citation2013; Beaumont et al. 2013; Nitsch et al. 2011.
194 CitationDeWitte & Stojanowski Citation2015; Wood et al. 1992.
195 Erasmus Citation2010, 388; Paul Citation2009; Gould Citation1981; Galtung Citation1969.
196 Gould Citation1981; Lombroso Citation1911.
197 McLean Citation2020, 43; Aspinall Citation2018; Blakey Citation2001; Owsley et al. 1987; Galtung Citation1969.
198 Paul Citation2009, 855; Fanon Citation1986, 154; CitationEquiano 1789, 137.
199 McLean Citation2020; Mendoza et al. 2017; Fullwiley Citation2015, 42-3; Galtung Citation1969.
200 Raynor et al. 2011, 108; Hiley Citation1979; Mackenzie Citation1827, 731-2.
201 Bland Citation2006; Byrne Citation1977, 268.
202 Appuhamilage Citation2017; Appiah Citation2006, 366; Parker Pearson Citation1999, 72-6.
203 Msimang Citation2019; Hochman Citation2017; Mallon Citation2007, 94; Appiah Citation2006, 367.
204 Fuller Citation2016; Doyle Citation1978.
205 Ruengdita et al. 2018; Villotte et al. Citation2016; Mays Citation2016; Gocha Citation2015.
206 Jellinghaus et al. 2018; Jantz & Jantz Citation2016; Fogel Citation2004; Larsen Citation1997, 237-8.
207 Scott et al. Citation2018; Hasegawa et al. 2010; Scott & Turner Citation1997.
208 McLean Citation2020, 43; Spradley & Hefner Citation2016; Edgar Citation2009; Mukhopadhyay & Henze Citation2003, 670; Gannet 2001; Smay & Armelagos Citation2000.
209 Klaus Citation2017.
210 Pierre Citation2020, 127; Appuhamilage Citation2017; Parker Pearson Citation1999, 72-6; Gould Citation1981.
211 Fricke Citation2018; Blakey Citation2001; Rankin-Hill Citation1997; Owsley et al. 1987.
BIBLIOGRAPHY
- Alt. K. W. & Vach, W. 1995, ‘Odontologic kinship analysis in skeletal remains: concepts, methods, and results’, Forensic Sci. Int. 7, 99–113.
- Appiah, K. A. 2006, ‘How to Decide If Races Exist’, Proc. Aristotelian Soc. 106, 365–82.
- Appiah, K. A. 1996, ‘Race, Culture, Identity: Misunderstood Connections’, in Appiah and Gutmann 1996, 30–106.
- Appiah, K. A. & Gutmann, A. 1996, Color Conscious, Princeton: Princeton University Press.
- Appuhamilage, U. M. H. 2017, ‘A Fluid Ambiguity: Individual, Dividual and Personhood’, Asia Pacif. J. Anthropol. 18:1, 1–17.
- Arte, S., Nieminen, P., Apajalahti, S., Haavikko, K., Thesleff, I. & Pirinen, S. 2001, ‘Characteristics of Incisor-Premolar Hypodontia in Families’, J. Dent. Res. 80:5, 1445–50.
- Aspinall, P. J. 2018, ‘How the Use by Eugenicists of Family Trees and Other Genealogical Technologies Informed and Reflected Discourses on Race and Race Crossing during the Era of Moral Condemnation: Mixed-Race in 1920s and 1930s Britain’, Genealogy 2, 21. doi:https://doi.org/10.3390/genealogy2030021
- Barker, D. J. P. 2012, ‘Developmental origins of chronic disease,’ Public Health 126, 185–9.
- Bashford, A. & McAdam, J. 2014, ‘The Right to Asylum: Britain's 1905 Aliens Act and the Evolution of Refugee Law’, Law Hist. Rev. 32:2, 309–50.
- Beaumont, J., Geber, J., Powers, N., Wilson, A., Lee-Thorp, J. & Montgomery, J. 2013, ‘Victims and survivors: stable isotopes used to identify migrants from the Great Irish Famine to 19th century London’, Am. J. Phys. Anthropol. 150:1, 87–98.
- Becker, R. A. & Wilks, A. R. (Original S code); Brownrigg, R. (R version); Minka, T. P. & Deckmyn, A. (Enhancements). 2018, ‘maps: Draw Geographical Maps’, R package version 3.3.0. https://CRAN.R-project.org/package=maps
- Blakey, M. L. 2001, ‘Bioarchaeology of the African Diaspora in The Americas: Its Origins and Scope’, Annu. Rev. Anthropol. 301:1, 387–422.
- Bland, H. 2006, ‘British Eugenics and ‘Race Crossing’: A Study of an Interwar Investigation’, New Formations 60, 66–78.
- Blondiaux, J., Fontaine, C., Demondion, X., Flipo, R-M., Colard, T., Mitchell, P. D., Buzon, M. & Walker, P. 2012, ‘Bilateral fractures of the scapula: Possible archaeological examples of beatings from Europe, Africa and America’, Int. J. Paleopathol. 2:4, 223–30.
- Breeze, D. J. 2006, John Collingwood Bruce’s Handbook to the Roman Wall, Newcastle upon Tyne: John Nichols.
- Brereton, R. G. 2015, ‘The chi squared and multinomial distributions’, J. Chemometrics 29, 9–12.
- Brickley, M. 2018, ‘Compiling a skeletal inventory: articulated inhumed bone’, in Mitchell & Brickley 2018, 7–9.
- Broca, P. 1877, ‘Translation of the Greater Part of the Address Delivered by M. Broca, President, at the Opening Meeting of the French Association for the Advancement of the Sciences, at the Havre Congress’, J. Anthropol. Inst. Gr. Brit. Ir. 7, 187–200.
- Buckberry, J. L. and Chamberlain, A. T. 2002, ‘Age estimation from the auricular surface of the ilium a revised method’, Am. J. Phys. Anthropol. 119, 231–9.
- Buikstra, J. E. (ed) 2019, Ortner’s Identification of Pathological Conditions in Human Skeletal Remains 3, London: Academic Press.
- Buikstra J. E. & Ubelaker D.H. 1994, Standards for Data Collection from Human Skeletal Remains, Arkansas: Twelfth Printing 2010.
- Burchard, E. G., Ziv, E., Coyle, N., Gomez, S. L., Tang, H., Karter, A. J., Mountain, J. L., Perez-Stable, E. J., Sheppard, D. & Risch, N. 2003, ‘The Importance of Race and Ethnic Background in Biomedical Research and Clinical Practice’, New Engl. J. Med. 348, 1170–5.
- Byrne, D. 1977, ‘The 1930 'Arab Riot' in South Shields: A Race Riot That Never Was’, Race and Class 18:3, 261–77.
- Cavalli-Sforza, L. L., Menozzi, P. & Piazza, A. 1994, ‘The History and Geography of Human Genes’, Princeton: Princeton University Press.
- Chatters, J. C. 2017, ‘Making archaeological sense of Kennewick Man’, Q. Int. 444, 83–97.
- Cohen, J. 1988, Statistical power analysis for the behavioral sciences. Second Edition, Hillsdale: New Jersey.
- Cox, M. & Mays, S. (eds), 2000. Human Osteology in Archaeology and Forensic Science, London: Greenwich Medical Media Ltd.
- Cox, M., Molleson, T. & Waldron, T. 1990, ‘Preconception and perception: The lessons of a 19th century suicide’, J. Archaeol. Sci. 17:5, 573–81.
- Cross, P. J. & Wright, R. 2015, ‘The Nikumaroro bones identification controversy: First-hand examination versus evaluation by proxy- Amelia Earhart found or still missing?’, J. Archaeol. Sci.: Reps. 3, 52–9. doi:https://doi.org/10.1016/j.jasrep.2015.05.015
- Cunningham, A. 2019, ‘Cranial morphological distribution of African descent peoples as reflectors of migration, variation, and race construction’, Barbados: The International Association for Caribbean Archaeology Conference.
- Darwin, C. 1871, The Descent of Man: And Selection in Relation to Sex, London: J. Murray.
- DeWitte, S. N. & Stojanowski, C. M. 2015, ‘The Osteological Paradox 20 Years Later: Past Perspectives, Future Directions’, J. Archaeol. Res. 23, 397–450.
- Doyle, W. 1978, The Old European Order 1660-1800. Second Edition, Oxford: Oxford University Press.
- Dresser, M. 2001, Slavery Obscured: The Social History of the Slave Trade in an English Provincial Port, London: Bloomsbury.
- Eastlake, L. 2013, ‘Dental health in 18th and 19th Century Britain: A Comparative Analysis of the Coronation Street, Newcastle and St Bride’s Church, London Assemblages’, Master’s Thesis, University of Sheffield.
- Edgar, H. 2009, ‘Biohistorical Approaches to ‘‘Race’’ in the United States: Biological Distances Among African Americans, European Americans, and Their Ancestors’, Am. J. Phys. Anthropol. 139, 58–67.
- Elfadaly, F. G., Garthwaite, P. H. and Crawford, J. R. 2016, ‘On point estimation of the abnormality of a Mahalanobis index’, Comput. Stat. Data Anal. 99, 115–30.
- Equiano, O. 1789, The Interesting Narrative of the Life of Olaudah Equiano, University of Illinois: Project Gutenberg.
- Erasmus, Z. 2010, ‘Contact Theory: Too Timid for “Race” and Racism’, J Soc. Issues 66:2, 387–400.
- Fanon, F. 1986, Black skin, White masks. London: Pluto Press.
- Ferembach, D., Schwidetzky, I. & Stloukal, M. 1980, ‘Recommendations for age and sex diagnoses of skeletons’, J. Hum. Evol. 9, 517–49.
- Field, A. 2009, ‘Discovering Statistics Using SPSS, Third Edition’, London: SAGE.
- Filzmoser, P., Ruiz-Gazen, A. & Thomas-Agnan, C. 2014, ‘Identification of local multivariate outliers’, Springer 55:1, 29–47.
- Fogel, R. 2004, The Escape from Hunger and Premature Death, 1700–2100: Europe, America, and the Third World (Cambridge Studies in Population, Economy and Society in Past Time), Cambridge: Cambridge University Press.
- Fricke, F. J. 2018, ‘Slavery in the Dutch Caribbean: a case for the use of qualitative data in sensitive archaeological contexts’, Washington: Society for American Archaeology Conference.
- Friedlander, D. 1992, ‘Occupational Structure, Wages, and Migration in Late Nineteenth-Century England and Wales’, Econ. Dev. Cult. Change 40:2, 295–318.
- Friedlander, D., Schellekens, J., Ben-Moshe, E. & Keysar, A. 1995, ‘Socio-Economic Characteristics and Life Expectancies in Nineteenth-Century England: A District Analysis’, Pop. Stud. 39:1, 137–51.
- Fuller, J. 2016, ‘Dark paradise: Pacific Islands in the nineteenth-century British imagination’, Edinburgh: Edinburgh University Press.
- Fullwiley, D. 2015, ‘Race, genes, power’, Brit J. Sociol. 66:1, 36–45.
- Galtung, J. 1969, ‘Violence, Peace and Peace Research’, J. Peace Res. 6:3, 167–91.
- Gamboa, M. I., Navonea, N. T., Orden, A. B., Torres, M. F., Castro, L. E. & Oyhenart, E. E. 2011, ‘Socio-environmental conditions, intestinal parasitic infections and nutritional status in children from a suburban neighborhood of La Plata, Argentina’, Acta Trop. 118:3, 184–9.
- Gannett, L. 2001, ‘Racism and Human Genome Diversity Research: The Ethical Limits of “Population Thinking”’, Phil. Sci 68:S3, S479–S492.
- Gelman, S. 2003, The Essential Child, New York: Oxford University Press.
- George, M. D. 1926, London Life in the Eighteenth Century, London: Penguin.
- Gocha, T. P., Ingvoldstad, M. E., Kolatorowicz, A., Cosgriff-Hernandez, M-T. J. & Sciulli, P. W. 2015, ‘Testing the applicability of six macroscopic skeletal aging techniques on a modern Southeast Asian sample’, Forensic Sci. Int. 249, 318.e1–318.e7.
- Goodman, A. H. & Leatherman, T. L. 1998, Building a New Biocultural Synthesis: Political-Economic Perspectives on Human Biology, Ann Arbor: University of Michigan Press.
- Ghorbani, H. 2019, ‘Mahalanobis Distance and its Applicaton for Detecting Multivariate Outliers’, Ser. Math. Inform. 34:3, 583–95.
- Gosling, J. A., Harris, P. F., Whitmore, I. & Willan, P. L. T. 2002, Human Anatomy: Colour Atlas and Text, Amsterdam: Elsevier Limited.
- Gould, S. J. 1981. The Mismeasure of Man. New York: Norton.
- Gowland, R. L. 2015, ‘Entangled Lives: Implications of the Developmental Origins of Health and Disease Hypothesis for Bioarchaeology and the Life Course’, Am. J. Phys. Anthrop. 158, 530–40.
- Green, H. & Cunroe, D. 2009, ‘Sexual dimorphism in Southeast Asian crania: A geometric morphometric approach’, J. Comp. Hum. Biol. 60, 517–34.
- Hasegawa, Y., Rogers, J., Scriven, G. & Townsend, G. C. 2010, ‘Carabelli Trait in Australian Twins: Reliability and Validity of Different Scoring Systems’, Dent. Anthropol. 23, 7–15.
- Haswell, G. H. 1895, ‘The Maister’: A Century of Tyneside Life, London: Walter Scott.
- Hayati Rezvan, P., Lee, K. J. & Simpson, J. A. 2015, ‘The rise of multiple imputation: A review of the reporting and implementation of the method in medical research data collection, quality, and reporting’, BMC Med. Res. Method. 15, 1.
- Hecht, J. J. 1954, Continental and Colonial Servants in Eighteenth Century England, Massachusetts: Department of History, Smith College.
- Hefner, J. T. 2009, ‘Cranial Nonmetric Variation and Estimating Ancestry’, J. Forensic Sci. 54:4, 985–95.
- Henderson, C. Y., Craps, D. D., Caffell, A. C., Millard A. R. & Gowland, R. 2013b, ‘Occupational Mobility in 19th Century Rural England: The Interpretation of Entheseal Changes’, Int. J. Osteoarchaeol. 23, 197–210.
- Henderson, M. & Walker, D. 2012, ‘Smoking may seriously affect your skeleton’, Lancet 379:9818, 796–7.
- Hiley, M. 1979, Victorian Working Women, New York: Moyer Bell Limited.
- Hillson, S. W. 1996, Dental Anthropology, Cambridge: Cambridge University Press.
- Hochman, A. 2017, ‘Replacing Race: Interactive Constructionism about Racialized Groups’, Ergo 4:3, 61–92.
- Howell, D. L. 1996, ‘Ethnicity and Culture in Contemporary Japan’, J. Contemp. His. 31:1, 171–90.
- Howells, W. W. 1973, Cranial Variation in Man, Cambridge: Peabody Museum.
- Hughes, R. M. 1855, The Laws Relating to Lascars and Asiatic Seamen Employed in the British Merchant Services or Brought to the United Kingdom in Foreign Vessels, London: Smith, Elder.
- Irish, J. D. 2010, ‘The Mean Measure of Divergence: Its Utility in Model-Free and Model-Bound Analyses Relative to the Mahalanobis D2 Distance for Nonmetric Traits’, Am. J. Hum. Biol. 22, 378–95.
- Irish, J.D. 2006, ‘Who Were the Ancient Egyptians? Dental Affinities Among Neolithic Through Postdynastic Peoples’, Am. J. Phys. Anthropol. 129, 529–43.
- İşcan, M. Y. Loth, S. R. & Wright, R. K. 1984, ‘Metamorphosis at the sternal rib end: A new method to estimate age at death in white males’, Am. J. Phys. Anthropol. 65, 147–56.
- Jackman, A. 2018, ‘Judging a Judge: A Reappraisal of Lord Mansfield and Somerset’s Case’, J. Leg. Hist. 39:2, 140–56.
- Jantz, R. L. & Jantz, L. M. 2016, ‘The Remarkable Change in Euro-American Cranial Shape and Size’, Hum. Biol. 88:1, 56–64.
- Jantz, R. L. & Ousley, S. D. 2005, FORDISC 3.1 Personal Computer Forensic Discriminant Functions. Knoxville: The University of Tennessee.
- Jellinghaus, K., Hoeland, K., Hachmann, C., Prescher, A., Bohnert, M. & Jantz, R. 2018, ‘Cranial secular change from the nineteenth to the twentieth century in modern German individuals compared to modern Euro-American individuals’, Int. J. Leg. Med. 132, 1477–1484.
- Jones-Katz, G. 2017, ‘“I am two distinct being”: Paul de Man’s authenticating project’, Rethinking Hist. 21:2, 213–34.
- Kallenberger, L & Pilbrow, V. 2012, ‘Using CRANID to test the population affinity of known crania’, J. Anat. 221, 459–64.
- Karlsson, T., & Stanfors, M. 2011, ‘In the footsteps of their fathers? Occupational following among Swedish tobacco workers’, Continuity and Change 26:1, 45–68.
- Kean, M. R. & Houghton, P. 1990, ‘Polynesian Face and Dentition: Functional Perspective’, Am. J. Phys. Anthropol. 82, 361–70
- Kelley, M. A. & Larsen, C. S. (eds), Advances in Dental Anthropology, New York: Wiley-Liss.
- Klaus, H. D. & Lynnerup, N. 2019, ‘Abnormal Bone: Considerations for Documentation, Disease Process Identification, and Differential Diagnosis’, in Buikstra 2019, 59–87.
- Klaus, H. D. 2017, ‘Paleopathological rigor and differential diagnosis: Case studies involving terminology, description, and diagnostic frameworks for scurvy in skeletal remains’, Int. J. Paleopathol. 19, 96–110. doi:https://doi.org/10.1016/j.ijpp.2015.10.002
- Knüsel, C. 2000, ‘Bone adaptation and its relationship to physical activity in the past’, in Cox & Mays, 381–402.
- Kondo, O., Fukase, H. & Fukumoto, T. 2017, ‘Regional variations in the Jomon population revisited on craniofacial morphology’, Anthropol. Sci. 125:2, 85–100.
- Konigsberg, L. W. 1990, ‘Analysis of Prehistoric Biological Variation under a Model of Isolation by Geographic and Temporal Distance’, Hum. Biol. 62, 49–70.
- Koo, T. K. & Li, M. Y. 2016, ‘A Guideline of Selecting and Reporting Intraclass Correlation Coefficients for Reliability Research’, J. Chiro. Med. 15:2, 155–63.
- Kranioti, E. F., García-Donas, J. G., Can, I. O. & Ekizoglu, O. 2018, ‘Ancestry estimation of three Mediterranean populations based on cranial metrics’, Forensic Sci. Int. 286, 265.e1–265.e8.
- Kruskal, J. B. & Wish, M. 1978, Multidimensional Scaling, Newbury Park: Sage.
- Laband, D. & Lentz, B. 1983, ‘Like Father, Like Son: Toward an Economic Theory of Occupational Following’, Southern Econ. J. 50:2, 474–93.
- L’Abbé, E. N., Van Rooyen, C., Nawrocki, S. P. & Becker, P. J. 2011, ‘An evaluation of non-metric cranial traits used to estimate ancestry in a South African sample’, Forensic Sci. Int. 209:1, 195.e1–195.e7.
- Larsen, C. S. 1997, Bioarchaeology. Interpreting behaviour from the human skeleton, Cambridge: Cambridge University Press.
- Leese, M. N. & Main, P. L. 1994, ‘The Efficient Computation of Unbiased Mahalanobis Distances and their Interpretation in Archaeometry’, Archaeometry 36:2, 307–16.
- Lewis, M. E. & Clegg, M. (eds), 2009. Proceedings of the Ninth Annuaul Conference of the British Association of Biological Anthropologists and Osteoarchaeologists, Oxford: BAR.
- Lewontin, R. C. 1972, ‘The apportionment of human diversity’, Evol. Biol. 6, 381–98.
- Lombroso, C. 1911, Crime: Its causes and remedies Boston: Little, Brown and Company.
- Loth, S. R. & Henneberg, M. 1996, ‘Mandibular ramus flexure: a new morphological indicator of sexual dimorphism in the human skeleton’, Am. J. Phys. Anthropol. 99, 473–85.
- Mackenzie, E. 1834, A historical, topographical and descriptive view of the County Palatine of Durham, 1, Durham: Mackenzie and Dent.
- Mackenzie, E. 1827, A descriptive and historical account of the town and country of Newcastle including the borough of Gateshead, Newcastle: Mackenzie and Dent.
- Mahalanobis, P. C. 1936, ‘On the generalized distance in statistics’, Proc. Nat. Inst. Sci. Ind. 2, 49–55.
- Mahomet, S. D. 1794, The Travels of Dean Mahomet, Cork: J. Connor.
- Mahoney-Swales, D. & Nystrom, P. 2009, ‘Skeletal Manifestations of Non-Adult Scurvy from Early Medieval Northumbria: The Black Gate Cemetery, Newcastle-upon-Tyne’, in Lewis & Clegg, 31–41.
- Mallon, R. 2007, ‘A Field Guide to Social Construction’, Phil. Compass 2:1, 9308.
- Margaryan, A., Lawson, D. J., & Sikora, M. et al. 2020, ‘Population genomics of the Viking world’, Nature 585, 390–6.
- Mays, S. 2020, ‘A dual process model for paleopathological diagnosis’, Int. J. Paleopath. 31, 89–96.
- Mays, S. 2016, ‘Estimation of stature in archaeological human skeletal remains from Britain’, Am. J. Phys. Anthropol. 161, 646–55.
- Mays, S., Steele, J. & Ford, M., 1999, ‘Directional asymmetry in the human clavicle’, Int. J. Osteoarchaeol. 9, 18–28.
- McLean, S. A. 2020, ‘Social Constructions, Historical Grounds’, Prac. Anthropol. 40:3, 40–4.
- McLean, S. A. 2019, ‘Social Problems, Structural Issues, and Unsettling Science’, American Anthropologist 121:2, 480–1.
- Meindl, R. S. & Lovejoy, C. O. 1985, ‘Ectocranial suture closure: a revised method for the determination of skeletal age at death based on the lateral-anterior sutures’, Am. J. Phys. Anthropol. 68, 57–66.
- Mendoza, N. B., Mordeno, I. G., Latkin, C. A. & Hall, B. J. 2017, ‘Evidence of the paradoxical effect of social network support: A study among Filipino domestic workers in China’, Psych. Res. 255, 263–71. doi:https://doi.org/10.1016/j.psychres.2017.05.037
- Mew, M. 2014, ‘Craniofacial dystrophy. A possible syndrome?’, Brit. Dent. J. 216:10, 555–8.
- Mitchell, P. D & Brickley, M. 2018, Updated Guidelines to the Standards for Recording Human Remains, Chartered Institute for Archaeologists/British Association of Biological Anthropology and Osteoarchaeology, Institute of Field Archaeologists.
- Molleson, T., Cox, M., Waldron, H. A. & Whittaker, D. K. 1993, The Spitalfields Project, Volume 2. The Anthropology: The Middling Sort, Counc. Brit. Archaeol. Res. Reps. 86.
- Msimang, P. 2019, ‘Racializing Races: The Racialized Groups of Interactive Constructionism Do Not Undermine Social Theories of Race’, Ergo 6:1, 1–30.
- Müller-Wille, S. 2014, ‘Race and History’, Sci. Techn. Hum. Values 39:4, 597–606.
- Mukhopadhyay, C. & Henze, R. C. 2003, ‘Using Anthropology to Make Sense of Human Diversity’, Phi Delta Kappan 84:9, 669–78.
- Mupparapu, M. & Vuppalapati, A. 2005, ‘Ossification of laryngeal cartilages on lateral cephalometric radiographs’, Angle Ortho. 75:2, 196–201.
- Myers, N. 2004, Reconstructing the Black past: Blacks in Britain, 1780-1830, London: Routledge.
- Newman, S. L. 2016, The Growth of a Nation: Child health and development in the Industrial Revolution in England, c. AD 1750-1850, Durham theses: Durham University. Available at Durham E-Theses Online: http://etheses.dur.ac.uk/11508/
- Newman, S. & Holst, M. 2016, Osteological Analysis, Chapel Street. Hazel Grover, Greater Manchester. York Osteoarchaeology, Unpublished Report: No 2116.
- Newman, D. A. 2014, ‘Missing Data: Five Practical Guidelines’, Orig. Res. Methods 17:4, 372–90.
- Niinimaki, S. & Baiges Sotos, L. 2013, ‘The Relationship Between Intensity of Physical Activity and Entheseal Changes on the Lower Limb’, Int. J. Osteoarchaeol. 23, 221–8.
- Nikita, E. 2015, ‘A critical review of the Mean Measure of Divergence and Mahalanobis distances using artificial data and new approaches to the estimation of biodistances employing nonmetric traits’, Am. J. Phys. Anthropol. 157, 284–94.
- Nitsch, E. K., Humphrey, L. T. & Hedges, R. E. M. 2011, ‘Using stable isotope analysis to examine the effect of economic change on breastfeeding practices in Spitalfields, UK’, Am. J. Phys. Anthropol. 146, 619–28.
- Nolan, J. 1998, The Newcastle Infirmary at the Forth, Newcastle upon Tyne. Volume 1: The archaeology and history. Sheffield: Archaeological Research and Consultancy at the University of Sheffield.
- Nystrom, K. C. 2014, ‘The Bioarchaeology of Structural Violence and Dissection in the 19th-Century United States’, Am. Anthropol. 116:4, 765–79.
- Ortner, D. J. 2003, ‘Identification of Pathological Conditions in Human Skeletal Remains’, San Diego: Academic Press.
- Otele, O. 2012, ‘Bristol, slavery and the politics of representation: the Slave Trade Gallery in the Bristol Museum’, Soc. Semiotics 22:2, 155–72.
- Ousley, S., Jantz, R. & Freid, D. 2009, ‘Understanding Race and Human Variation: Why Forensic Anthropologists are Good at Identifying Race’, Am. J. Phys. Anthropol. 139, 68–76.
- Owsley, D. W., Orser, C. E., Mann, R. W., Moore‐Jansen, P. H. & Montgomery, R. L. 1987. ‘Demography and pathology of an urban slave population from New Orleans’, Am. J. Phys. Anthropol. 74:2, 185–97.
- Panayi, P. 1995, German Immigrants in Britain during the 19th Century, 1815-1914, Oxford: Berg Publishing Limited.
- Parker Pearson, M. 1999, The Archaeology of Death and Burial, Stroud: Sutton.
- Paul, P. 2009, ‘“I Whitened My Face, That They Might Not Know Me”: Race and Identity in Olaudah Equiano's Slave Narrative’, J. Black Stud. 39:6, 848–64.
- Pedersen, A. B., Mikkelsen, E., Cronin-Fenton, D., Kristensen, N., Pham, T. M., Pedersen, L. & Petersen, I. 2017, ‘Missing data and multiple imputation in clinical epidemiological research’, Clin.l Epidemiol. 9, 157–66.
- Pierre, J. 2020, ‘African Diaspora Studies and the Lost Promise of Afrocentrism’, Transforming Anthropol. 28:2, 125–8.
- Pilloud, M. A. 2018, ‘Technical Note: The Definition of New Dental Morphological Variants Related to Malocclusion’, Dent. Anthropol. 31:1, 10–18.
- Pooley, S. 2013, ‘Parenthood, child-rearing and fertility in England, 1850–1914’, Hist. Family 18:1, 83–106.
- Primeau, C., Arge, S. O., Boyer, C. & Lynnerup, N. 2015, ‘A test of inter- and intra-observer error for an atlas method of combined histological data for the evaluation of enamel hypoplasia’, J. Archaeol. Sci.: Rep 2, 384–8.
- Qureshi, S. 2011, Peoples on parade: exhibitions, empire, and anthropology in nineteenth century Britain, Chicago and London: University of Chicago Press.
- Rankin-Hill, L. 1997, A Biohistory of Nineteenth-Century Afro-Americans: The Burial Remains of a Philadelphia Cemetery, Westport: Bergin and Garvey
- Ravenstein, E. G. 1885, ‘The Laws of Migration’, J. Stat. Soc. London 48:2, 167–235.
- Raynor, C., McCarthy, R. & Clough, S. 2011, Coronation Street, South Shields, Tyne And Wear. Archaeological Excavation and Osteological Analysis Report, Oxford Archaeology North.
- Redford, A. & Chaloner, W. H. 1976, Labour Migration in England 1800-1850, Manchester: Manchester University Press.
- Relethford, J. H. 2004, ‘Global Patterns of Isolation by Distance Based on Genetic and Morphological Data’, Hum. Biol. 76:4, 499–513.
- Rhodes, J. A. & Knusel, C. J. 2005, ‘Activity-Related Skeletal Change in Medieval Humeri: Cross-Sectional and Architectural Alterations’, Am. J. Phys. Anthropol. 28, 536–46.
- Richardson, D. 2005, ‘Slavery and Bristol's ‘golden age’’, Slavery & Abolition 26:1, 35–54.
- Ritchie, A. 1976, ‘Excavation of Pictish and Viking-age farmsteads at Buckquoy, Orkney’, Society of Antiquaries of Scotland 108, 174–227.
- Roberts, C. A. & Cox, M. 2003, Health and Disease in Britain. From Prehistory to the Present Day, Stroud: Sutton.
- Roffey, S., Tucker, K., Filipek-Ogden, K., Montgomery, J., Cameron, J. & O’Connell, T. 2017, ‘Investigation of a Medieval Pilgrim Burial Excavated from the Leprosarium of St Mary Magdalen Winchester, UK’, PLoS Negl. Trop. Dis. 11:1, e0005186.
- Rossi, F. & Dragoni, S. 2006, ‘Osteochondrosis dissecans of the shoulder glenoid fossa diagnosed in four throwing athletes’, J Sports Med Phys Fitness 46:1, 111–5.
- Ruengdita, S., Prasitwattanasereea, S., Mekjaideea, K., Sinthubuaa, A. & Mahakkanukrauh, P. 2018, ‘Age estimation approaches using cranial suture closure: A validation study on a Thai population’, J. Forensic Leg. Med. 53, 79–86.
- Salmon, T. 1856. South Shields: its past, present and future! South Shields: H Hewelson.
- Scheffel, D. L.S., Jeremias, F., Fragelli, C. M. B., Dos Santos-Pinto, L. A. M., Hebling, J. and de Oliveira, O. B. Jr. 2014, ‘Esthetic dental anomalies as motive for bullying in schoolchildren’, Eur J Dent 8:1, 124–8.
- Scheuer, L. & Black, S. 2000, Developmental Juvenile Osteology. London: Academic Press.
- Scott, G. R., Pilloud, M. A., Navega, D., d’Oliveira Coelho, J., Cunha, E. & Irish, J. D 2018, ‘rASUDAS. A New Web-Based Application for Estimating Ancestry from Tooth Morphology’, Forensic Anthropol 1:1, 18–31.
- Scott, G. R. & Turner, C. G. 1997, The anthropology of modern human teeth. Dental morphology and its variation in recent human populations, Cambridge: Cambridge University Press.
- Shyllon, F. O. 1977, Black People in Britain, Oxford: Oxford University Press.
- Sierp, I. & Henneberg, M. 2015, ‘Can ancestry be consistently determined from the skeleton?’, Anthropol. Rev. 78:1, 21–31.
- Smay, D. B. & Armelagos, G. J. 2000, ‘Galileo Wept: A Critical Assessment of the Use of Race in Forensic Anthropology’, Transforming Anthropol. 9:2, 19–40.
- Smith, R. J. 2018, ‘The continuing misuse of null hypothesis significance testing in biological anthropology’, Am. J. Phys. Anthropol. 166, 236–45.
- Spitalfields Life. 2013, Cruikshank’s London Almanack, 1838 [Online] available from: http://spitalfieldslife.com/2013/08/13/cruikshanks-london-almanack-1838/ [17/08/2019]
- Spradley, M. K & Hefner, J. T. 2016, ‘Using Non-metric Traits to Estimate Ancestry in the 21st Century’, Am. J. Phys. Anthropol. 159:62, 299.
- Stone, A. C. & Ozga, A. T. 2019, ‘Ancient DNA in the Study of Ancient Disease’, in Buikstra 2019, 183–210.
- Surtees, R. 1820, The history and antiquities of the County Palatine of Durham. Chester Ward, London: Nichols.
- Teltscher, K. 2000, ‘The Shampooing Surgeon and the Persian Prince: Two Indians in Early Nineteenth-century Britain’, Intervent. Int. J. Postcolonial Stud. 2:3, 409–23.
- Thoreson, C. K., Chung, S. T., Ricks, M., Reynolds, J. C., Remaley, A. T., Periwal, V., Li, Y. & Sumner, A. E. 2015, ‘Biochemical and clinical deficiency is uncommon in African immigrants despite a high prevalence of low vitamin D: the Africans in America study’, Osteoporos Int. 26, 2607–15.
- Traithepchanapai, P., Mahakkanukrauh, P. & Kranioti, E. F. 2016, ‘History, research and practice of forensic anthropology in Thailand’, Forensic Science International 261, 167.e1–167.e6.
- Trotter, M. 1970, Estimation of stature from intact long limb bones. In T. D. Stewart (eds). Personal identification in mass disasters, Washington D. C.: Smithsonian Institution Press. Pp. 71–83.
- Tsutaya, T. 2017, ‘Post-weaning diet in archaeological human populations: A meta-analysis of carbon and nitrogen stable isotope ratios of child skeletons’, Am. J. Phys. Anthropol. 64, 546–57.
- Turk, E. L. 2005, ‘Germans in Kansas’, Kansas Hist. J. Central Plains 28, 44–71.
- Turner, C. G., Nichol, C. R., & Scott, G. R. 1991, ‘Scoring procedures for key morphological traits of the permanent dentition: The Arizona State University Dental Anthropology System’, in Kelley & Larsen, 13–31.
- Turner, C. G. 1990, ‘Major features of Sundadonty and Sinodonty, including suggestions about East Asian microevolution, population history, and late Pleistocene relationships with Australian aboriginals’, Am. J. Phys. Anthropol. 82, 295–317. doi:https://doi.org/10.1002/ajpa.1330820308
- Tyrrell, A. 1999. Human Skeletal Variation and the Assessment of Population Diversity: An Analysis of the Relationships and Dynamics among Early Medieval Populations from the Southern British Isles. Ph.D. Thesis, University of Sheffield.
- Ubelaker, D. H. & DeGaglia, C. M. 2017, ‘Population variation in skeletal sexual dimorphism’, Forensic Sci. Int. 278, 407e1–407e7.
- Ubelaker, D. H. 1989a, Human Skeletal Remain. Second Edition, Washington: Taraxacum Press.
- Van Staa, T. P., Denison, E. M., Leufkens, H. G. M. & Cooper, C. 2001, ‘Epidemiology of fractures in England and Wales’, Bone 29, 517–22.
- Villotte, S., Assis, S., Cardoso, F. Alves., Henderson, C. Y., Mariotti, V., Milella, M., Pany-Kucera, D., Speith, N., Wilczak, C. A. & Jurmain, R. 2016, ‘In search of consensus: Terminology for entheseal changes (EC)’, Int. J. Paleopathol. 13, 49–55.
- Villotte, S. & Knusel, C. 2013, ‘Understanding Entheseal Changes: Definition and Life Course Changes’, Int. J. Osteoarchaeol. 23:2, 135–46.
- Visram, R. 1986, Ayahs, Lascars and Princes, London: Pluto Press.
- Waldron, T. 2009, Palaeopathology, Cambridge: Cambridge University Press.
- Walker, A. R. P. & Segal, I. 1997, ‘Determining precise role of ethnicity in disease will be difficult’, Brit. Med. J. 315, 1309.
- Watkins, R. J. 2007, ‘Knowledge from the Margins: W. Montague Cobb's Pioneering Research in Biocultural Anthropology’, Am. Anthropol. 109:1, 186–96.
- White, T. D. & Folkens, P. A. 2005, The Human Bone Manual, San Diego: Academic Press.
- Whittal, A. 2014. Map showing the Asian Range of Sundadonty (blue) and Sinodonty (yellow), available at http://patagoniamonsters.blogspot.com/2014/08/kennewick-man-ainus-and-sunda.html (Last accessed 28/07/2018).
- Willmott, H., Townend, P., Mahoney Swales, D., Poinar, H., Eaton, K. & Klunk, J. 2020, ‘A Black Death mass grave at Thornton Abbey: the discovery and examination of a fourteenth-century rural catastrophe’, Antiquity 94:373, 179–96. doi:https://doi.org/10.15184/aqy.2019.213
- Wood, J. W., Milner, G. R., Harpending, H. C., & Weiss, K. M. 1992, ‘The Osteological Paradox: Problems of inferring prehistoric health from skeletal samples’, Current Anthropol. 33, 343–70.
- Wright, R. 2012, Guide to using the CRANID programs Cr6bInd: for linear and nearest neighbours discriminant analysis, available at http://www.box.net/shared/static/-qyaq6thdds.pdf (Last accessed 16/06/2018).
- Zack, N. 2002, Philosophy of Science and Race, New York: Routledge.
- Zvelebil, M. & Weber, A. W. 2013, ‘Human bioarchaeology: Group identity and individual life histories’, J. Anthropol Archaeol. 32:3, 275–9.