
ABSTRACT
Declassified CORONA satellite imagery, collected from 1960–1972 as part of the world’s first intelligence satellite program, provides nearly global, high-resolution, stereo imagery that predates many of the land-use changes seen in recent decades, and thus has proven to be an immensely valuable resource for archaeological research. While challenges involved in spatially correcting these unusual panoramic film images has long served as a stumbling block to researchers, an online tool called “Sunspot” now offers a straightforward process for efficient and accurate orthorectification of CORONA, helping to unlock the potential of this historical imagery for global-scale archaeological prospection. With these new opportunities come significant new challenges in how best to search through large imagery datasets like that offered by CORONA. In contrast to currently popular trends in archaeological remote sensing that seek to employ either automated, machine learning-based approaches, or alternatively, crowd-sourced approaches to assist in the identification of ancient sites and features, this paper argues for systematic, intensive, and expert-led “brute force” methods. Results from a project that has sought to map all sites and related features across a large study in the northern Fertile Crescent illustrate how an expert-led analysis may be the best means of generating nuanced, contextual understandings of complex archaeological landscapes.
Introduction
Recent years have witnessed an unprecedented transformation in the availability, diversity, and quality of space- and aircraft-acquired imagery, offering a dizzying range of new opportunities for discovery and interpretation of archaeological landscapes (Bevan Citation2015; McCoy Citation2017; Opitz and Herrmann Citation2018). Over the past decade, commercially-acquired high-resolution visible light and near-infrared optical imagery has become increasingly easy for archaeologists to access (e.g., Stott et al. Citation2018; Kennedy and Bishop Citation2011; Lasaponara and Masini Citation2007, Citation2011; Salvi et al. Citation2011; Stone Citation2008). Google Earth and other web-mapping online resources first appeared just over a decade ago and have been used successfully as research tools by many archaeologists, but over the past few years researchers have begun to gain access to large imagery archives via government agencies or private foundations (e.g., Danti, Branting, and Penacho Citation2017; Casana and Laugier Citation2017; Rayne et al. Citation2017). Today, companies like Planet offer high-resolution imagery over the entire globe collected on a daily basis though the innovative use of small, inexpensive satellites, and thus in the future imagery access and availability will likely continue to increase. At the same time, technologies that penetrate vegetation canopy are making high-resolution topographic datasets available the world over, through programs like TerraSAR-X, a high-resolution synthetic aperture radar satellite system (e.g., Linck et al. Citation2013; Balz et al. Citation2016). Even higher resolution topographic data are being collected by aircraft-based lidar programs (e.g., Chase et al. Citation2011; Opitz and Cowley Citation2013; Ebert, Hoggarth, and Awe Citation2016; Johnson and Ouimet Citation2014), and while these data were once prohibitively expensive, government agencies are increasingly making these data available for free, while drone-based lidar promises to lower costs of acquisition dramatically (see VanValkenburgh et al., this issue). A new generation of small, lightweight sensors imaging in near, middle, and thermal infrared are also being deployed on drones, offering new ways of seeing the archaeological landscape and offering new means of discovery (Casana et al. Citation2014, Citation2017; Hill and Rowan Citation2017; McLeester et al. Citation2018; Megarry et al. Citation2018; Wernke, Adams, and Hooten Citation2014). All of these datasets offer transformative potential for archaeological research, with the possibility to radically improve rates of discovery and the ease with which some sites and features can be recognized.
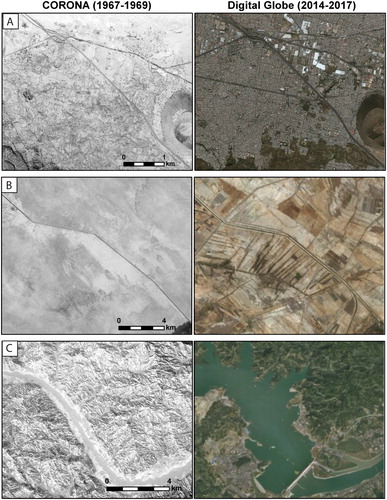
With the understandable excitement surrounding new remote sensing datasets, historical aerial and satellite imagery remain indispensable resources for archaeological discovery and mapping, primarily because they offer a perspective on the landscape that predates widespread land use changes seen in recent decades. Processes including urban expansion (A), the industrialization of agriculture (B), and the construction of reservoirs (C) have obscured or destroyed countless archaeological sites and ancient cultural features over the past century, and thus historical satellite and aerial imagery is often the only means to resurrect these lost landscapes. While many sources of historical aerial imagery are available, including those from government-sponsored mapping programs dating back to the 1920s–1930s (e.g., Bitely Citation2013; Clark and Casana Citation2016), WWI and WWII surveillance photos (Stichelbaut Citation2006; Stichelbaut et al. Citation2013; Hanson and Oltean Citation2013) and more recently, 1950s U2 spy plane images (Hammer and Ur Citation2019), the declassified Cold War-era satellite imaging program known by its codename, CORONA, remains uniquely powerful. Collected as part of the world’s first space imaging program from 1960–1972 (Day, Logsdon, and Latell Citation1998), CORONA is the by far the oldest source of imagery providing global-scale, high-resolution, stereo coverage of nearly the entire land surface of the earth, making it an irreplaceable resource for research across a variety of domains (Casana, Cothren, and Kalayci Citation2012; Ur Citation2013).
Figure 1. Examples of recent land use changes detectable on CORONA imagery: A) Western Mexico City, Mexico, where massive urban sprawl has destroyed archaeological remains; B) Indus River Valley, Pakistan, where intensified irrigation agriculture has obscured archaeological sites; C) Three Gorges Dam, China, where construction of the world’s largest dam project has submerged countless archaeological sites. (CORONA imagery courtesy United States Geological Survey; Modern satellite imagery © ESRI and DigitalGlobe).
There have been many archaeological investigations that have utilized CORONA imagery since it was first made publicly available in 1997, especially in the Middle East (Beck et al. Citation2007; Casana and Cothren Citation2008; Casana, Cothren, and Kalayci Citation2012; Casana Citation2014; Challis et al. Citation2002–04; Kennedy Citation1998; Kouchoukos Citation2001; Philip et al. Citation2002; Ur Citation2003, Citation2013; Wilkinson, Beck, and Philip Citation2006), but recent advances in the efficiency and accuracy of image correction and processing methods are now unlocking new potential for these data, offering the possibility to undertake archaeological remote sensing-based investigations at much larger spatial scales than have previously been practical. However, with these opportunities come significant challenges in how to best explore this enormously rich dataset. Following an overview of key archaeological applications of CORONA imagery and a presentation of the new protocols for geometric correction and online distribution developed as part of the CORONA Atlas Project, this paper provides a discussion of emerging approaches to the “big” data problems researchers inevitably encounter in undertaking archaeological remote sensing-based investigations of large regions. Much recent research has been devoted to the design and implementation of either automated, machine learning-based methods or alternatively to crowd-sourced archaeological site and feature identification, both of which may have some value but produce problematic results. Informed by research on the importance of human cognition and expertise in remote sensing science (e.g., Bianchetti Citation2016; Ringer and Loschky Citation2018; Hoffman Citation2018), I argue instead for the value of a “brute force” approach (Casana Citation2014), in which expert-led, intensive, and systematic imagery analysis constitutes an essential step in the process of archaeological knowledge production. Results illustrate how our own work employing such an approach in analysis of regional-scale CORONA imagery in the Middle East offers nuanced, reliable, and contextual insights into the rich and diverse remnants of past human activities preserved in these unique datasets.
A Global CORONA Atlas
CORONA satellite imagery offers several key advantages as a tool in archaeological prospecting as compared to other forms of aerial and satellite imagery. While some historical aerial photographs may be older or higher resolution than CORONA, they generally are available over relatively small areas, whereas the CORONA program includes more than more than 860,000 images covering most of the earth’s surface (). Meanwhile, other global-scale satellite imaging programs such as Landsat and ASTER are of such low spatial resolution that most archaeological features are difficult to distinguish, while 705,000+ CORONA images deriving from the most advanced cameras on board the KH-4A and KH-4B satellites provide imagery of 9 and 6 feet (2.74 and 1.83 meters) resolution, enabling recognition and mapping of architectural-scale features (A). Moreover, CORONA was collected in the late afternoon with the intention of highlighting surface topography, unlike modern satellite imagery which is most often collected at solar noon in order to maximize surface reflectance, such that archaeological sites and features with topographic expression such as mounded settlements, field walls, or earthworks appear more clearly than in modern high-resolution satellite imagery (B). In addition, most CORONA images were collected in stereo, meaning that it is possible to both view the landscape in 3D as well as to produce historical digital surface models of areas that have been leveled or flooded in recent decades, a process that is significantly easier than previously thanks to the continued improvement of photogrammetric software (). Finally, unlike most historical imagery, the CORONA archive is maintained by the United States Geological Survey (USGS) and can be readily searched through EarthExplorer (https://earthexplorer.usgs.gov/), from which images can either be downloaded for free or purchased for only $30 USD. The global coverage, relatively high-resolution, stereo capabilities, and ease of access make CORONA a truly unique resource, serving as the only extant record of archaeological sites and other features in many parts of the world that have been impacted by land use change in recent decades.
Figure 2. CORONA imagery coverage of KH4A and KH4B satellites (1963–1972) for Eurasia and Africa (Vector data courtesy United States Geological Survey; Basemap courtesy ESRI).
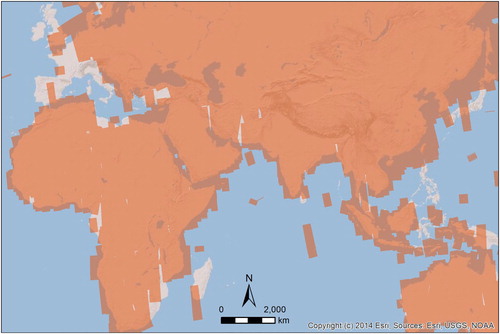
Figure 3. (A) CORONA imagery is sufficiently high-resolution to reveal architectural details, as at the early medieval site of Khirbet Dihman in northern Syria. (B) CORONA is captured in the late afternoon so that topographic features appear clearly, as at the multi-mound cluster of Tell Bokha, northern Iraq (CORONA imagery courtesy United States Geological Survey).
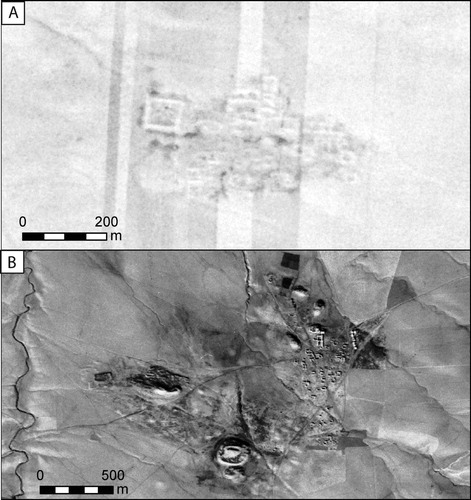
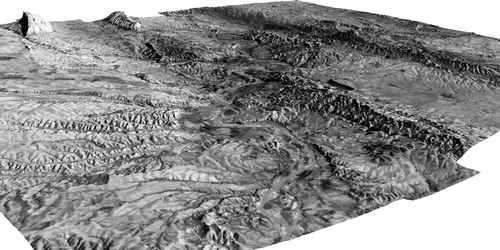
Figure 4. A three-dimensional surface model of the Tigris River Valley, northern Iraq. While the river valley and hundreds of sites within it are submerged by a reservoir today, the topography of the sites and the surrounding landscape can be recreated from a series of 1967 CORONA images.
Despite the proven potential of CORONA imagery for archaeological and other research, the majority of the CORONA archive has never even been scanned, existing only in analogue film format, as digitization of the imagery has only been undertaken as an on-demand service, resulting in haphazard and uneven coverage. But the major hurdle that most researchers have encountered in attempting to make use of CORONA is in correcting the geometric distortions contained within raw images (Casana, Cothren, and Kalayci Citation2012). The CORONA camera system was ingeniously designed to capture as large an area of the ground as possible at resolution that approached conventional aerial photography, but this was accomplished at the expense of spatial fidelity. CORONA satellites used a cross-path panoramic camera, in which a large telescopic lens would rotate, imaging a swath of the earth’s surface onto an elongate film strip that rested on a curved film platen (Day, Logsdon, and Latell Citation1998; Schenk, Csathó, and Shin Citation2003; Sohn, Kim, and Yom Citation2004). Distortions caused by camera parallax as well as by the motion of the satellite while the film was being exposed produce extreme spatial distortions in raw CORONA images, and no commercial software currently offers tools that enable these distortions to be easily corrected.
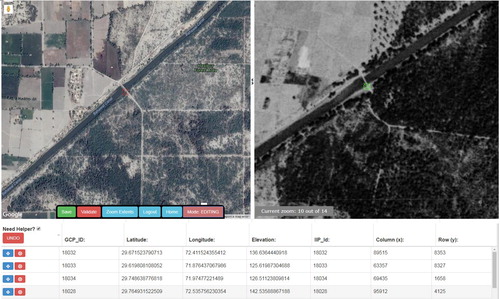
The CORONA Atlas Project team has worked over the past decade to develop improved methods for efficient and accurate orthorectification of CORONA images, as well as a platform to facilitate viewing and distribution of these data (Casana and Cothren Citation2013). Using only open-source software, we have developed a system we call “Sunspot,” which offers the ability to orthorectify CORONA images in a few relatively simple steps (). Through this online tool, researchers can upload a USGS-scanned image, collect at least 14 ground control points (GCPs) by comparing the CORONA to modern Google-served imagery, and then correct the imagery through the push of a button. Users can download both NITF and GeoTIFF versions of the image, as well as complete error reports, image footprints, and other data. The system is open-access and free to use, with the one caveat that any images corrected through Sunspot will ultimately be posted on the newly expanded CORONA Atlas.
Figure 5. A screen shot of Sunspot, an online CORONA imagery orthorectification tool developed by the CORONA Atlas Project.
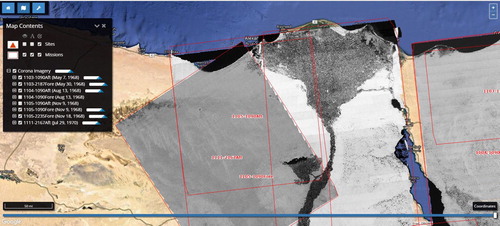
Using Sunspot, our research team has worked to correct thousands of CORONA images, now available to view and download through the online CORONA Atlas viewer (). We have carefully selected the best quality images (i.e., cloud and haze free, high-resolution, and acquired under optimal seasonal conditions), focusing on areas of the world that have seen the greatest degrees of land use change since the 1960s, such as agricultural plains, river valleys, densely populated areas, as well as places that have witnessed major environmental changes such as the Arctic, the Himalayas, and elsewhere. We also focus on areas where more and higher quality CORONA imagery is available, specifically places that were either part of the Cold War communist bloc or sites of geopolitical struggles during the 1960s. To date we have corrected imagery covering much of eastern China, Central and South Asia, the Middle East, the African Sahel, Eastern Europe, Greenland, central Mexico, the Andean Altiplano, as well as selected areas of the United States. As a consortium of users continue making use of Sunspot, an increasing quantity of CORONA imagery is available and ready for investigations of past human landscapes.
Figure 6. A screen shot of the open-access CORONA Atlas, where orthorectified CORONA imagery can be viewed and downloaded.
Approaches to Large-Scale Archaeological Remote Sensing
The continental-scale coverage offered by CORONA, which the CORONA Atlas Project is working to realize, combined with the exceptionally good visibility of archaeological remains in these data open the door to new dimensions of research that investigate patterns of human occupation and land use across areas that are orders of magnitude larger than typical archaeological survey projects. Remote sensing-based archaeological investigations using CORONA are now being conducted at much larger spatial scales, beyond survey boundaries, across national borders, and in areas that are inaccessible to traditional field-based research (e.g., Lawrence et al. Citation2016, Citation2017; Kalayci Citation2016; Casana Citation2014, in press; Bradbury et al. Citation2015). With a growing interest in leveraging the potential of CORONA and other imagery for archaeological discovery, scholars are inevitably confronted with the central problem of how to find, document, and analyze the seemingly overwhelming number of potential archaeological features contained within large imagery datasets. As our vision moves from a site, to a survey area, to a vast unknown region, and as the quality and quantity of remote sensing resources continue to improve and expand, there has been an increasing emphasis within archaeological remote sensing scholarship to develop new search strategies that rely upon either automated, machine learning-based discovery, or alternatively, on crowd-sourced discovery. Below I discuss these two approaches, and argue instead for an intensive, systematic, and expert-led approach to archaeological remote sensing, using results from my own research in the northern Fertile Crescent as an example.
Automated Site Detection
There is tradition of research in archaeological remote sensing dating back to the 1980s, when multispectral satellite images from the Landsat program became available, that sought to identify archaeological sites based on their spectral signatures in imagery (e.g., Limp Citation1989) or to use reflectance and other spatial data to construct rudimentary predictive models that would indicate where archaeological sites would be most likely discovered (e.g., Custer et al. Citation1986). In many respects, to have a computer automatically identify sites alongside other environmental features is something of a Holy Grail of archaeological remote sensing, and recent years have seen rapid advancements in the sophistication of such efforts (e.g., Cerrillo-Cuenca Citation2016; Cowley Citation2012; D’Orazio et al. Citation2015; Freeland et al. Citation2016; Megarry et al. Citation2016). Most automated detection efforts rely either on an assumption that archaeological sites will possess spectral reflectance characteristics that are sufficiently unique so as to permit them to be recognized, or alternatively, they rely on a shape- or object-based analysis, which often combines some expected range of reflectance values with an expected shape and size (e.g., De Laet, Paulissen, and Waelkens Citation2007; Due Trier, Larsen, and Solberg Citation2009; Harrower et al. Citation2013; Schneider et al. Citation2015). These rule-based approaches, all of which necessitate a priori knowledge about the likely size, shape, and reflectance of sites, can be effective at locating specific types of features in particular environments (e.g., Schuetter et al. Citation2013), but cannot by definition locate unusual or atypical features, and cannot be easily generalized to regions or features outside of where they are developed (Lambers, Verschoof-van der Vaart, and Bourgeois Citation2019).
Menze and Ur’s (Citation2012) study in the Upper Khabur basin of eastern Syria provides an good example of a relatively successful automated site detection project in which the team cleverly combine a time series of Landsat and Aster images to build spectral classification for known sites, helping to highlight the anthropogenic soils that are characteristic of the region. They then use a shape-based algorithm to identify clusters of pixels that conform to known sites in terms of size, shape, and distribution. The team reports a 73–90% success rate for identification of known sites across several survey areas, but also 30–40% false positives as modern villages, alluvial soils, and a range of other features were identified by their automated approach as archaeological features. Thus, despite reporting some of the best results of any yet-published automated site detection effort, for a real-worId application their approach would leave researchers woefully unprepared, knowing that they were missing as many as 20–30% of actual sites and that their dataset of probable sites includes 30–40% modern or geological features. In contrast, Ur (Citation2010) reports that his own more traditional, expert-led analysis of CORONA satellite imagery for the same region enabled him to confidently identify nearly 100% of sites. His intensive field surveys in the region were unable to locate any significant archaeological remains that were not previously identified on CORONA imagery. Due to a combination of sparse vegetation, large archaeological sites, and relatively flat, homogeneous terrain, archaeological sites and features are more easily recognized in satellite imagery on the plains of northern Mesopotamia than perhaps anywhere else in the world, and so it is not surprising that this same region is also one where automated detection works best.
Recent research has sought to replace rule-based automated detection with machine learning-based approaches that instead begin with a large training sample of sites and allow for a more flexible set of criteria defining what constitutes a “site” to be iteratively established (Lambers, Verschoof-van der Vaart, and Bourgeois Citation2019; Zingman et al. Citation2016). While such approaches have promise, they remain in early stages of development, and are often hamstrung by the complexity and inconsistency of archaeological site databases upon which they are intended to be built (e.g., Lambers, Verschoof-van der Vaart, and Bourgeois Citation2019; Sadr Citation2016). Despite the effort being devoted to development of automated and machine-learning approaches to identification of archaeological sites and features in remotely sensed imagery, nearly all of these studies produce a large number of false positives as well as missing many known sites, and cannot yet outperform trained human analysts in terms of accuracy. Nonetheless, for the identification of archaeological features that have a predictable shape, size, or reflectance and which occur in particular environments, automated detection methods can certainly constitute a complementary approach to other means of analyzing large imagery datasets.
Crowd-Sourced Discovery
The other major trend in the analysis of remotely sensed “big” data has been crowd-sourcing approaches, in which researchers recruit a large group of volunteers who perform most of the basic work of archaeological feature identification. Often referred to optimistically as a form of “citizen science”—akin to efforts to enlist the work of amateur astronomers in searching for undocumented planets through programs like the NASA-sponsored Planet Hunters TESS (Transiting Exoplanet Survey Satellite) project, or of amateur birders in the Audubon Society and Cornell Ornithology Lab’s Great Backyard Bird Count (http://gbbc.birdcount.org/)—proponents of crowd sourcing argue that enlisting thousands or even millions of volunteers around the world to peer over imagery will produce far more site identifications than would ever be possible by a handful of archaeologists working alone. While few would argue about the educational and public outreach benefits of citizen science projects, the usefulness of the data they generate is less certain. Systematic analysis of ecological citizen science projects shows that in many cases, volunteers produce data that are so flawed as to be analytically useless (e.g., Aceves-Bueno et al. Citation2017; MacDonald Citation2018).
In archaeology, a handful of crowd-sourced efforts have seen some success, primarily in cases where volunteers perform relatively rote tasks and in which there is a built-in check on the quality of results (e.g., Bonacchi et al. Citation2015). Our own experiments with crowd-sourcing orthorectification of CORONA imagery in the Sunspot system provides one such example. The most difficult and time-consuming step in our image correction process is the identification of ground control points (GCPs), established by locating features that can be recognized in both 50+ year-old CORONA imagery and modern high-resolution Google-served imagery. These points must be well-distributed across the image and should be accurate to within a few pixels. After users have identified at least 14 points, they push a button to correct the image, and the software attempts to fit the imagery to the GCPs using a mathematical model of the underlying distortions, overlaying it on an SRTM digital elevation model. If error calculations are too large, the process fails, and users then must delete GCPs with the highest error values or add additional points until the correction process achieves our established threshold for acceptable error. Thus, virtually anyone is capable of identifying GCPs and there is a built-in filter to prevent poorly corrected images from being uploaded to the CORONA Atlas. Over the history of the CORONA Atlas project, we have enlisted nearly 300 people to attempt the correction process, from students in classes, participants in workshops, volunteers, paid hourly staff members, and a few project professionals. We have consistently found that while students, volunteers, and other casual users might succeed in correcting a handful of images each, they tend to quickly lose interest in what can be a monotonous and challenging exercise. Ultimately, then, close to 90% if the images posted on the CORONA Atlas have been corrected by just a handful of professional team members who are dedicated to the project, skilled at the task, and invested in producing good results. Thus, even though our attempt at crowd sourcing worked on a technical level, our expert team actually completed most of the image processing.
In other crowd-sourcing projects where volunteers are expected to undertake primary analysis of data and successfully replicate the work of trained archaeologists, the results have been even less encouraging. For example, one of the most popular crowd-based prospection efforts was a National Geographic-sponsored search for Ghangis Khan’s tomb in Mongolia (Lin et al. Citation2014). Focusing on a study area of around 6000 square kilometers in central Mongolia where they believed the tomb of Genghis Khan was likely located, the well-funded team created a website in which volunteers could examine small segments of pan-sharpened 0.5 m resolution GeoEye satellite imagery and mark potential archaeological features. The substantial fan base and wide media reach of National Geographic combined with the excitement surrounding the search for the fabled tomb of the medieval Mongol ruler enabled the team to recruit more than 10,000 volunteers who collectively contributed 30,000 hours of effort to the project. In total, project volunteers identified 2.3 million potential archaeological features, and using a kernel-based algorithm, the project identified those with the largest consensus of assessments. Ultimately, the remote-sensing portion was followed up by field survey, which was able to verify 53 sites discovered by the project. These results have been painted in positive terms by project researchers, but when one considers them against the 2.3 million potential targets identified by the volunteers, they appear much less compelling. One might imagine that randomly placing 2.3 million survey units in the same landscape would have yielded better results. It is also likely that an archaeologist who specializes in Central Asia and who is trained in remote sensing would have been able to identify many more than 53 sites with a high degree of confidence within a matter of hours. Thus while the Ghangis Khan Tomb project had undoubted benefits in terms of engaging a large segment of the public in a research project, it did not actually develop an efficient or helpful means of identifying archaeological sites.
Other crowd-sourced efforts have seen even less success. In the wave of looting and site destruction that has spread across the Middle East and North Africa over the past decade, numerous researchers have turned to satellite image-based analysis as a means to identify and track damage in remote and war-torn regions (e.g., Stone Citation2008; Danti, Branting, and Penacho Citation2017; Casana Citation2015; Casana and Laugier Citation2017; Wolfinbarger et al. Citation2017; Rayne et al. Citation2017). With support of the TED Foundation and National Geographic beginning in 2017, Sarah Parcak launched GlobalXplorer, a crowd-based effort to track looting and site damage globally. The project follows similar protocols to the Genghis Khan tomb project in which volunteers are given access to random 1km-square tiles of high-resolution, pan-sharpened imagery and asked to identify evidence of looting within them. While Parcak (Citation2019, 219–228) has made broad claims about the project, results have not been published in a manner that allows them to be evaluated, and previous experiments with crowd-sourced site discovery and looting monitoring suggest we should be skeptical that volunteers will be able to undertake this kind of higher-level analysis successfully.
In my own experiment with crowd-sourcing, I had students enrolled in a class on cultural heritage issues at Dartmouth College undertake a remote sensing-based analysis of looting and site damage in Syria. Following a series of lectures and readings on identification and interpretation of site damage and looting, as well as discussion of the war in Syria and its impact on cultural heritage, the class was divided into six teams of three students each, each of which received a dataset of approximately 300 sites located in northern Syria. As part of US Department of State-funded effort, my research team had already found 15–20% of sites in each dataset had evidence of looting visible in satellite imagery (Casana Citation2015; Casana and Laugier Citation2017), and students were then set to the task of analysis. The students who participated in this project were characteristically intelligent and hard-working, and they were being graded on the assignment, yet their results were nonetheless abysmal. Of the six teams, only two managed to correctly identify any looted sites; and of these, one team found two sites with looting and another team located one. At the same time, all of the teams incorrectly identified what they believed to be looting at some 20–30% of other sites in each dataset, commonly mistaking orchards, haystacks, or cemeteries for looting. These results suggest that even students with some degree of training can only be expected to identify <5% of looted sites, while producing a very large sample of false positives. My own results are mirrored by the pilot study for the TerraWatchers project, another crowd-sourcing effort to document looting and site damage in the Middle East. This project found that student participants were only able to correctly identify 7% of looted sites, leading project director Stephen Savage to comment, “in the initial mission, the false positives ended up creating much more work for me than if I had done all the analysis myself” (Ramsey Citation2016). With additional training and resources, the TerraWatchers team was able to improve results to a reported 39% accuracy (Savage, Johnson, and Levy Citation2017), but in practice there remains no way for researchers to know how many looted sites volunteers overlooked or which of their observations are correct without independently verifying all positive and negative assessments.
In comparison to tasks that have had some success using crow-sourcing approaches, such as tracking bird species or finding planets in the night sky, identifying archaeological features in satellite imagery is a more specialized task with a much smaller base of skilled amateurs. Even if volunteers in an archaeological remote sensing project are given some rudimentary degree of training, as many projects attempt to provide, they simply do not have the depth of experience necessary to identify archaeological sites and features. Doing so requires a wide range of geographically specific knowledge—of the types of sites or landscape features that are likely to be encountered in a region, as well as of the contemporary land use practices, geology, and environment, and how these factors might impact the visibility of certain features. In this light, it is not surprising that untrained volunteers have trouble identifying sites, as learning to do so reliably requires years of experience and specialized training.
Expert-Led “Brute Force” Remote Sensing
Both automated detection and crowd-sourcing approaches to archaeological discovery often suffer from a similar theoretical shortcoming, in that they proceed operationally from a perspective that archaeological sites are akin to Easter eggs—that they are discreet, bounded, and readily identifiable features which represent the only interesting or valuable components of the landscape (see also Howey et al., this issue; McCoy, this issue). In an Easter egg hunt, children search for colorful eggs, and there is no question when one has been discovered: it is a totally unique object, completely unlike its surroundings. Moreover, for the children searching for them, all Easter eggs have great value, because they are often filled with something delicious. In the context of the hunt, no other objects are of any interest whatsoever. Thus, the central problem of an Easter egg hunt is to develop a search strategy that will maximize recovery of eggs: the more eggs we find, the more quickly, the better our results.
In many contemporary archaeological remote-sensing efforts, projects conceptualize archaeological sites in a manner similar to Easter eggs—as discreet, self-evident objects, scattered across a vast landscape, and the only useful information we get is in locating them, either through an algorithm or through thousands of human eyeballs. It is ironic that these approaches have gained such popularity and prominence, as they run directly counter to several decades of research in what we collectively now term landscape archaeology (Kantner Citation2008; Knapp and Ashmore Citation1999; Wilkinson Citation2003; Johnson Citation2012; David and Thomas Citation2008). Most archaeologists working today recognize that “site” is a problematic notion; it is a construct that offers a shorthand method for documenting the archaeological record and which has thus become deeply embedded in cultural heritage management infrastructure, but which does not actually reflect the complexity or diversity of material remains spread across the landscape (Banning Citation2002; Dunnell Citation1992; McCoy, this volume). Even for projects that operate within a strictly site-based model, “sites” can be ancient settlements, cemeteries, cultic constructions, rock reliefs, artifact scatters, water management installations, extraction and quarry pits, and a huge range of other potential features. And all these things that we might arguably record as sites are themselves nested within a continuous landscape of past human activities, manifested variably as agricultural fields, route systems, sacred spaces, and natural environments.
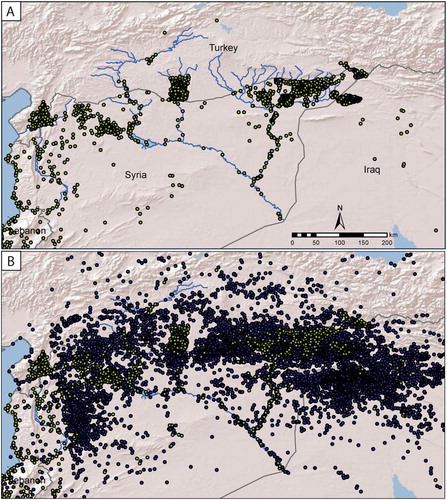
I and my team have worked over the past several years to develop an approach to regional remote sensing-based archaeological research that I have termed “brute force” (Casana Citation2014), because instead of attempting to shortcut the process of discovery through a crowd-based or algorithmic method, we instead employ a small, collaborative team of expert analysts to systematically and methodically inspect the entirety of a study area. In so doing, we simultaneously seek to discover and map ancient sites and features across a large region, while also attempting to interpret their significance through a contextual landscape analysis of observable characteristics, spatial distribution, and environmental settings. Our work has been focused for the past several years on a 300,000 square kilometer research area in the northern Fertile Crescent, an area extending from the Mediterranean coast of western Syria to the Zagros Mountains of northern Iraq (Casana Citation2014; Casana Citationin press). We began by assembling all known archaeological information, compiling evidence from forty archaeological survey reports, as well as data from several major gazetteer projects. We then examine each survey report and dataset, attempting to locate previously recorded archaeological sites on CORONA imagery, excluding sites from our analysis that cannot be confidently identified. Collectively, our mapping effort created a database of approximately 4100 sites, constituting essentially the entire published record of sites in the region (A). The location of these sites illustrates the unevenness of the archaeological record as it exists to date, with dense clusters of sites reflecting where survey projects have been undertaken, more than the actual distribution of ancient settlement. These sites are an essential part of the research process, as they both illustrate what sites and features look like within the study area, and for those which have associated dating information, provide a training sample for morphological analysis.
Figure 7. (A) Map of all previously published archaeological sites (c. 4100) in a 300,000 sq km study area of the northern Fertile Crescent. (B) All additional sites (c. 10,000) documented through systematic, expert-led analysis of CORONA satellite imagery (Basemap courtesy ESRI).
Our next step was to expand our analysis to look for previously undocumented sites and site-like features. We divided the entire region into 10 × 10 km search grids and carefully inspected each one, marking in our database any potential sites using a three-tiered certainty score of definitely, probably, and possibly. As in any archaeological prospection effort, our ability to identify some kinds of sites, such a mounded tells, is much greater than other kinds of sites, such as lithic scatters or building remains. Similarly, sites in some environmental zones, such as flat plains, are much easier to recognize than those in geologically complex or more densely vegetated zones. These issues are parallel to any problem of archaeological visibility; in a conventional archaeological survey, certain types of site or sites in certain areas will be easier to discover than others, based on surface topography, preserved architecture, artifact density, or vegetation cover. In our work, we face similar challenges but the factors influencing site visibility are somewhat different.
Ultimately, our efforts succeeded in mapping more than 10,000 previously unidentified archaeological sites and site-like features (B). As we mapped sites and features, we also recorded other information about them within a morphological taxonomy, classifying them based on similarities in their appearance (Casana in press). We consider many variables including, for example, the degree and shape of mounding, the severity of erosional gullies, the evident rectilinear architectural features, the association of radial routes, field systems of various configurations, or other off-site features, as well as the presence of modern villages or installations. Differences in site morphology are the product of distinct cultural traditions regarding how settlements were organized spatially, technologies used in construction, longevity of occupation on a given spot, land rights and land tenure traditions, agricultural and pastoral practices, as well as post-occupational transformations by both environmental and anthropogenic forces. As such, an analysis of site morphology can be used to make inferences about a wide range of cultural and historical questions (Casana Citation2013b, Citation2014, Citationin press). Additionally, the fact that our analysis is being conducted by a small group of experts means that our search strategy is also effective at identifying unusual or anomalous sites and features. Unique features are unlikely to be recognized by any automated site discovery protocol, while untrained observers would not have the experience to recognize what is typical, and yet these kinds of discoveries can be among the most important things identified in a remote sensing project.
To date, the robust dataset created through our intensive, expert-led analysis, which enables queries and exploration limited only by our own creativity, has facilitated a wide range of new insights. An analysis of the size and distribution of distinctive radial route systems, and the discovery of such features in unexpected areas, was used as the basis for an analysis of intensive sheep-based pastoral practices in northern Mesopotamia (Casana Citation2013a). Knowledge of the total distribution and size of mounded settlements likely occupied during the third millennium B.C. enabled an analysis of agricultural sustainability in light of past climate variability (Kalayci Citation2016). An effort to map all Bronze Age sites in the northern Levant and analysis of their relative size and environmental distribution offers novel perspectives on the political landscape of Late Bronze Age kingdoms (Casana Citation2013b). A morphological analysis of all mounded sites in the Orontes River Valley of the same region permitted the probable identification of several ancient cities known from the historical record but not previously identified (Casana Citation2017). Analysis of small sites with rectilinear buildings, most likely the remains of Roman and early medieval forts or caravansaries, sheds new perspectives the nature of defensive and communication systems on the Roman-Persian border (Casana in press). The comprehensive mapping of all visible sites across the large study region has also served as the basis for an analysis of looting and site destruction taking place in the context of the Syrian civil war (Casana and Laugier Citation2017; Casana Citation2015), as well as facilitating new regional, field-based investigations in previously poorly-known areas of the Kurdistan Region of Iraq (Casana and Glatz Citation2017). By creating a remote sensing dataset that is very large, including more than 14,000 sites and site-like features, but which is also built on careful, contextual analysis by trained and thoughtful archaeologists, we are able to use remote sensing not only as a tool to help in survey, or as a technological gimmick, but as a method to make substantive observations about people in the past that are otherwise invisible.
Conclusions
This paper has sought to highlight the unique possibilities for analysis of archaeological landscapes offered by declassified, Cold War-era CORONA satellite imagery, particularly when used in large-scale, regional investigations. While past research using CORONA has been challenged by the difficulties in orthorectifying the imagery, the development of improved processing methods through the CORONA Atlas Project are now beginning to realize the full potential of this powerful resource. The availability of global-scale CORONA imagery is helping to facilitate a new era in archaeological investigations, conducted at larger spatial scales than were previously practical, offering new perspectives on the history of human settlement, past land use practices, and a range of other questions.
Mirroring trends in remote sensing science more broadly, many researchers interested in pan-regional investigations have turned to either automated, machine-learning approaches to archaeological site detection or have attempted to rely on crowd-sourced identification of cultural features. Automated efforts are often driven by archaeological collaborations with computer scientists who are interested in applying the same kinds of machine learning or computer vision technologies that have been successful in other areas to the problem of site and feature identification in satellite imagery. As such, many of these projects are interesting from a technical perspective, but rarely offer a better means of identifying sites and features than is possible by expert human analysts. Crowd-sourcing on the other hand is more often implemented, at least in part, as an education and outreach tool, and in this capacity has been successful, but most efforts produce data that have so much noise as to be analytically useless. Even more importantly, both automated and crowd-sourced approaches fail to capture the full range of the complex and subtle features that constitute both archaeological sites and the cultural landscapes within which they are situated.
I argue instead for an intensive, systematic, expert-led “brute force” approach to archaeological remote sensing in which regional-scale, imagery-based analysis is constructed from contextual and nuanced observations by trained archaeologists. Rather than attempting to shortcut the process of discovery and produce a map with a lot of dots but not much useful information, an expert-led remote sensing-based investigation foregrounds the fundamental role of thoughtful, informed, creative interpretation, not only producing results that are more comprehensive and reliable, but also facilitating a wide range of otherwise unknowable insights into the ancient people we seek to study.
Acknowledgments
Research reported herein was supported by the grants from the National Endowment for the Humanities (Award: PW-51419-13), the National Aeronautics and Space Administration (Award: NNX10AM39G), and the American Council of Learned Societies. Thanks go to the University of Arkansas CORONA Project team, including Prof. Jackson Cothren, Tuna Kalayci, Christopher Angel, and John Wilson, as well as Dartmouth-based CORONA Atlas researchers Carolin Ferwerda, Elise J. Laugier, and Emma Menio.
Disclosure Statement
No potential conflict of interest was reported by the author.
Notes on Contributor
Jesse Casana (Ph.D. 2003, University of Chicago) is Professor and Chair of the Department of Anthropology at Dartmouth College, Hanover, New Hampshire, USA. He is an archaeologist who specializes in settlement, land use, and environmental histories in the Middle East, as well as in the development and application of remote sensing technologies to archaeological research.
References
- Aceves-Bueno, E., A. S. Adeleye, M. Feraud, Yuxiong Huang, Mengya Tao, Y. Yang, and S. E. Anderson. 2017. “The Accuracy of Citizen Science Data: A Quantitative Review.” Bulletin of the Ecological Society of America 98 (4): 278–290.
- Balz, T., G. Caspari, B. Fu, and M. Liao. 2016. “Discernibility of Burial Mounds in High-Resolution X-Band SAR Images for Archaeological Prospections in the Altai Mountains.” Remote Sensing 8 (10): 817.
- Banning, E. B. 2002. Archaeological Survey. New York: Kluwer Academic.
- Bianchetti, R. A. 2016. “Describing the Problem-Solving Strategies of Expert Image Interpreters using Graphical Knowledge Elicitation Methods.” GIScience & Remote Sensing 53 (5): 561–577.
- Bitely, E. 2013. “Archaeological Prospecting Using Historic Aerial Imagery: Investigations in Northeast and Southwest Arkansas.” M.A. thesis. University of Arkansas.
- Beck, A., G. Philip, M. Abdulkarim, and D. Donoghue. 2007. “Evaluation of Corona and Ikonos High Resolution Satellite Imagery for Archaeological Prospection in Western Syria.” Antiquity 81 (1): 161–175.
- Bevan, A. 2015. “The Data Deluge.” Antiquity 89: 1473–1484.
- Bradbury, J., D. Davies, M. Jay, G. Philip, C. Roberts, and C. Scarre. 2015. “Making the Dead Visible: Problems and Solutions for ‘Big’ Picture Approaches to the Past, and Dealing with Large ‘Mortuary’ Datasets.” Journal of Archaeological Method and Theory 23: 561–591.
- Bonacchi, C., A. Bevan, D. Pett, and A. Keinan-Schoonbaert. 2015. “Crowd- and Community-Fuelled Archaeological Research. Early Results from the MicroPasts Project.” In Proceedings of the Conference Computer Applications and Quantitative Methods in Archaeology, edited by S. Campana, R. Scopigno, G. Carpentiero, and M. Cirillo, 279–288. Oxford: Archaeopress Publishing.
- Casana, J. 2013a. “Radial Route Systems and Agro-Pastoral Strategies in the Fertile Crescent: New Discoveries from Western Syria and Southwestern Iran.” Journal of Anthropological Archaeology 32: 257–273.
- Casana, J. 2013b. “Settlement, Territory and the Political Landscape of Late Bronze Age Polities in the Northern Levant.” Archaeological Papers of the American Anthropological Association 22 (1): 107–125.
- Casana, J. 2014. “Regional-Scale Archaeological Remote Sensing in the Age of Big Data: Automated Detection Versus Brute Force Methods.” Advances in Archaeological Practice 2 (3): 222–233.
- Casana, J. 2015. “Satellite Imagery-Based Analysis of Archaeological Looting in Syria.” Near Eastern Archaeology 78 (3): 142–152.
- Casana, J. 2017. “The Northern Levant: Archaeology.” In Hittite Landscape and Geography, edited by L. Z. Ullmann and M. Weeden, 172–185. Leiden and Boston: Brill.
- Casana, J. in press. “Beyond Survey Boundaries: Satellite Remote Sensing-Based Classification and Dating of Archaeological Sites in the Northern Fertile Crescent.” In New Agendas in Remote Sensing and Landscape Archaeology in the Near East, edited by D. Lawrence, M. Altaweel, and G. Philip. Chicago: University of Chicago Press.
- Casana, J., and J. Cothren. 2008. “Stereo Analysis, DEM Extraction and Orthorectification of CORONA Satellite Imagery: Archaeological Applications from the Near East.” Antiquity 82: 732–749.
- Casana, J., and J. Cothren. 2013. “The CORONA Atlas Project: Orthorectification of CORONA Satellite Imagery and Regional-Scale Archaeological Exploration in the Near East.” In Mapping Archaeological Landscapes from Space, edited by D. Comer and M. Harrower, 33–43. New York: Springer.
- Casana, J., J. Cothren, and T. Kalayci. 2012. “Swords into Ploughshares: Archaeological Applications of CORONA Satellite Imagery in the Near East.” Internet Archaeology 32: 2. Electronic document, http://intarch.ac.uk/journal/issue32/2/toc.html, accessed October 15, 2019.
- Casana, J., and C. Glatz. 2017. “The Land Behind the Land Behind Baghdad: Archaeological Landscapes of the Upper Diyala (Sirwan) River Valley.” Iraq 79: 1–22.
- Casana, J., J. Kantner, A. Wiewel, and J. Cothren. 2014. “Archaeological Aerial Thermography: A Case Study from the Chaco-Period Blue J Community, New Mexico.” Journal of Archaeological Science 45: 207–219.
- Casana, J., and E. J. Laugier. 2017. “Satellite Imagery-Based Monitoring of Archaeological Site Damage in the Syrian Civil War.” PLoS ONE 12 (11): e0188589.
- Casana, J., A. Wiewel, A. Cool, A. C. Hill, K. Fisher, and E. J. Laugier. 2017. “Archaeological Aerial Thermography in Theory and Practice.” Advances in Archaeological Practice 5 (4): 310–327.
- Cerrillo-Cuenca, E. 2016. “An Approach to the Automatic Surveying of Prehistoric Barrows through LiDAR.” Quaternary International 435: 135–145.
- Challis, K., G. Priestnall, A. Gardner, J. Henderson, and S. O’Hara. 2002. “Corona Remotely-Sensed Imagery in Dryland Archaeology: The Islamic City of al-Raqqa, Syria.” Journal of Field Archaeology 29: 139–153.
- Chase, A. F., D. Z. Chase, J. F. Weishampel, J. B. Drake, R. L. Shrestha, K. C. Slatton, J. J. Awe, and W. E. Carter. 2011. “Airborne LiDAR, Archaeology, and the Ancient Maya Landscape at Caracol, Belize.” Journal of Archaeological Science 38: 387–398.
- Clark, A. J., and J. Casana. 2016. “A New Use for Old Photos: Archaeological Landscape Reconstruction in the Big Bend.” Plains Anthropologist 61 (240): 1–20.
- Cowley, D. C. 2012. “In with the new, out with the old? Auto-Extraction for Remote Sensing Archaeology.” In Remote Sensing of the Ocean, Sea Ice, Coastal Waters, and Large Water Regions, edited by C. R. Bostater, S. P. Mertikas, X. Neyt, C. Nichol, D. C. Cowley, and J. B. Bruyant (Proceedings of SPIE 8532). Edinburgh: SPIE; 853206-1.
- Custer, J. F., T. Eveleigh, V. Klemas, and I. Wells. 1986. “Application of Landsat Data and Synoptic Remote Sensing to Predictive Models for Prehistoric Archaeological Sites: An Example from the Delaware Coastal Plain.” American Antiquity 51: 572–588.
- Danti, M., S. Branting, and S. Penacho. 2017. “The American Schools of Oriental Research Cultural Heritage Initiatives: Monitoring Cultural Heritage in Syria and Northern Iraq by Geospatial Imagery.” Geosciences 7 (4): 95.
- David, B., and J. Thomas, eds. 2008. Handbook of Landscape Archaeology. Walnut Creek, CA: Left Coast Press.
- Day, D. A., J. M. Logsdon, and B. Latell. 1998. Eye in the Sky: The Story of the CORONA Spy Satellites. Washington, DC: Smithsonian Institution Press.
- De Laet, V., E. Paulissen, and M. Waelkens. 2007. “Methods for the Extraction of Archaeological Features from Very HighResolution Ikonos-2 Remote Sensing Imagery, Hisar (Southwest Turkey).” Journal of Archaeological Science 34 (5): 830–841.
- D’Orazio, T., P. Da Pelo, R. Marani, and C. Guaragnella. 2015. “Automated Extraction of Archaeological Traces by a Modified Variance Analysis.” Remote Sensing 7: 3565–3587.
- Due Trier, S., Y. Larsen, and R. Solberg. 2009. “Automatic Detection of Circular Structures in High-Resolution Satellite Images of Agricultural Land.” Archaeological Prospection 16: 1–15.
- Dunnell, R. C. 1992. “The Notion Site.” In Space, Time, and Archaeological Landscapes, edited by J. Rossignol and L. Wandsnider, 21–41. New York: Plenum Press.
- Ebert, C., J. Hoggarth, and J. Awe. 2016. “Integrating Quantitative Lidar Analysis and Settlement Survey in the Belize River Valley.” Advances in Archaeological Practice 4 (3): 284–300.
- Freeland, T., B. Heung, D. V. Burley, G. Clark, and A. Knudby. 2016. “Automated Feature Extraction for Prospection and Analysis of Monumental Earthworks from Aerial LiDAR in the Kingdom of Tonga.” Journal of Archaeological Science 69: 64–74.
- Hammer, E., and J. Ur. 2019. “Near Eastern Landscapes and Declassified U2 Aerial Imagery.” Advances in Archaeological Practice 7 (2): 107–126.
- Hanson, W. S., and I. A. Oltean, eds. 2013. Archaeology from Historical Aerial and Satellite Archives. New York: Springer-Verlag.
- Harrower, M. J., J. Schuetter, J. McCorriston, P. K. Goel, and M. J. Senn. 2013. “Survey, Automated Detection, and Spatial Distribution Analysis of Cairn Tombs in Ancient Southern Arabia.” In Mapping Archaeological Landscapes from Space, edited by D. Comer and M. Harrower, 259–268. New York: Springer.
- Hill, A. C., and Y. M. Rowan. 2017. “Droning on in the Badia: UAVs and Larger Scale Site Documentation at Wadi Qattafi, Jordan.” Near Eastern Archaeology 80 (2): 114–123.
- Hoffman, R. R. 2018. “Cognitive and Perceptual Processes in Remote Sensing Image Interpretation.” In Remote Sensing and Cognition: Human Factors in Image Interpretation, edited by R. A. White, C. Arzu, and R. R. Hoffman, 1–18. Boca Raton: CRC Press.
- Johnson, M. H. 2012. “Phenomenological Approaches in Landscape Archaeology.” Annual Review of Anthropology 41: 269–284.
- Johnson, K. M., and W. B. Ouimet. 2014. “Rediscovering the Lost Archaeological Landscape of Southern New England using Airborne Light Detection and Ranging (LiDAR).” Journal of Archaeological Science 43: 9–20.
- Kalayci, T. 2016. “Settlement Sizes and Agricultural Production Territories: A Remote Sensing Case Study for the Early Bronze Age in Upper Mesopotamia.” STAR: Science & Technology of Archaeological Research 2: 217–234.
- Kantner, J. 2008. “The Archaeology of Regions: From Discrete Analytical Toolkit to Ubiquitous Spatial Perspective.” Journal of Archaeological Research 16 (1): 37–81.
- Kennedy, D. L. 1998. “Declassified Satellite Photographs and Archaeology in the Middle East: Case Studies from Turkey.” Antiquity 72: 553–561.
- Kennedy, D. L., and M. C. Bishop. 2011. “Google Earth and the Archaeology of Saudi Arabia. A Case Study from the Jeddah Area.” Journal of Archaeological Science 38: 1284–1293.
- Knapp, B., and W. Ashmore. 1999. “Archaeological Landscapes: Constructed, Conceptualized, Ideational.” In Archaeologies of Landscape: Contemporary Perspectives, edited by W. Ashmore and B. Knapp, 1–17. Oxford: Blackwell.
- Kouchoukos, N. 2001. “Satellite Images and the Representation of Near Eastern Landscapes.” Near Eastern Archaeology 64: 80–91.
- Lambers, K., W. B. Verschoof-van der Vaart, and Q. P. J. Bourgeois. 2019. “Integrating Remote Sensing, Machine Learning, and Citizen Science in Dutch Archaeological Prospection.” Remote Sensing 11 (7): 794.
- Lasaponara, R., and N. Masini. 2007. “Detection of Archaeological Crop Marks by Using Satellite QuickBird Multispectral Imagery.” Journal of Archaeological Science 34: 214–221.
- Lasaponara, R., and N. Masini. 2011. “Satellite Remote Sensing in Archaeology: Past, Present and Future Perspectives.” Journal of Archaeological Science 38: 1995–2002.
- Lawrence, D., G. Philip, H. Hunt, L. Snape-Kennedy, and T. J. Wilkinson. 2016. “Long term Population, City Size and Climate Trends in the Fertile Crescent: a First Approximation.” PLoS ONE 11 (3): e0152563.
- Lawrence, D., G. Philip, K. Wilkinson, J. P. Buylaert, A. S. Murray, W. Thompson, and T. J. Wilkinson. 2017. “Regional Power and Local Ecologies: Accumulated Population Trends and Human Impacts in the Northern Fertile Crescent.” Quaternary International 437 (Part B): 60–81.
- Limp, F. 1989. The Use of Multispectral Digital Imagery in Archeology. Arkansas Archeological Survey Research Series No. 34. Fayetteville, Arkansas: Arkansas Archeological Survey.
- Lin, A. Y.-M., A. Huynh, G. Lanckriet, and L. Barrington. 2014. “Crowdsourcing the Unknown: The Satellite Search for Genghis Khan.” PLoS ONE 9 (12): e114046.
- Linck, R., T. Busche, S. Buckreuss, J. W. E. Fassbinder, and S. Seren. 2013. “Possibilities of Archaeological Prospection by High-Resolution X-Band Satellite Radar—A Case Study from Syria.” Archaeological Prospection 20: 97–108.
- MacDonald, J. 2018. “A Scientific Look at Citizen Science.” JSTOR Daily. Accessed October 24, 2019. https://daily.jstor.org/a-scientific-look-at-citizen-science/.
- McCoy, M. D. 2017. “Geospatial Big Data in Archaeology: Prospects and Problems too Great to Ignore.” Journal of Archaeological Science 84: 74–94.
- McLeester, M., J. Casana, M. Schurr, A. Hill, and J. H. Wheeler III. 2018. “Detecting Prehistoric Landscape Features Using Thermal, Multispectral, and Historical Imagery Analysis at Midewin National Tallgrass Prairie, Illinois.” Journal of Archaeological Science: Reports 21: 450–459.
- Megarry, W. P., G. Cooney, D. Comer, and C. E. Priebe. 2016. “Posterior Probability Modeling and Image Classification for Archaeological Site Prospection: Building a Survey Efficacy Model for Identifying Neolithic Felsite Workshops in the Shetland Islands.” Remote Sensing 8 (6): 529.
- Megarry, W., C. Graham, B. Gilhooly, B. O’Neill, R. Sands, A. Nyland, and G. Cooney. 2018. “Debitage and Drones: Classifying and Characterising Neolithic Stone Tool Production in the Shetland Islands Using High Resolution Unmanned Aerial Vehicle Imagery.” Drones 2 (2): 12.
- Menze, B. H., and J. A. Ur. 2012. “Mapping Patterns of Long-Term Settlement in Northern Mesopotamia at a Large Scale.” Proceedings of the National Academy of Sciences 109 (14): E778–E787.
- Opitz, R., and D. Cowley, eds. 2013. Interpreting Archaeological Topography: Lasers, 3D Data, Observation, Visualisation and Applications. Oxford: Oxbow.
- Opitz, R., and J. Herrmann. 2018. “Recent Trends and Long-Standing Problems in Archaeological Remote Sensing.” Journal of Computer Applications in Archaeology 1: 19–41.
- Parcak, S. 2019. Archaeology from Space: How the Future Shapes our Past. New York: Henry Holt and Co.
- Philip, G., D. Donoghue, A. Beck, and N. Galiatsatos. 2002. “CORONA Satellite Photography: An Archaeological Application from the Middle East.” Antiquity 76 (291): 109–118.
- Ramsey, D. 2016. “UC San Diego Cyber-Archaeology Researchers Launch Crowdsourcing Portal to Monitor At-Risk Sites.” UC San Diego News Center.
- Rayne, L., J. Bradbury, D. Mattingly, G. Philip, R. Bewley, and A. Wilson. 2017. “From Above and on the Ground: Geospatial Methods for Recording Endangered Archaeology in the Middle East and North Africa.” Geosciences 7 (4): 100.
- Ringer, R. V., and L. C. Loschky. 2018. “Head in the Clouds, Feet on the Ground: Applying Our Terrestrial Minds to Satellite Perspectives.” In Remote Sensing and Cognition: Human Factors in Image Interpretation, edited by R. A. White, A. Coltekin, and R. R. Hoffman, 63–86. Boca Raton: CRC Press.
- Sadr, K. 2016. “The Impact of Coder Reliability on Reconstructing Archaeological Settlement Patterns from Satellite Imagery: A Case Study from South Africa.” Archaeological Prospection 23: 45–54.
- Salvi, M. C., R. Salvini, A. Cartocci, S. Kozciak, R. Gallotti, and M. Piperno. 2011. “Multitemporal Analysis for Preservation of Obsidian Sources from Melka Kunture (Ethiopia): Integration of Fieldwork Activities, Digital Aerial Photogrammetry and Multispectral Stereo-IKONOS II Analysis.” Journal of Archaeological Science 38 (9): 2017–2023.
- Savage, S. H., A. Johnson, and T. E. Levy. 2017. “TerraWatchers, Crowdsourcing, and At-Risk World Heritage in the Middle East.” In Heritage and Archaeology in the Digital Age, edited by M. L. Vincent, V. M. López-Menchero Bendicho, M. Ioannides, and T. E. Levy, 67–77. New York: Springer.
- Schenk, T., B. Csathó, and S. W. Shin. 2003. “Rigorous Panoramic Camera Model for DISP Imagery.” Proceedings of Joint Workshop of ISPRS Working Groups I/2, I/5, IC WG II/IV and EARSeL Special Interest Group, 3D Remote Sensing, High Resolution Mapping from Space. Accessed October 24, 2019, http://www.ipi.uni-hannover.de/fileadmin/institut/pdf/schenk.pdf.
- Schneider, A., M. Takla, A. Nicolay, A. Raab, and T. Raab. 2015. “A Template-Matching Approach Combining Morphometric Variables for Automated Mapping of Charcoal Kiln Sites.” Archaeological Prospection 22: 45–62.
- Schuetter, J., P. Goel, J. McCorriston, J. Park, M. Senn, and M. Harrower. 2013. “Autodetection of Ancient Arabian Tombs in High-Resolution Satellite Imagery.” International Journal of Remote Sensing 34 (9): 6611–6635.
- Sohn, H. G., G. H. Kim, and J. H. Yom. 2004. “Mathematical Modelling of Historical Reconnaissance Corona KH-4B Imagery.” The Photogrammetric Record 19 (105): 51–66.
- Stichelbaut, B. 2006. “The Application of First World War Aerial Photography to Archaeology: The Belgian Images.” Antiquity 80 (307): 161–172.
- Stichelbaut, B., W. De Clercq, D. Herremans, and J. Bourgeois. 2013. “First World War Aerial Photography and Medieval Landscapes: Moated Sites in Flanders.” In Archaeology From Historical Aerial and Satellite Archives, edited by W. Hanson, and I. Oltean, 69–85. New York: Springer.
- Stone, E. C. 2008. “Patterns of Looting in Southern Iraq.” Antiquity 82: 125–138.
- Stott, D., S. M. Kristiansen, A. Lichtenberger, and R. Raja. 2018. “Mapping an Ancient City with a Century of Remotely Sensed Data.” Proceedings of the National Academy of Sciences 115 (24): E5450–E5458.
- Ur, J. A. 2003. “CORONA Satellite Photography and Ancient Road Networks: A Northern Mesopotamian Case Study.” Antiquity 77: 102–115.
- Ur, J. A. 2010. Urbanism and Cultural Landscapes in Northeastern Syria: The Tell Hamoukar Survey, 1999–2001. Oriental Institute Publications No. 137. Chicago: Oriental Institute Press.
- Ur, J. A. 2013. “Spying on the Past: Declassified Intelligence Satellite Photographs and Near Eastern Landscapes.” Near Eastern Archaeology 76: 28–36.
- Wernke, S., J. Adams, and E. Hooten. 2014. “Capturing Complexity.” Advances in Archaeological Practice 3: 147–163.
- Wilkinson, K. N., A. Beck, and G. Philip. 2006. “Satellite Imagery as a Resource in the Prospection for Archaeological Sites in Central Syria.” Geoarchaeology 21 (7): 735–750.
- Wilkinson, T. J. 2003. Archaeological Landscapes of the Near East. Tucson: University of Arizona Press.
- Wolfinbarger, S., J. Drake, E. Ashcroft, and K. Hanson. 2017. “Ancient History, Modern Destruction: Assessing the Current Status of Syria’s World Heritage Sites Using High-Resolution Satellite Imagery.” American Association for the Advancement of Science (AAAS) Executive Summary. Accessed October 24, 2019. https://www.aaas.org/page/ancient-history-modern-destruction-assessing-current-status-syria-s-world-heritage-sites-using.
- Zingman, I., D. Saupe, O. A. B. Penatti, and K. Lambers. 2016. “Detection of Fragmented Rectangular Enclosures in Very High Resolution Remote Sensing Images.” IEEE Transactions on Geoscience and Remote Sensing 54: 4580–4593. DOI: 10.1109/TGRS.2016.2545919.