
ABSTRACT
We report the results of drone lidar survey at a high-elevation archaeological site in the Chachapoyas region of Peruvian Amazonia. Unlike traditional airborne remote sensing, drone lidar produces very high-density measurements at a wide range of scan angles by operating at low altitudes and slow flight speeds. These measurements can resolve near vertical surfaces and novel dimensions of variability in architectural datasets. We show in a case study at Kuelap that the number of detected structures almost exactly matches the number reported from previous ground level surveys, and we use these data to quantify the relative circularity and size frequency distribution of architectural structures. We demonstrate variability in domestic architecture that was obscured in previous models produced using low-resolution remote sensing. Spatial analysis of these attributes produces new hypotheses about the site’s construction history and social organization.
Introduction
Airborne lidar (light detection and ranging) has revolutionized the mapping of archaeological sites and landscapes over the last 15 years. Lidar’s combination of automated, active, high density, and long-distance signal emission has proven to be increasingly effective at generating high resolution ground models of archaeological sites located in a wide variety of field conditions, including areas of dense vegetation. Flown on aerial platforms, lidar sensors are capable of producing datasets that are “big” in two senses: 1) they have higher levels of spatial resolution (and file sizes) than satellite remote sensing datasets and even image-based models; and 2) they achieve wider geographic coverage than is often possible through terrestrial laser scanning (TLS). Analytically, lidar datasets (even those with limited geographic footprints) may illustrate one of the key characteristics of big aerial data—the revelation of new dimensions of variability (and, sometimes, unexpected insights) in mapped phenomena, by virtue of their resolution, scale, and/or ability to capture previously unmapped features.
To be sure, some airborne lidar surveys have merely served to confirm existing interpretations of archaeological landscapes rather than generating novel insights about them. Yet a great number of surveys have indeed enabled scholars to create extensive ground models of unmapped sites and yielded transformational insights into the scale and character of urban and agricultural landscapes, particularly in forested environments (Canuto et al. Citation2018; Chase et al. Citation2011; Chase et al. Citation2012; Chase et al. Citation2014; Fisher and Leisz Citation2013; Fisher et al. Citation2016; Garrison, Houston, and Alcover Firpi Citation2019; Golden et al. Citation2016; Hesse Citation2010; Masini, Coluzzi, and Lasaponara Citation2011; Opitz et al. Citation2015).
The eastern slopes of the Peruvian Andes (also known as the montaña or ceja de selva—the “eyebrow of the jungle”) are a region in which airborne lidar holds a great deal of promise for mapping previously un-surveyed archaeological landscapes and capturing new dimensions of variability within them. Decades of excavations and pedestrian reconnaissance have demonstrated that the montaña has a deep history of human occupation and that late Prehispanic population sizes were, in many areas, substantially larger than those found in the region today (Bonavia Citation1981; Church Citation1996; Church and Von Hagen Citation2008; Clasby Citation2014; Guengerich Citation2015; Le Moine and Raymond Citation1987; Raymond Citation1992; Schjellerup Citation2003). As population declined after the Spanish invasion due to colonial violence, disease, and migration, many settlements, terracing systems, and grazing lands were abandoned, and tropical forest vegetation recolonized landscapes that had formerly been the sites of intensive economic exploitation and habitation. As a result, many sections of the ceja de selva now contain extensive anthropogenic features that are obscured by dense overgrowth, making them quite difficult to map on an individual basis and impeding the progress of systematic pedestrian survey.
More than simply presenting practical challenges for archaeological fieldwork, landcover and topography in the eastern slopes have also impeded scientific understanding of regional history, obscuring the place of the montaña in regional social developments, including those linking the Andes and the Amazon. For much of their postcolonial history, the eastern slopes have been treated as a marginal region caught between the “green hell” or “counterfeit paradise” of the lowland Amazon (Meggers Citation1971; Goodland and Irwin Citation1975) and the supposedly more developed highland and coastal regions of the Andes (Church Citation1996; Church and Von Hagen Citation2008; Church and Guengerich Citation2017). Even as scientific investigations at sites in the ceja de selva have been carried out since the mid 20th century (e.g., Reichlen and Reichlen Citation1950; Ruiz Estrada Citation1972, Citation1979; Thompson Citation1976), explorers and the tourist industry have continued to portray the area as mysterious and impenetrable (Savoy Citation1970). Archaeologists working up and down the eastern edge of the cordillera have chipped away at these myths, illustrating the diversity of montaña archaeology and socio-cultural formations (Church Citation1996; Guengerich Citation2014; Narváez Vargas Citation2013; Schjellerup Citation1997; Wilkinson Citation2013). In parallel, research in the lowland Amazon has demonstrated that that region was far more populated in Precolumbian times than once presumed (Arroyo-Kalin Citation2010; Clement et al. Citation2015; Heckenberger et al. Citation2008; Heckenberger Citation2005; Levis et al. Citation2017; Neves et al. Citation2003; Stahl Citation2002) and that some innovations and cultural traditions later shared across extensive areas of the Andes may have arisen in Amazonia (Valdez Citation2008; Valdez Citation2007; Clasby Citation2014). Together, these developments have reframed the importance of the eastern slopes to continental archaeology and seeded the development of a robust regional research community.
Yet landcover and topography continue to present methodological challenges for research in the ceja de selva. Because of the difficulty of conducting conventional pedestrian survey, regional histories of the eastern slopes of the Peruvian Andes continue to rely on site-based research and chronologies, and substantial disagreements remain concerning major demographic, social, and political developments. On the level of individual sites, vegetation cover impedes the use of many analog and digital technologies for recording settlement structure and architectural variation. Tree cover obscures GNSS signals and makes detailed work with optical instruments such as theodolites and total stations so time-consuming that individual structures often cannot be recorded in great detail. As a result, site maps necessarily represent structures as somewhat simplified polygons and lines, in a process of distillation and projection similar to that carried out by archaeologists in another forest-covered region, lowland Mesoamerica (Hutson Citation2012). In such contexts, the simplification of architectural form is a practical necessity that still allows for a great deal of insight into the organization of individual settlements. However, it can also conceal meaningful variation. As previous researchers have shown, attention to subtle differences in architectural style and execution may reveal the work of individual builders and outline the contours of local traditions, enabling archaeologists to “people” the past and to build more fine-grained understanding of social life and site chronology (Tringham Citation1991; Guengerich Citation2014; Halperin and Schwartz Citation2016).
Lidar, both terrestrial and airborne, provides means for improving the capture of subtle variation in architectural form, across large areas, in challenging field conditions. Because of its proven ability to create ground models in densely forested contexts more efficiently than TLS, airborne lidar will form an important component of solutions for both regional and local mapping projects on the eastern slopes of the Andes (Khan, Aragão, and Iriarte Citation2017). However, among Andeanists, there has been some skepticism of lidar’s potential contributions to mapping sites in the montaña. In 2016, a consortium called the Peru Lidar Project (www.facebook.com/mplidar/) conducted limited airborne lidar survey over Machu Picchu Archaeological Park and Río Abiseo National Park, both located in heavily forested regions of the selva alta. Subcanopy point densities from these flights proved to be too low to resolve major archaeological features, in part due to the density of understory vegetation. These limited results have led to a perception among some archaeologists working in the region that airborne lidar has limited applications in the eastern slopes of the Andes.
Our experience employing drone lidar for localized mapping at Kuelap suggests that more satisfying results can be achieved through modifications to instrumentation and flight parameters. As with any application of imaging technology, successful data collection depends on careful pairings of hardware and collection parameters with project areas and research questions. The configurations of drone lidar that we employ here offer one solution to mapping relatively small areas of forest and underlying terrain in great detail. We illustrate its potential and limitations through data collection at the site of Kuelap, located in the middle Utcubamba River Valley of the Peruvian department of Amazonas, an area typically affiliated with the Chachapoya.
Background
Kuelap and the Chachapoya
Alongside the sections of Cuzco’s Urubamba valley made famous by the archaeological site of Machu Picchu, the Chachapoyas region is perhaps the sector of the Peruvian montaña that is best known to archaeologists, if not also the general public. Described in early Spanish colonial chronicles as a province of the Inka empire, Chachapoyas became an administrative unit of the Spanish Viceroyalty following its occupation in the 1540’s C.E. These same sources frequently credit the people of this province with holding off an Inka invasion in the 1450’s C.E., before succumbing to a second campaign around 1470 C.E., earning them a reputation for ferocity and military prowess—albeit one that may reflect Inka imperial propaganda more than lived experience (Toyne and Narváez Citation2014).
For generations, archaeologists have also used the word Chachapoya to describe a complex of supposedly common cultural traits found among Late Intermediate Period (ca. 1100–1450 C.E.) archaeological sites, to the east of the Marañón River ranging from beyond the furthest southern border of what is now Rio Abiseo National Park, in the department of La Libertad, to as far north as the confluence of the Utcubamba and Marañón Rivers (). Early models presumed that these traits—which include hilltop settlements comprised of circular houses, sometimes with large platform bases and exterior mosaic friezes, as well as certain decorative motifs in pottery and textiles—outlined a cultural unity that underlay the apparent regional political coherence presented in the chronicles (Church Citation1996: Church and Guengerich Citation2017). However, historical research suggests that the political and ethnic landscapes of the eastern slopes of Amazonas, La Libertad, and San Martin departments were quite fragmented (Espinoza Soriano Citation1967; Ruiz Estrada Citation2017), and recent archaeological research has highlighted additional diversity in material culture, casting doubt on the unity of Chachapoya culture, even as some elements of shared traditions remain evident (Crandall Citation2017; McCray Citation2017; Church and Guengerich Citation2017).
Figure 1. Map of Kuelap’s location within Peru and the department of Amazonas; locations mentioned in text highlighted.
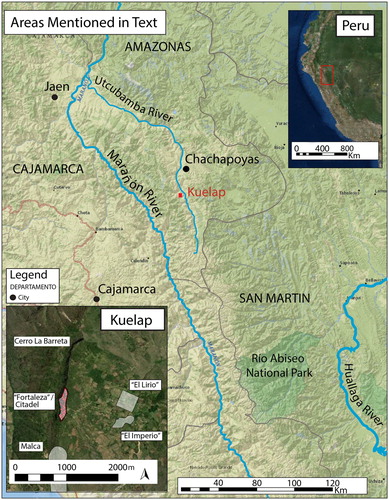
The archaeological site of Kuelap, centered on a limestone ridge at 3000 meters above sea level on the western flank of the Utcubamba River Valley, has been almost inseparable from the identity of the Chachapoya as an archaeological culture since the times of its initial description in the 19th and early 20th century. Comprised of remains spread over as many as 460 hectares and dating from at least the Middle Horizon (800–1100 C.E.) through the Late Intermediate Period (1100–14570 C.E.), Late Horizon / Inka (1470–1535 C.E.), Spanish Colonial (1535–1821 C.E.), and Republican (1821 C.E.–present) periods, Kuelap is nevertheless often equated with the so-called “fortress” or citadel, a walled settlement that lies atop the limestone mass of Cerro la Barreta (Church and Von Hagen Citation2008, 914). Its monumental exterior walls, which consist of worked limestone blocks stacked between 10 to 20 meters above the ground surface and extending some 1500 meters around the ridgetop (a measurement that includes walls flanking the site’s three main entrances), have attracted the interest of explorers and archaeologists for generations (Bandelier Citation1907; Langlois Citation1940; Reichlen and Reichlen Citation1950; Ruiz Estrada Citation1972; Bradley Citation2005; Narváez Vargas Citation2013; Toyne and Narváez Citation2011).
While tourist literature has taken to promoting Kuelap as a “new Machu Picchu” and frequently depicted the site as being a mysterious settlement in the jungle, the terrain around it is in fact quite diverse, consisting of a patchwork of tropical forest, scrubland, and agricultural fields. During state-sponsored archaeological and conservation work in the walled settlement between 2003 and 2011, tree cover was substantially reduced for the purpose of architectural conservation and consolidation. Still, remaining tree cover poses significant challenges for capturing the site surface using total stations, high resolution terrestrial GNSS and aerial photography. Detailed mapping was conducted by Alfredo Narváez Vargas in 1986–1987, but published versions of that map and more recent cartography of the site are primarily focused on representing the relative number and position of structures and do not capture fine-grained variation in individual constructions (e.g., Narváez Vargas Citation2013, 122–123; Toyne and Narváez Citation2014, 345).
Kuelap is surely the most extensively studied of all sites located in the Utcubamba river valley, if not the Chachapoyas region as a whole (Guengerich Citation2015, 367), but a number of essential questions remain about its history and construction. The site’s architecture abounds in defensive affordances: the citadel is built atop a ridgetop with a cliff on one side, is surrounded by massive walls, and has highly restricted access via three narrow, stepped entryways that are themselves flanked by high stone walls. In the northwestern sector of the citadel, the “upper town” (pueblo alto) is further separated from the rest of the settlement by walls 5–10 meters high, with two narrow access points quite similar to those that penetrate its exterior walls. Other evidence suggests that Kuelap witnessed at least occasional moments of conflict during its history. At the far northern portion of the walled settlement, adjacent to the D-shaped torreón, excavations uncovered a cache of over 2500 sling stones, the most common form of projectile weapon used in the Precolumbian Andes (Narváez Vargas Citation2013, 138; Church and Von Hagen Citation2008, 916). Toyne and Narváez (Citation2014, 351) also present evidence of a “massacre” in which 94.3% of the observable collection of 66 skulls of individuals buried in the site’s plataforma circular (circular platform) showed evidence of perimortem blunt force trauma. Differences in chronological scenarios discussed by Narváez Vargas (Citation2013) and Toyne and Narváez (Citation2014) suggest that dating of this deposit to the Late Intermediate, Inka, or even Spanish colonial periods is not yet definitive. Yet both Bradley (Citation2005; Citationn.d.) and Narváez Vargas (Citation2013) also suggest that the classification of the site as a “fortress” is overly simplistic, noting the remains of highly ritualized activities in many sectors of the site, including great numbers of human burials associated with exterior walls. Excavations in the idiosyncratic structure known as the tintero (ink well), a solid mass of stone and fill with a bulb-shaped shaft down its middle, have produced numerous secondary human burials, carved Spondylus shell figures and exotic styles of pottery. Narváez interprets these remains as evidence that the structure functioned as the primary ritual locus of the walled settlement, and he has accordingly renamed it the templo mayor (main temple).
Site chronology is also a matter of debate. Based on stylistic similarities between some pottery found in lower levels of excavations, Arturo Ruiz Estrada (Citation1972) has suggested that Kuelap was occupied since at least the Middle Horizon (800–1100 C.E.)—an hypothesis echoed by Narváez (Citation1987, Citation2013). The site’s dates of foundation have reportedly been pushed back even further via radiocarbon dating of samples from the templo mayor (Narváez Vargas Citation2013, 150), but the results remain unpublished. More fine-grained dating of structures and occupations (particularly those located near the surface) has yet to be conducted, though Narváez (Citation2013) suggests that many of these structures may have been constructed following the Inka invasion. Inka imperial pottery and prominent Inka constructions conventionally called kallankas (long, multi-doored feasting halls) are indeed located near the southern and northern limits of the site, one closely aligned with a vein of exposed bedrock within the upper town, the other built directly atop circular structures in the south. These features make it clear that Kuelap was also actively incorporated into the Inka empire. Isolated finds of post-conquest material culture point to continued activity following the Spanish invasion of the Utcubamba valley (Narváez Vargas Citation2013, 151, 155–156). As we discuss below, variation in structural morphology recorded in ground models of the site frame additional hypotheses about its construction sequence, which might be tested with further excavations and dating.
Previous excavations in the citadel have already generated insights into the character and pacing of Kuelap’s construction. Behind the exterior walls, archaeologists have revealed an enormous mass of rubble and earthen fill (Ruiz Estrada Citation2009, 39–45), but the exposed bedrock within the upper town indicates that not all of the space seemingly “behind” the exterior walls is filled with undifferentiated rubble. Rather, like many Precolumbian monuments built in the Peruvian highlands and coast, the walled settlement is a modified mountaintop whose architects incorporated underlying rock formations into its construction. Still, the immensity of the fill and its stone facing, as well as “clearly defined segments” within the fill itself—which recall the columned segments of adobe bricks in coastal monuments such as the Huaca de la Luna (Hastings and Moseley Citation1975; Shimada and Cavallaro Citation1985)—suggest to Narváez (Citation2013, 140) that it must have been built over centuries rather than in one single flurry. Excavations sponsored by Peru’s Plan COPESCO between 2016 and 2018 have also revealed evidence of at least one previous construction stage near the site’s main entrance, in the form of an earlier worked stone wall, nested more than ten meters within the outermost one (Jorge Chiguala, personal communication 2017). Coupled with Ruiz’s (Citation1972, Citation2009, 15) inference that the upper town is the oldest portion of the site (because excavations within it produced the oldest ceramics), these patterns make it possible that the Kuelap citadel grew in stages from west to east and perhaps north to south. We return to this theory in the discussion and conclusion section below.
Further debate centers on sociopolitical organization at Kuelap during the Late Intermediate Period. Many early interpretations took the site’s monumental walls as evidence that it must have served as a center of concentrated political power (Gil Citation1938; Brush Citation1977). Narváez (Citation2013, 131) argues that the exceptionality of Kuelap’s architecture and occupation makes it likely that the site served as the “political capital of the Chachapoyas kingdom” whose “power was capable of mobilizing the collective labor of diverse affiliated nations under its rule … [and] of organizing the political control of a vast territory whose limits reached the Marañón river in the west and the Huallaga River in the east” (my translation). In contrast, Church and Von Hagen (Citation2008), Guengerich (Citation2015) and Church and Guengerich (Citation2017) note that while the site’s monumental walls are indeed exceptional, Kuelap’s size does not place it atop the kinds of settlement hierarchies that are typical of highly centralized political systems. Indeed, the number of structures at the site (and likely, population numbers) are not exceptional when compared to other large sites in Amazonas and La Libertad, such as Caserones (Schjellerup Citation1997), Purun Llaqta de Cheto (Ruiz Estrada Citation2004), and Olán / La Jalca (Lerche Citation1986). Moreover, archaeological excavations at the site have yet to identify unequal distributions of high-quality foods or prestige goods in domestic structures, suggesting relatively little in the way of materialized class distinctions.
Lidar and Drones
Lidar is a relatively old technology that has undergone significant advances in recent years. Both laser scanning and the term “lidar” (sometimes also rendered as “LiDAR,” “LIDAR,” or “Lidar”) have existed since the 1960’s, but the technology’s use in civilian mapping applications was limited before precision GPS and IMUs (inertial measurement units) became available in the 1990’s. The development of higher rates of pulse emission and more accurate positioning systems has allowed sensors mounted on crewed aircraft to collect high-resolution spatial datasets over expansive geographic areas. Initial deployment of airborne lidar for environmental applications produced some datasets useful for archaeologists, but the high cost of sensors themselves, as well as the associated costs of deployment (including flight time and fuel) greatly limited archaeologically-specific lidar missions until the 2000’s. In the UK and Ireland, the earliest archaeological lidar missions focused on mapping relatively small sites and landscapes with little vegetation cover (e.g., Shell and Roughley Citation2004; Devereux et al. Citation2005; Bewley, Crutchley, and Shell Citation2005). While measurement rates (33,000 pulses per second achieved by the likes of the Optech ALTM 3033 sensor used by Shell and Roughley Citation2004) and point densities (between one point per .5 and 2 square meters Shell and Roughley Citation2004; Bewley, Crutchley, and Shell Citation2005) offered significant improvement over many previous datasets used for the production of digital elevation models, they still proved too low when flown on relatively fast-moving light aircraft to allow for effective penetration of forest cover.
The applications of aerial laser scanning in archaeology expanded following the development of sensors with higher scan speeds and measurement rates, allowing for significantly higher point densities and measurements of ground surfaces below forest cover in some conditions. Airborne lidar gained new visibility in Americanist archaeology following the publication of large-scale surveys by Chase and colleagues (Citation2011; Citation2012) at the Maya settlement of Caracol, Belize and Fisher and Leisz (Citation2013) at Angamuco, Mexico. In both circumstances, resulting terrain models revealed scales and densities of constructions and anthropogenic landscape modifications that greatly exceeded earlier estimates based on pedestrian survey. Evans et al. (Citation2013) achieved similar results at Angkor, Cambodia, demonstrating that the number of structures in the settlement and the area of modified landscapes around it was far greater than previously estimated. These studies have sparked a veritable explosion of interest in the use of lidar for mapping archaeological sites in forested terrain, which has only grown with the publication of additional impactful research (Chase et al. Citation2014; Garrison, Houston, and Alcover Firpi Citation2019; Canuto et al. Citation2018).
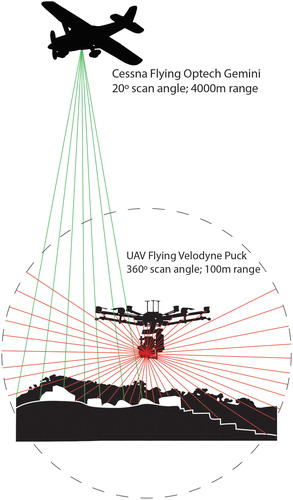
Among Americanist archaeologists, this family of applications—which for the purpose of shorthand, we refer to here as “big tropical forest lidar”—has become almost synonymous with aerial laser scanning. But while sensors with long ranges, flown on crewed aircraft, have proven to be transformative tools for mapping sites under forest cover in relatively flat terrain, they are merely one of an expanding array of instrumental configurations, and they face notable challenges in some conditions. Notably, the fact that large aircraft need to fly at high altitudes over ground surfaces and forest canopies (both for safety reasons and to avoid disturbing some features they seek to image, such as vegetation) limits both their positional accuracy and their ability to resolve smaller objects and complex three-dimensional surfaces. Because GPS errors accumulate as the distance between target and antenna increases, higher flight altitudes result in worse horizontal placement of laser pulses (Kellner et al. Citation2019, 6). Moreover, they also produce larger laser footprints due to beam divergence, and scan angles (that is, the angles of emission of the laser pulse with respect to nadir) are restricted to increasingly narrow ranges (Kellner et al. Citation2019, 6; Figure 2). Terrestrial laser scanning (TLS) offers the advantage of much higher point densities and smaller beam footprints, but can be quite tedious to deploy because TLS instruments need to be moved incrementally in order to ensure scanning of objects from multiple angles. Moreover, TLS may perform poorly for scanning the tops of high features such as walls or trees (Calders et al. Citation2017; Disney et al. Citation2018).
Two recent advances—commercial UAVs capable of carrying substantial payloads and lighter, higher resolution lidar sensors—offer major advantages for some archaeological mapping applications. Relatively few published archaeological studies have employed drone lidar, but existing literature has reported some enhancements vs. sensors mounted on crewed aircraft (Khan, Aragão, and Iriarte Citation2017; Risbøl and Gustavsen Citation2018). The smaller size of UAVs in comparison to crewed aircraft allows them to fly closer to the surfaces of archaeological sites while following national laws and safety guidelines. UAVs can also fly at slower speeds than crewed aircraft. Deployed lower altitudes, in slower moving craft, UAV-mounted lidar sensors are capable of collecting higher density datasets with smaller beam footprints and improved horizontal beam placement. Moreover, as Risbøl and Gustavsen (Citation2018) note, lower flights also enable sensors to capture objects at a greater range of scan angles, improving imaging of more vertical surfaces and complex objects—a characteristic that should prove particularly valuable for the documentation of archaeological features in the montaña, such as high walls, cliff tombs, stone reliefs, and settlements located on very steep slopes (see ).
Figure 2. Comparison of the effects of sensor parameters and flight altitudes on scan angles.
Using drones to fly lidar sensors can also pose several challenges for archaeological applications. Battery-powered UAVs—particularly, multi-copters—have much shorter maximum flight times than fueled aircraft, which limits the total amount of data that can be collected in a single flight and also places practical restrictions on the locations in which drone lidar can be deployed. Even in countries where it is legal to fly battery-powered UAVs beyond line-of-sight, aircraft must be launched relatively close to the sites one wishes to capture, to avoid using up battery power simply flying to and from the desired points of data collection. Finding open areas that provide clear sight lines during flight can be particularly challenging in heavily forested terrain. Moreover, the large lithium ion batteries that are necessary for powering motors capable of lifting heavier craft and sensors have significant transport restrictions. Fuel-powered UAVs and fixed-wing UAVs are quite promising for improving flight times and avoiding some of these challenges (Khan, Aragão, and Iriarte Citation2017; Kellner et al. Citation2019), but even the largest commercially available drones have ranges that are significantly shorter than crewed aircraft. Furthermore, restrictions on the import, export, and deployment of larger drones often make it challenging to use them outside of the countries where they are built and stored.
Our experience using drone lidar reflects some of these limitations. Import restrictions on our first-choice drone—a large, fuel-powered UAV—led us to pursue a second option involving use of a mass-produced, battery-powered multi-copter. Internal shipping restrictions then limited the number of batteries to which we had access, which impacted how much data we could collect in one day. At elevations between 2800 and 3000 meters, we experienced reduced flight times (on average, 10 minutes of data collection time per flight) even while employing propellers designed for use at high elevations, which limited our ability to fly aircraft at greater distances from our launch points. Despite these challenges, our results demonstrate the transformational potential of drone lidar for mapping some archaeological sites in forested terrain.
Methods
Instrumentation
Our instrumentation for this project consisted of a hyperspectral imager, a lidar sensor, and a GPS-IMU (Global Positioning System and Internal Measurement Unit) flown on a commercial hexacopter. The core of the data acquisition system was the Headwall Hyperspec Nano, which contains both a Visible/Near Infrared (VNIR) hyperspectral line scan imager and a data acquisition and control computer. During research flights, hyperspectral data were also collected, but analysis of that data is still ongoing and we do not discuss results in this paper. In addition to capturing the spectral image data, the Hyperspec Nano stored raw lidar return data and real-time data from the payload GPS-IMU, an Applanix APX-15. Following collection, raw lidar data were sent from the sensor to the Nano as a stream of packets encoded in the User Datagram Protocol and high frequency GPS-IMU data were downloaded directly from the GPS/IMU unit. The GPS data were post-processed using simultaneously acquired data from a Trimble GNSS Smart Target Base Station in Applanix POSPac UAV software to generate a Smoothed Best Estimate of Trajectory (SBET) GPS-IMU file and a geolocated point cloud.
The aircraft used for these measurements was a DJI Matrice 600 Pro, outfitted with high altitude propellers. The sensor package was mounted on a three-axis actively stabilized DJI Ronin gimbal, with the GPS antenna mounted on top of the aircraft. The lidar sensor, a Velodyne Puck, was mounted so that its axis of rotation was parallel to the direction of motion of the aircraft, so that approximately half the time the lasers were directed toward the ground and could potentially generate returns. The Puck has 16 lasers, each paired with a detector, producing six nanosecond pulses at 903 nanometers. In the configuration used here, the laser/detector pairs rotated at approximately 10 Hz and generated approximately 300,000 pulses per second. The lidar system was set to collect the strongest returns from each pulse. Collecting dual returns (strongest and last) would have provided better penetration of the canopy, and potentially more points on the ground below trees.
Survey flights were flown under automatic control, using the UgCS flight control program. Flight patterns programmed to cover the survey area in parallel flight paths with approximately 40% overlap between the fields of view of the hyperspectral imager. The overlap of the lidar data between flight lines was significantly larger. Flights were programmed to be at an altitude of approximately 50 m above ground level, following a 30m-resolution DEM generated by the Shuttle Radar Topography Mission (SRTM). The raw lidar data, along with the SBET GPS/IMU data were processed with Headwall Photonics’ LiDAR Tools program, which produced point clouds in LAS format.
Data Processing
Both automated and manual processing methods were used to produce a model of the ground and architectural structures at Kuelap using free and open-source tools. First, all lidar returns were automatically classified as ground or non-ground using the lidR package in R (version 3.5.1) (R Core Team Citation2013; Rousell and Auty Citation2019). To enable processing on a desktop workstation (64-bit with 12 GB RAM) while minimizing edge effects on classification, lidar data were re-tiled to 100 m by 100 m subsets with 5 m overlap prior to ground classification, resulting in 37 separate tiles. The ground classification algorithm in lidR uses progressive morphological filtering to identify and remove non-ground objects using height thresholds for neighboring points in increasingly large windows (Zhang et al. Citation2003). For this application, ground classification parameters were chosen to remove as much vegetation as possible while retaining all architectural structures as “ground” points. To achieve this goal, the ground classification was performed using a single threshold height taller than the architectural structures in the landscape (5.5 m) and using a sequence of window sizes (0.6, 0.8, and 1.0 m) that produced consistently good results, as determined by visual inspection on subsets of the landscape. This automated ground classification procedure was successful in removing tall vegetation, but in order to retain architectural structures of interest tree trunks and other vegetation shorter than 5.5 m were not correctly classified as non-ground. Additionally, some points were erroneously classified as “non-ground” along the tall outer walls of Kuelap ().
Figure 3. 40 × 40 m tile representing classification procedures. Ground depicted with elevation color ramp. Non-ground points identified through automatic classification shown in black. Non-ground points identified through manual classification shown in white.
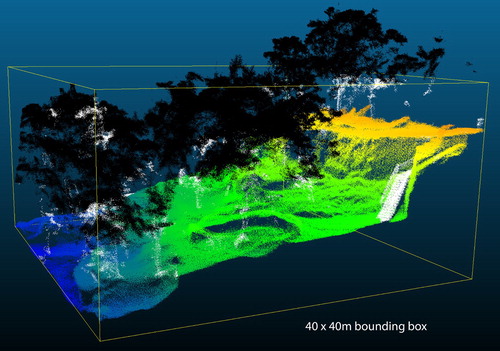
Automatically-classified lidar data were further edited manually to remove tree trunks, short vegetation, and structures not of archeological interest (e.g., wooden handrails along tourist routes within the site, and wooden architectural supports added by conservators to support stone structures at risk of collapse). To facilitate manual inspection, the lidar point cloud was re-tiled to 40 m by 40 m subsets with no overlap, resulting in a total of 77 tiles. All manual editing was completed using CloudCompare, an open-source platform for visualizing and processing point clouds (CloudCompare Citation2019). For each tile, the automated ground classification was loaded as a scalar field and the point cloud was split into ground or architectural structure (scalar field = 2) and non-ground vegetation (scalar field = 1) using the “Filter by value” scalar field function. Then, manual edits to the automated classification values were made using the segment and merge features. This method led to great success in generating a ground model of the site, though some recent architectural features added to the site—particularly, low wooden walkways located quite close to the ground surface—were too little separated from the site’s archaeological features to allow for them to be effectively edited out of the point cloud. However, they did not significantly obscure structures of archaeological interest.
After manual editing, a surface mesh was made of the walled settlement. To create the surface mesh, all lidar points from ground and architectural structures were loaded into CloudCompare. A height raster of the area was created using the “Rasterize” projection tool, selecting the maximum point height in each grid cell and interpolating the value of any empty cells. The raster was made using a 0.1 m grid size, then the raster grid was exported as a mesh. The surface mesh was smoothed using the “Smooth (Laplacian)” mesh function with 10 iterations and a smoothing factor of 0.1. To enable visualization and further measurement of architectural structures, the scene was given a uniform color (grey), set to top view, and shaded using the “EDL Shader” display function.
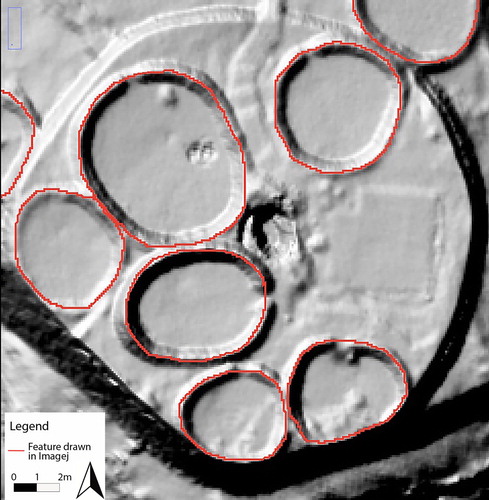
Following mesh generation, the resulting, georeferenced hillshade was imported into Imagej version 1.8.0, an open source image processing program that runs Java (Rasband Citation1997). Initially developed for research with imagery produced in microbiological research, Imagej provides a suite of tools that allow for efficient creation of two-dimensional vector features and their morphological analysis. Outlines of each building foundation were carefully traced using the Freehand Selection Tool in Imagej, to create a total of 421 individual polygons (see ). The Measure tool in Imagej was then used to generate a series of measurements for each traced feature—area, perimeter, centroid coordinates (X and Y), aspect ratio (major axis / minor axis), circularity (4*area/perimeter^2, such that a perfect circle has value of 1 and an increasingly elongated shapes approach a value of 0), and roundness (4pi*area/(pi*major_axis^2, which is also the inverse of the aspect ratio). These measurements were then exported as a table and loaded into ArcMap 10.6, where coordinate values of feature centroids were re-projected to create a point feature class. The measurements table from Imagej was then re-joined to this point feature class, and spatial analyses including hotspot analysis (Getis-Ord Gi*) were performed on feature attributes. Incremental Spatial Autocorrelation did not return any peak values, and Z-scores were above 1.95 for 11.32 m to 69.92 m sampling distances. Therefore, Getis-Ord Gi* was run using an interval of 20 m, just over twice the mean diameter (7.3 m) of circular structures in the sample of measured buildings, ensuring that all features had at least one neighbor but avoiding oversampling that could have resulted from using a larger interval in an area with close spacing among structures.
Figure 4. Features created based on structures visible in lidar ground model of Kuelap, traced using Imagej.
Results
Evaluating the Bare Earth Model
Following automated and manual classification, just over 129,897,000 points remained in the point cloud used to produce our bare earth model, at a mean density of approximately 2000 points per square meter. While the absence of multiple returns resulted in reduced point density in some of the most forested portions of the site, comparison with previous maps of Kuelap suggests that we were able to capture all previously documented surface structures on the summit of the walled settlement, though we expect that additional structures remain to be defined beneath the currently exposed surface (). The total number of structures recorded (421) is nearly identical to the estimate of 420 generated by previous research (Ruiz Estrada Citation2009; Narváez Vargas Citation2013), but the level of detail provided on structural form is much greater. While we concentrate here only on the formal dimensions of structures, we should also note that the model also captures additional walls that define internal patios and divisions.
Figure 5. Hillshade produced from ground model of Kuelap, with major features labeled.
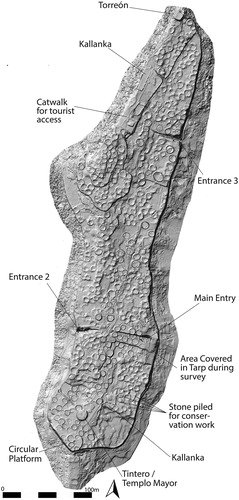
At the level of individual walls and buildings, the model’s resolution is variable. The survey produced dense point coverage from the exterior walls of most circular structures, but not all internal wall surfaces were captured in great detail (see ). This pattern holds across both the forested and unforested areas of the site, suggesting that the transects we flew across did not provide the coverage necessary to fully scan interior surfaces. This trend is unsurprising, as many of the structures incline inwards, obscuring them from aerial view. Moreover, point density does not appear to be high enough to resolve fine differences in masonry and individual building blocks on either the site’s monumental walls or the walls of smaller domestic structures. For scanning internal portions of domestic structures and resolving individual stones, terrestrial laser scanning would provide improved coverage, as would drone lidar with flight plans focused on increased point density (Kellner et al. Citation2019). Point densities on the vertical surface of the site’s monumental external walls are generally quite high, but they are lower than on the top of the citadel, with patchy coverage on the wall’s southeastern portion. Here, point density could no doubt be improved through data collected from lower flights around the exterior walls, an option we avoided in the field due to safety concerns. Finally, modern features present on the site surface also impacted data collection. During our survey, the main entrance to the citadel was covered with a plastic tarp that absorbed laser pulses, resulting in a large blank space in the bare earth model. In addition, while we removed stairways and handrails from the point cloud during the manual edition process, low wooden trackways that guide tourist foot traffic through the site are still clearly visible, as are numerous piles of stones accumulated during recent conservation work.
Data Analysis
The high spatial resolution of our model provides a means of examining previously unstudied aspects of architectural layout and construction at Kuelap, beginning with precise estimates of floor area. Among the 421 structures we mapped on the summit of the citadel, median floor area is 40.53 square meters, with a standard deviation of 16.18 square meters and three outliers—the large kallanka in the upper town (237.88 sq m), the tintero/templo mayor (158.29 sq m) and a single large circular structure 40 m south of entrance three (126.31 sq m) (see ). With the outliers removed, SD drops to 11.06 m. Each of the three large structures are located in distinct sectors of the site, rather than being clustered in a single district. Indeed, relatively little statistically significant spatial clustering of either low or high floor area values is present in the dataset.
Figure 6. At left, graduated symbols representing variation in building floor area at Kuelap. (symbols not proportional—larger icon = greater floor area); At right, hot spot analysis of building size.
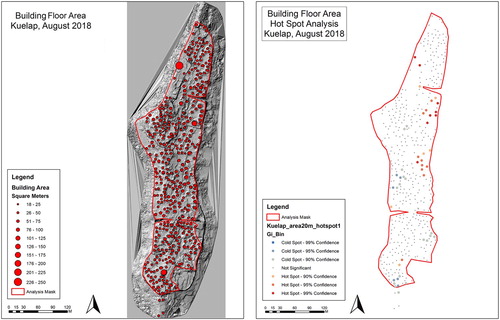
The appearance of the tintero and the larger of the two kallankas as hotspots seems to reflect the fact that they have relatively few neighbors at the 20 m sampling interval—a factor that, at least in the case of the kallanka, is related to its history as an Inka structure around which previously existing structures were destroyed in order to make room for an imperial installation placed atop a ritually important element of the landscape (exposed bedrock). Elsewhere, two areas with high-confidence clusters of larger floor area values are a group of nine structures arranged around an open space just to the south of the third entrance, among which is one of the three largest structures in the site. The other is another set of nine structures that also contain an open space and abut the eastern exterior wall.
Two clusters of structures have floor areas that are significantly smaller. The first is a group of eight in the middle portion of the lower town, near the western external wall. They do not appear to be arranged around a common open space. The second is the group atop the raised circular platform at the citadel’s southern tip, as well as three adjacent structures. The largest structure on the circular platform, which Narváez (Citation2013) suggests may have been the house of an elite family because of its size, is not particularly remarkable for its floor area (51.53 square meters) and it forms part of the cluster of lower floor area values.
Spatial patterns in building floor areas are mirrored in building perimeters, which is strongly correlated with floor area. Both building aspect ratio and roundness measures (which are the inverse of one another) distinguish the two kallankas from the site’s circular structures, but neither set of values clusters in a spatially significant way. More pronounced patterns are evident among circularity indices—which, indeed, are the attribute whose values are the single most spatially clustered of the entire dataset. In , both “hot” (highly circular buildings—i.e., those with high circularity indices) and “cold” (structures with exceptionally low circularity) appear in several areas of the site. In the southern portion of the lower town, just south of entrances one and two, a circularity hotspot contains a total of 44 structures. Near the geographic center of the walled site, two adjacent cold spots (containing 9 and 14 structures, respectively) nearly form a band across the width of the elevated plateau. A further cold spot is located in the highest portion of the site, in the circular center of the upper town. Due to its lack of neighbors and low circularity value (0.562), the kallanka in the upper town again appears as a singular cold spot. Finally, an additional cluster is visible just to the north of entrance number three. Notably, none of the clusters in the floor area data and the circularity indices significantly overlap with one another.
Figure 7. At left, graduated symbols representing variation in building circularity values at Kuelap. (Symbols are not proportional—smaller icon = more circular building). At right, hot spot analysis of building circularity.
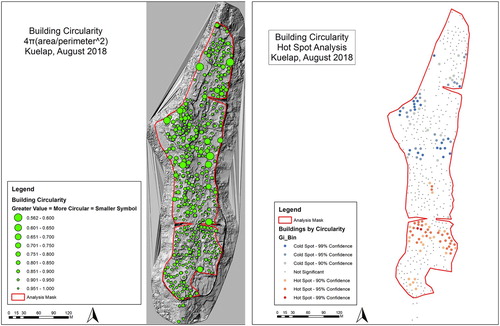
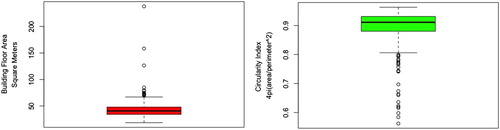
Figure 8. Boxplots showing distribution of building floor area and circularity of structures at Kuelap, calculated from features created in Imagej based on lidar ground model.
In addition to data generated by the Measure tool in Imagej, we should also note that the dataset captures qualitative differences in structures that are the result of conservation and archaeological excavation—i.e., the “sharpness” of walls apparent among structures in the far southern portion of the model, near the main entrance, along the central tourist corridor, and in a few isolated areas of the upper town and northern sector of the lower town. Clusters among circularity values crosscut areas of differential conservation, suggesting that these patterns are not the product of recent conservation efforts or reconstruction but rather that they reflect underlying variability in structural form.
Discussion
These two trends—modest clustering of floor area among small groups of structures and larger clusters of structures with similar circularity measures can be considered in light of other trends in architectural data at Kuelap to suggest several interpretations regarding the site’s organization and construction sequence. Each should be further tested through excavation and systematic dating efforts.
The absence of sizable clusters of particularly large or small houses at Kuelap is a trend previously noted for other Late Intermediate Period settlements in the region (Guengerich Citation2014)—one that differs markedly from more marked patterns of size clustering in sites in the central and southern Peruvian Andes (Arkush Citation2017; Arkush Citation2011; De Marrais Citation2002). At Monte Viudo, Guengerich finds a statistically significant correlation between house size and masonry type, in which houses with some forms of finely-worked masonry tend to be slightly larger than houses with more coarse stone walls. There, masonry type is not correlated with the remains of higher quality foods or portable material culture, but still appears convincingly related to social capital. Thus, while housing in typical Late Intermediate Period Chachapoya settlements does not demonstrate the kinds of spatial size segregation characteristic of hereditary monarchies or modern industrial societies, structure size may be interpreted as at least partially reflective of social status (Blanton Citation1994; Sivertsen Citation1963; Beardsley, Hall, and Ward Citation1959). At Kuelap, four clusters of 8–11 houses with modestly larger and smaller floor areas may reflect status shared among co-residential groups, which at least in some cases appear to have shared common patios. Notably, median floor area among structures at Kuelap appears to be nearly double that at Monte Viudo, where mean sizes are reportedly between 17 and 22 sq m (Guengerich Citation2014: figure 12), perhaps reflecting substantial differences in household sizes between the two settlements (Naroll Citation1962; LeBlanc Citation1970; Kramer Citation1980).
We further interpret large clusters of buildings with similar circularity indices as reflecting construction by distinct communities of builders, as well as perhaps major differences in site chronology. As previous authors have noted, morphological features of houses often reveal highly localized and idiosyncratic histories of construction (Blanton Citation1994; Guengerich Citation2014). The regularity of architectural form among Late Intermediate Period Chachapoya settlements (the circular house, with conical roof, sleeping platform, and central hearth) suggests a normative construction of the home—a structure of feeling, if not also certain more explicit norms, that guided the work of individual builders. Yet each moment of construction articulated these standards in distinct ways, reflecting distinct pathways of learning and communities of practice (Wenger Citation1999; Minar and Crown Citation2001; Crown Citation2007; Roddick and Stahl Citation2016). If, as Guengerich (Citation2014) convincingly argues, Chachapoya structures were built not under the watch of strong authorities that imposed standards on architects, but rather by groups of builders who introduced idiosyncrasies into the masonry and layouts of the structures they erected, we should expect the architectural construction to vary in time and space due to both drift and innovation. Under these conditions, we might also expect that subtle differences in architecture would index chronological differences.
Building circularity is one aspect of architectural style we might reasonably expect to reflect distinct performances of architectural norms, reflecting different techniques for measuring the dimensions of structures, as well as different standards and expectations of symmetry. At Kuelap, our data reveal large clusters of buildings with similar circularity values—two of them in east-to-west swaths extending across the site, which may reflect its southward and eastward growth over time, as suggested by Ruiz Estrada (Citation2009). We suggest that, as new sectors were added to the platform, its exterior walls may have been expanded out and circular structures placed atop the platform. In this scenario, each new construction stage would have been carried out by distinct groups of builders. In the upper town, where Ruiz’s excavations found what appears to be the earliest pottery at the site, exposed bedrock suggests that relatively little fill is present. The circular arrangement of structures at the southern end of the lower town, at the highest point of the site, greatly resembles some smaller hilltop settlements in the middle Utcubamba drainage that we have documented through pedestrian survey (Rojas Vega and VanValkenburgh Citation2017). Here, we find a substantial group of houses with low circularity values clustered together, in a manner quite similar to tiered mountaintop settlements such as Crestón, to the west of the modern town of Choctamal (Rojas Vega and VanValkenburgh Citation2017). We suggest that Kuelap may have begun as just such a settlement—a small hilltop village that gradually expanded into a walled necropolis whose monumental stone walls, packed with burials, emulated the form of cliff faces where regional traditions had long placed their dead (see Bradley, n.d.). We advocate further stratigraphic excavations to evaluate this proposed site chronology and history of construction.
Conclusion
Our high-resolution ground model of Kuelap, generated from drone lidar data, has revealed dimensions of variability in domestic architecture at the site that were obscured in previous models produced using lower-resolution instrumentation. Spatial analysis of these attributes has, in turn, enabled us to produce new hypotheses about the history and organization of the site. Our results illustrate the potential of drone lidar for enhancing topographic modeling on what Howey and colleagues (this volume) call the “safe” side of the spatio-temporal chart of remote sensing technologies, at high levels of spatial resolution. In our case study, it is spatial resolution and file size itself, rather than geographic or temporal scale, that characterize a collection of “big” data. And just as with the more geographically extensive datasets examined in other papers within this themed issue, the true potential of big data lies not in scale itself but in the application of critical analysis to datasets. Used in a conventional manner, higher resolution ground models based on drone lidar data risk reifying the site as a unit of archaeological analysis, under the guise of greater precision and accuracy (see McCoy, this issue). But examined critically, models based on lidar data can also reveal meaningful patterns in archaeological landscapes that were previously undocumented.
While our experience illustrates the interpretive potential of high-resolution datasets of archaeological landscapes, it also outlines several of the challenges and limitations of working with lidar data collected from UAV platforms—particularly the instrumental configuration we employed. In the coming years, innovation (and lowering costs) for autonomous vehicles and optical sensors, driven in part by the rapid development of technologies for driverless vehicles, will no doubt provide additional and more affordable options for instrumentation. But certain challenges will remain. Among the varieties of “big” aerial data, lidar is unique because of its potential to combine very high spatial (and in the case of lower cost, UAV-mounted platforms, high temporal) resolution with extensive geographic coverage. As a result, however, lidar datasets can be of sizes that are challenging to process with the computational resources available to archaeologists. In the near future, the tradeoff between spatial resolution and prohibitively large file sizes will mean that archaeological projects employing lidar will have to carefully consider their research questions when choosing instrumentation and data collection parameters. In the more distant future, additional options for automated processing and classification of data may reduce the size of these tradeoffs, making it possible for us to handle lidar datasets with resolutions of thousands of points per square meter covering hundreds or thousands of square kilometers.
Acknowledgments
Funding for this research was provided through a grant from the National Geographic Committee on Research and Exploration (HJ-044R-17). We would like to thank Jorge Trajo Ramos, Manuel Malaver, Jorge Chiguala, Jaime Jimenez, José la Torre, Alejandro Cuipal, Alcira Chavez, Llony Cuipal, Ema Perea Rios, David Blair, Henry Johnson, and the Institute at Brown for Environment and Society. Cushman’s research has also been supported by a Presidential Fellowship from Brown University and a Graduate Research Fellowship from the National Science Foundation.
Disclosure Statement
No potential conflict of interest was reported by the author.
Notes on Contributors
Parker VanValkenburgh (Ph.D. 2012, Harvard University) is Assistant Professor of Anthropology at Brown University, head of the Brown Digital Archaeology Library and an elected fellow of the Institute at Brown for Environment and Society. Among other research projects, he co-directs the Paisajes Arqueológicos de Chachapoyas project with Carol Rojas Vega and is and is co-editor, with Steven Wernke, of GeoPACHA: Geospatial Platform for Andean History, Culture, and Archaeology.
K. C. Cushman received her Ph.D. in Ecology and Evolutionary Biology at Brown University and the Institute at Brown for Environment and Society and is postdoctoral fellow at the Smithsonian Tropical Research Institute
Luis Jaime Castillo (Ph.D. 2012, University of California, Los Angeles) is Professor of Archaeology at the Pontificia Universidad Catolica del Peru, directs the San Jose de Moro Archaeological Program and the Digital Archive of Cultural Heritage. He is Foreign Associate member of the National Academy of Sciences and a National Geographic Society Explorer and has served as Vice Minister of Cultural Patrimony and Minister of Culture in Peru.
Carol Rojas Vega is an archaeological researcher based in Lima Peru and co-director of the Paisajes Arqueológicos de Chachapoyas Project, as well as other archaeological projects in Peru.
Carson B. Roberts is a Senior Applications Engineer at Headwall Photonics, Inc. His work concentrates on remote sensing and hyperspectral and LiDAR data analysis.
Charles Kepler is s a Manufacturing Engineer at Headwall Photonics, Inc. He is chief pilot for Headwall’s UAV operations, and supervises the construction and testing of UAV systems.
James Kellner (Ph.D. 2008, University of Georgia) is the Peggy and Henry D. Sharpe Jr. Assistant Professor of Environmental Studies, and an Assistant Professor of Ecology and Evolutionary Biology at Brown University. He is a member of the Science Team of the NASA Global Ecosystem Dynamics Investigation, which placed a waveform lidar sensor on the International Space Station.
ORCID
Parker VanValkenburgh http://orcid.org/0000-0002-4289-6170
K. C. Cushman http://orcid.org/0000-0002-3464-1151
References
- Arkush, E. 2017. “The End of Ayawiri: Abandonment at an Andean Hillfort Town of the Late Intermediate Period.” Journal of Field Archaeology 42 (3): 241–257. doi: 10.1080/00934690.2017.1308748
- Arkush, E. 2011. Hillforts of the Ancient Andes: Colla Warfare, Society, and Landscape. Gainesville, FL: University Press of Florida.
- Arroyo-Kalin, M. 2010. “The Amazonian Formative: Crop Domestication and Anthropogenic Soils.” Diversity 2 (4): 473–504. doi: 10.3390/d2040473
- Bandelier, A. F. 1907. The Indians and Aboriginal Ruins Near Chachapoyas in Northern Peru. New York: Historical Records and Studies.
- Beardsley, R. K., W. J. Hall, and R. E. Ward. 1959. Village Japan. Chicago: University of Chicago Press.
- Bewley, R. H., S. P. Crutchley, and C. A. Shell. 2005. “New Light on an Ancient Landscape: Lidar Survey in the Stonehenge World Heritage Site.” Antiquity 79 (305): 636–647. doi: 10.1017/S0003598X00114577
- Blanton, R. E. 1994. Houses and Households: A Comparative Study. New York: Springer Science & Business Media.
- Bonavia, D. 1981. “Tello y La Arqueologia de La Ceja de Selva.” Historica 5 (2): 149–158.
- Bradley, R. 2005. “The Architecture of Kuelap.” Ph.D. Diss., Columbia University.
- Bradley, R. n.d. “Reconsidering the Notion of Fortaleza Kuelap.” https://www.academia.edu/10678131/Reconsidering_the_Notion_of_Fortaleza_Kuelap.
- Brush, S. B. 1977. Mountain, Field, and Family: The Economy and Human Ecology of an Andean Valley. Philadelphia: University of Pennsylvania Press.
- Calders, K., M. I. Disney, J. Armston, A. Burt, B. Brede, N. Origo, J. Muir, and J. Nightengale. 2017. “Evaluation of the Range Accuracy and the Radiometric Calibration of Multiple Terrestrial Laser Scanning Instruments for Data Interoperability.” IEEE Transactions on Geoscience and Remote Sensing 55 (5): 2716–2724. doi: 10.1109/TGRS.2017.2652721
- Canuto, M. A., F. Estrada-Belli, T. G. Garrison, S. Houston, M. J. Acuña, M. Kováč, D. Marken, P. Nondédéo, L. Auld-Thomas, and C. Castanet. 2018. “Ancient Lowland Maya Complexity as Revealed by Airborne Laser Scanning of Northern Guatemala.” Science 361 (6409): eaau0137. doi: 10.1126/science.aau0137
- Chase, A. F., D. Z. Chase, J. J. Awe, J. F. Weishampel, G. Iannone, H. Moyes, J. Yaeger, and M. K. Brown. 2014. “The Use of LiDAR in Understanding the Ancient Maya Landscape: Caracol and Western Belize.” Advances in Archaeological Practice 2 (3): 208–221. doi: 10.7183/2326-3768.2.3.208
- Chase, A. F., D. Z. Chase, C. T. Fisher, S. J. Leisz, and J. F. Weishampel. 2012. “Geospatial Revolution and Remote Sensing LiDAR in Mesoamerican Archaeology.” Proceedings of the National Academy of Sciences 109 (32): 12916–12921. doi: 10.1073/pnas.1205198109
- Chase, A. F., D. Z. Chase, J. F. Weishampel, J. B. Drake, R. L. Shrestha, K. C. Slatton, J. J. Awe, and W. E. Carter. 2011. “Airborne LiDAR, Archaeology, and the Ancient Maya Landscape at Caracol, Belize.” Journal of Archaeological Science 38 (2): 387–398. doi: 10.1016/j.jas.2010.09.018
- Church, W. B. 1996. “Prehistoric Cultural Development and Interregional Interaction in the Tropical Montane Forests of Peru Volume.” Ph.D. Diss., Yale University.
- Church, W. B., and A. Von Hagen. 2008. “Chachapoyas: Cultural Development at an Andean Cloud Forest Crossroads.” In The Handbook of South American Archaeology, edited by H. Silverman, and W. H. Isbell, 903–926. New York: Springer.
- Church, W. B., and A. Guengerich. 2017. “La (Re)Construcción de Chachapoyas a Través de La Historia e Histografía.” Boletín de Arqueología PUCP 23: 5–38. doi: 10.18800/boletindearqueologiapucp.201702.000
- Clasby, R. 2014. “Early Ceremonial Architecture in the Ceja de Selva (800-100 BC): A Case Study from Huayurco, Jaén Region, Peru.” Ph.D. Diss., Yale University.
- Clement, C. R., W. M. Denevan, M. J. Heckenberger, A. B. Junqueira, E. G. Neves, W. G. Teixera, and W. I. Woods. 2015. “The Domestication of Amazonia before European Conquest.” Proceedings of the Royal Society B: Biological Sciences 282 (1812): 20150813. doi: 10.1098/rspb.2015.0813
- CloudCompare. 2019. GPL Software. Ver 2.10.2 http://www.cloudcompare.org/.
- Crandall, J. M. 2017. “El Desarrollo Espacial de Las Comunidades Chachapoyas Bajo La Dominación Colonial Inka y Española.” Boletín de Arqueología PUCP 23: 283–312. doi: 10.18800/boletindearqueologiapucp.201702.010
- Crown, P. L. 2007. “Life Histories of Pots and Potters: Situating the Individual in Archaeology.” American Antiquity 72 (4): 677–690. doi: 10.2307/25470440
- De Marrais, E. 2002. “The Architecture and Organization of Xauxa Settlements.” In Empire and Domestic Economy, edited by C. A. Hastorf and T. N. D’Altroy, 115–153. New York: Springer.
- Devereux, B. J., G. S. Amable, P. Crow, and A. D. Clif. 2005. “The Potential of Airborne Lidar for Detection of Archaeological Features under Woodland Canopies.” Antiquity 79 (305): 648–660. doi: 10.1017/S0003598X00114589
- Disney, M. I., M. B. Vicari, A. Burt, K. Calders, S. L. Lewis, P. Raumonen, and P. Wilkes. 2018. “Weighing Trees with Lasers: Advances, Challenges and Opportunities.” Interface Focus 8 (2): 20170048. doi: 10.1098/rsfs.2017.0048
- Espinoza Soriano, W. 1967. “Los Señoríos Étnicos de Chachapoyas y La Alianza Hispano-Chacha.” Revista Histórica 30: 224–333.
- Evans, D. H., R. J. Fletcher, C. Pottier, J.-B. Chevance, D. Soutif, B. S. Tan, S. Im, D. Ea, T. Tin, S. Kim, et al. 2013. “Uncovering Archaeological Landscapes at Angkor Using Lidar.” Proceedings of the National Academy of Sciences 110 (31): 12595–12600. doi: 10.1073/pnas.1306539110
- Fisher, C. T., and S. J. Leisz. 2013. ““New Perspectives on Purépecha Urbanism Through the Use of LiDAR at the Site of Angamuco, Mexico.” In Mapping Archaeological Landscapes from Space, edited by D. C. Comer and M. J. Harrower, 199–210. New York: Springer.
- Fisher, C. T., J. C. Fernández-Diaz, A. S. Cohen, O. N. Cruz, A. M. Gonzáles, S. J. Leisz, F. Pezzuitti, R. Shrestha, and W. Carter. 2016. “Identifying Ancient Settlement Patterns through LiDAR in the Mosquitia Region of Honduras.” PloS One 11 (8): e0159890. doi: 10.1371/journal.pone.0159890
- Garrison, T. G., S. Houston, and O. Alcover Firpi. 2019. “Recentering the Rural: Lidar and Articulated Landscapes among the Maya.” Journal of Anthropological Archaeology 53: 133–146. doi: 10.1016/j.jaa.2018.11.005
- Gil, N. 1938. “Dos Pueblos Prehistóricos Kuelapenses: Kacta y Chipuric.” Boletin de La Sociedad Geográfica (Lima) LV (2–3): 132–139.
- Golden, C., T. Murtha, B. Cook, D. S. Shaffer, W. Schroder, E. J. Hermitt, O. Alcover Firpi, and A. K. Scherer. 2016. “Reanalyzing Environmental Lidar Data for Archaeology: Mesoamerican Applications and Implications.” Journal of Archaeological Science: Reports 9: 293–308. doi: 10.1016/j.jasrep.2016.07.029
- Goodland, R. J. A., and H. S. Irwin. 1975. Amazon Jungle: Green Hell to Red Desert? An Ecological Discussion of the Environmental Impact of the Highway Construction Program in the Amazon Basin. Elsevier Scientific Publishing Co: Amsterdam.
- Guengerich, A. 2014. “The Architect’s Signature: The Social Production of a Residential Landscape at Monte Viudo, Chachapoyas, Peru.” Journal of Anthropological Archaeology 34: 1–16. doi: 10.1016/j.jaa.2013.12.005
- Guengerich, A. 2014. “Monte Viudo: Residential Architecture and the Everyday Production of Space in a Chachapoya Community.” Ph.D. Diss., The University of Chicago.
- Guengerich, A. 2015. “Settlement Organization and Architecture in Late Intermediate Period Chachapoyas, Northeastern Peru.” Latin American Antiquity 26 (3): 362–381. doi: 10.7183/1045-6635.26.3.362
- Halperin, C., and L. Schwartz, eds. 2016. Vernacular Architecture in the Pre-Columbian Americas. New York: Taylor & Francis.
- Hastings, C. M., and M. E. Moseley. 1975. “The Adobes of Huaca Del Sol and Huaca de La Luna.” American Antiquity 40 (2): 196–203. doi: 10.2307/279615
- Heckenberger, M. 2005. The Ecology of Power: Culture, Place, and Personhood in the Southern Amazon, A.D. 1000-2000. New York: Routledge.
- Heckenberger, M. J., J. C. Russell, C. Fausto, J. R. Toney, M. J. Schmidt, E. Pereira, B. Franchetto, and A. Kuikuro. 2008. “Pre-Columbian Urbanism, Anthropogenic Landscapes, and the Future of the Amazon.” Science 321 (5893): 1214–1217. doi: 10.1126/science.1159769
- Hesse, R. 2010. “LiDAR-Derived Local Relief Models–a New Tool for Archaeological Prospection.” Archaeological Prospection 17 (2): 67–72.
- Hutson, S. R. 2012. “‘Unavoidable Imperfections’: Historical Contexts for Representing Ruined Maya Buildings.” In Past Presented: Archaeological Illustration and the Ancient Americas, edited by J. Pillsbury, 282–316. Washington, D.C.: Dumbarton Oaks Research Library and Collection.
- Kellner, J. R., J. Armston, M. Birrer, K. C. Cushman, L. Duncanson, C. Eck, C. Falleger, B. Imbach, K. Král, and M. Krŭček. 2019. “New Opportunities for Forest Remote Sensing through Ultra-High-Density Drone Lidar.” Surveys in Geophysics 40 (4): 959–977. doi: 10.1007/s10712-019-09529-9
- Khan, S., L. Aragão, and J. Iriarte. 2017. “A UAV–Lidar System to Map Amazonian Rainforest and Its Ancient Landscape Transformations.” International Journal of Remote Sensing 38 (8–10): 2313–2330. doi: 10.1080/01431161.2017.1295486
- Kramer, C. 1980. ““Estimating Prehistoric Populations: An Ethnoarchaeological Approach.” L’Archèologie de L’Iraq: Perspectives et Limites de l’Interprétation Antropologique Des Documents.” In Colloques Internationaux du CNRS 580, 315–334. Paris: Editions de Centre National de la Recherche Scientifique.
- Le Moine, G., and J. S. Raymond. 1987. “Leishmaniasis and Inca Settlement in the Peruvian Jungle.” Journal of Historical Geography 13 (2): 113–129. doi: 10.1016/S0305-7488(87)80142-1
- Langlois, L. 1940. “Utcubamba: Investigaciones Arqueológicas En Este Valle Del Departmento de Amazonas (Perú).” Revista Del Museo Nacional 9 (1): 33–72.
- LeBlanc, S. 1970. “An Addition to Naroll’s Suggested Floor Area and Settlement Population Relationship.” American Antiquity 36 (2): 210–211. doi: 10.2307/278676
- Lerche, P. 1986. Häuptlingstum Jalca: Bevölkerung Und Ressourcen Bei Den Vorspanischen Chachapoya Peru. Berlin: D. Reimer.
- Levis, C., F. R. C. Costa, F. Bongers, M. Peña-Claros, C. R. Clement, A. R. Junqueira, E. G. Neves, E. K. Tamanaha, F. O. G. Figuereido, and R. P. Salomão. 2017. “Persistent Effects of Pre-Columbian Plant Domestication on Amazonian Forest Composition.” Science 355 (6328): 925–931. doi: 10.1126/science.aal0157
- Masini, N., R. Coluzzi, and R. Lasaponara. 2011. ““On the Airborne Lidar Contribution in Archaeology: From Site Identification to Landscape Investigation.” In Laser Scanning, Theory and Applications, edited by C. C. Wang, 263–290. Rijeka, Croatia: IntechOpen.
- Meggers, B. J. 1971. Amazonia: Man and Culture in a Counterfeit Paradise. Chicago: Aldine-Atherton, Inc.
- McCray, B. 2017. “Límites e Interfaces de Chachapoyas En La Región Rodríguez De Mendoza.” Boletín de Arqueología PUCP 23: 187–206. doi: 10.18800/boletindearqueologiapucp.201702.006
- Minar, C. J., and P. L. Crown. 2001. “Learning and Craft Production: An Introduction.” Journal of Anthropological Research 57 (4): 369–380. doi: 10.1086/jar.57.4.3631351
- Narváez Vargas, A. 1987. “Kuélap: Una Ciudad Fortificada en los Andes Nor-orientales de Amazonas, Peru.” In Arquitectura y Arqueologıa: Pasado y Futuro de la Construcción en el Peru, edited by V. Rangel, 115–142. Chiclayo: Universidad de Chiclayo.
- Narváez Vargas, A. 2013. “Kuelap: Centro Del Poder Político y Religioso de Los Chachapoyas.” In Los Chachapoyas, edited by F. Kaufmann Doig, 87–159. Lima: Banco de Credito.
- Naroll, R. 1962. “Floor Area and Settlement Population.” American Antiquity 27 (2): 587–588. doi: 10.2307/277689
- Neves, E. G., J. B. Petersen, R. N. Bartone, and C. A. Da Silva. 2003. “Historical and Socio-Cultural Origins of Amazonian Dark Earth.” In Amazonian Dark Earths: Origin, Properties, Management, edited by J. Lehmann, 29–50. Boston: Kluwer Academic.
- Opitz, R. S., K. Ryzewski, J. F. Cherry, and B. Moloney. 2015. “Using Airborne LiDAR Survey to Explore Historic-Era Archaeological Landscapes of Montserrat in the Eastern Caribbean.” Journal of Field Archaeology 40 (5): 523–541. doi: 10.1179/2042458215Y.0000000016
- Rasband, W. S. 1997. ImageJ. Version 1.8. Bethesda, Maryland, USA. https://imagej.nih.gov/ij/.
- Raymond, J. S. 1992. “Highland Colonization of the Peruvian Montaña in Relation to the Political Economy of the Huari Empire.” Journal of the Steward Anthropological Society 20 (1–2): 17–36.
- Reichlen, H., and P. Reichlen. 1950. “Recherches Archéologiques Dans Les Andes Du Haut Utcubamba: Deuxième Rapport de La Mission Ethnologique Française Au Perou Septentrional.” Journal de La Société Des Américanistes 39: 219–246. doi: 10.3406/jsa.1950.2388
- Risbøl, O. and L. Gustavsen. 2018. “LiDAR from Drones Employed for Mapping Archaeology: Potential, Benefits and Challenges.” Archaeological Prospection 25 (4): 329–338. doi: 10.1002/arp.1712
- Roddick, A. P., and A. B. Stahl, eds. 2016. Knowledge in Motion: Constellations of Learning Across Time and Place. Tucson: University of Arizona Press.
- Rojas Vega, C., and P. VanValkenburgh. 2017. Informe de la Primera Temporada del Proyecto Paisajes Arqueológicos de Choctamal, Chachapoyas. Report Submitted to the Puruvian National Ministry of Culture.
- Rousell, J.-R., and D. Auty. 2019. lidR: Airborne LiDAR Data Manipulation and Visualization for Forestry Applications. R package version 2.1.2.
- Ruiz Estrada, A. 1972. “La Alfareria de Cuelap: Tradición y Cambio.” B.A. Thesis, Universidad Nacional Mayor de San Marcos, Lima.
- Ruiz Estrada, A. 1979. “Los Monumentos Arqueológicos de Leimebamba.” Boletín de Lima 42: 69–82.
- Ruiz Estrada, A. 2009. La Alfareria de Cuelap: Tradición y Cambio. Lima: Avqi Ediciones.
- Ruiz Estrada, A. 2004. “Purumllacta: Un Centro Administrativo Incaico En Chachapoyas.” Investigaciones Sociales 8 (13): 73–84. doi: 10.15381/is.v8i13.6917
- Ruiz Estrada, A. 2017. “Deslindes Étnicos en la Historia de Amazonas, Peru.” Boletín de Arqueología PUCP 23: 41–56. doi: 10.18800/boletindearqueologiapucp.201702.001
- Savoy, G. 1970. Antisuyo: the Search for the Lost Cities of the Amazon. New York: Simon and Schuster.
- Schjellerup, I. R. 1997. Incas and Spaniards in the Conquest of the Chachapoyas: Archaeological and Ethnohistorical Research in the North-Eastern Andes of Peru. GOTARC, series B, Gothenburg Archaeological Theses, 7, Göthenburg, Sweden: Göteborg University.
- Schjellerup, I. R. 2003. Forgotten Valleys: Past and Present in the Utilization of Resources in the Ceja de Selva, Peru. Aarhus, Denmark: Aarhus Universitetsforlag.
- Shimada, I., and R. Cavallaro. 1985. “Monumental Adobe Architecture of the Late Prehispanic Northern North Coast of Peru.” Journal de La Société Des Américanistes 71 (1): 41–78. doi: 10.3406/jsa.1985.2252
- Shell, C. A., and C. F. Roughley. 2004. “Exploring the Loughcrew Landscape: A New Approachwith Airborne LIDAR.” Archaeology Ireland 18 (2): 20–3.
- Sivertsen, D. 1963. When Caste Barriers Fall: A Study of Social and Economic Change in a South Indian Village. New York: Humanities Press.
- Stahl, P. W. 2002. “Paradigms in Paradise: Revising Standard Amazonian Prehistory.” The Review of Archaeology 23 (2): 39–51.
- Team, R. Core. 2013. R: A Language and Environment for Statistical Computing.
- Thompson, D. 1976. Prehistory of the Uchucmarca Valley in the North Highlands of Peru. Proceedings of the 41st International Congress of Americanists. 99–106.
- Toyne, J. M., and A. Narváez. 2011. Patrones de Trauma Craneales Perimortem de Una Matanza de La Ocupacion Tardia En La Fortaleza de Kuelap, Chachapoyas. Paleopathology Association in South America, Lima, Peru.
- Toyne, J. M., and A. Narváez. 2014. “The Fall of Kuélap: Bioarchaeological Analysis of Death and Destruction on the Eastern Slopes of the Andes.” In Embattled Bodies, Embattled Places, edited by A. K. Scherer and J. Verano, 341–364. Washington D.C.: Dumbarton Oaks Research Library and Collection.
- Tringham, R. 1991. “Households with Faces: The Challenge of Gender in Prehistoric Architectural Remains.” In Engendering Archaeology: Women and Prehistory, edited by M. Conkey and J. Gero, 93–131. Cambridge, MA: Blackwell.
- Valdez, F. 2007. “Un Formativo Insospechado En La Ceja de Selva: El Complejo Cultural Mayo Chinchipe.” In II Congreso Ecuatoriano de Antropología y Arqueología, edited by F. S. García, 549–576. Quito: Abya Yala.
- Valdez, F. 2008. “Inter-Zonal Relationships in Ecuador.” In The Handbook of South American Archaeology, edited by H. Silverman, and W. H. Isbell, 865–888. New York: Springer.
- Wenger, E. 1999. Communities of Practice: Learning, Meaning, and Identity. Cambridge, UK: Cambridge University Press.
- Wilkinson, D. A. 2013. “Politics, Infrastructure and Non-Human Subjects: The Inka Occupation of the Amaybamba Cloud Forests.” Ph.D. Diss. Columbia University.
- Zhang, K., S.-C. Chen, D. Whitman, M.-L. Shyu, J. Yan, and C. Zhang. 2003. “A Progressive Morphological Filter for Removing Nonground Measurements from Airborne LIDAR Data.” IEEE Transactions on Geoscience and Remote Sensing 41 (4): 872–882. doi: 10.1109/TGRS.2003.810682